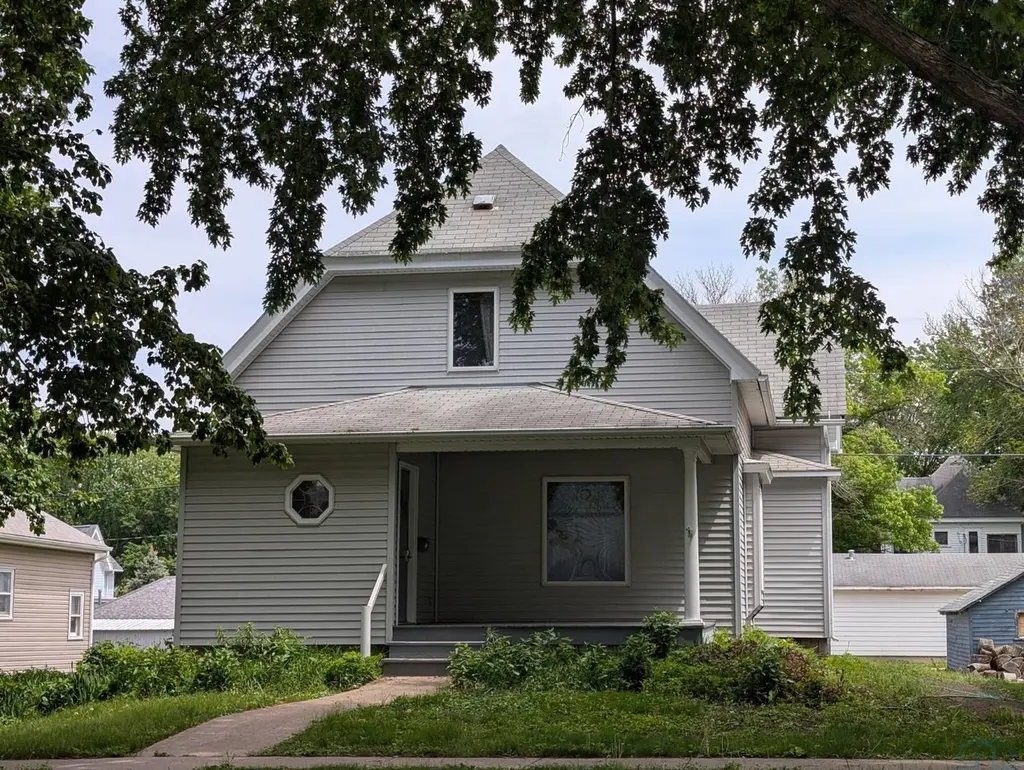
305 N Elm St · Marcus, IA
Flood risk 1/10 · Minimal
- FEMA flood zone
- X (unshaded)
- Chance of flooding over 30 yrs
- 0.0%
- Est. flood insurance / yr
- $473 – $860
Fire risk 1/10 · Minimal
- Est. fire insurance / yr
- $902 – $1,676
Heat risk 3/10 · Minor
- Hot days now (above 101°F)
- 7 days/yr
- Hot days in 30 yrs
- 15 days/yr
Wind risk 2/10 · Minimal
- Chance of severe wind over 30 yrs
- —
Air-quality risk 1/10 · Minimal
- Unhealthy air days now
- 0 days/yr
- Unhealthy air days in 30 yrs
- 0 days/yr
Risk factors via First Street. Map © Google.
Why this score? — see what drove the C+ grade
The composite is a weighted blend of 9 inputs, each scored 0–100. Each bar is that input's sub-score; the figure is the points it added to the 100-point composite (weight × sub-score).
- Cash flow +18.5/30.0
- ARV discount +15.0/15.0
- Schools +6.5/10.0
- DSCR +5.8/10.0
- 1% rule +4.0/10.0
- Livability +3.9/5.0
- Appreciation +2.9/10.0
- Rent growth +2.5/5.0
- Condition / age +2.5/5.0
$120,000
🖨 Deal sheet 📄 Offer letter ✓ Due diligence
Listing remarks
Well-kept 1,349 sq. ft. home offering comfortable living space, beautiful woodwork, practical updates, and flexible rooms for everyday use. Built in 1913, the home includes 2 upstairs bedrooms, a spacious living room, an eat-in kitchen with appliances included, a full bathroom on the main floor, main-floor laundry, a flexible office or extra bedroom, and a full unfinished basement. Outside, the property features a covered porch, vinyl siding, and a detached 2-car garage. The home is listed at $120,000, with a $10,000 roof replacement allowance available if completed within 6 months of closing.
Key facts
- Covered porch
- Flexible office
- Vinyl siding
Tags
Property features AI
Exterior
- Parking: Detached concrete garage with 2 spaces
- Utilities: Public water; Public sewer
- Home design: Single-family residence; Residential property
- Construction: Vinyl siding construction; Shingle roof
- Exterior features: Shingle roof; Vinyl siding; Public water; Public sewer; Zoned residential
Interior
- Bathrooms: 1 full bathroom
- Heating & cooling: Natural gas forced-air heating; Central air conditioning
- Interior features: Water softener; Unfinished basement
- Laundry & utility: Main-level laundry
Neighborhood map
What this means for you Summary
Snapshot
- This is a 2-bed/1.0-bath single-family listed at $120k.
Deal economics
- At list price, monthly cash flow is $114 ($1k/yr) — positive.
- The deal already cash-flows at list — no discount required.
- To meet the 1% rule (rent ≥ 1% of price), the offer needs to be $108k (10.1% below list).
- Recommended offer: $108k (10.1% below list) — sets the bar for 1% rule.
Location & tenants
- Location reads 78/100 on livability (#130 in IA, #2,373 nationally) — a middle-class / working-renter tenant base. Strengths: crime A+, cost of living A+, housing A+; Watch: amenities F, commute F.
- Marcus-Meriden-Cleghorn Community School District (rural): math 75% / reading 75% proficiency, ranked #102 of 330 in IA (top 31%) — strong family-tenant draw, lease renewals of 3-5y typical.
- Market conditions: 11 active listings in the ZIP; 10 units permitted in Cherokee County in 2024 (0 in 5+ unit buildings).
Forward outlook
- Local home prices are declining (-3.0%/yr); year-one equity from $830 of loan paydown is wiped out by about $4k of value loss. Plan a longer hold.
- Cherokee County population projected at -23% by 2050 — secular population decline; favor cash flow + early exit over multi-decade hold.
Negotiation context
- It's been on market 29 days — a 2% lower offer ($118k) is reasonable based on typical stale-listing flexibility.
Risks & watch-outs
- Watch-outs: built in 1913 — expect roof / HVAC / electrical / plumbing capex.
Questions for the listing agent
- Built in 1913 — when were the roof, HVAC, electrical panel, plumbing, and water heater last replaced?
- Is there a deadline driving the sale (1031 exchange, divorce, estate, relocation)? That informs how much negotiation room exists.
- Schools are A-rated — typically a magnet for longer-tenancy family renters. What's the average tenant stay here, and is there a school-zone premium baked into asking?
- What's the average days-on-market for RENTAL listings here right now (not sales)? A rising rental-DOM trend means longer vacancies and softer asking-rent achievability than the comps imply.
- What's the recent tenant-quality profile in this submarket — average credit score on applications, eviction rate, late-payment / NSF rate, and stable-employment percentage? A property-management company in the area should have these aggregated.
- How much new for-sale + rental construction is in the pipeline within 1–3 miles? Heavy new supply typically softens prices + rents 12–24 months out; constrained supply supports both.
Investment metrics
- 1% rule
- 0.90% ✗
- Cap rate
- 7.43%
- Cash-on-cash
- 4.06%
- DSCR
- 1.18
- GRM
- 9.3
CMA / ARV
- ARV (on-the-fly)
- $171,190
- Comps found
- 7
Show comp detail 7 sales within ~0.75 mi
| Address | Dist | Beds/Ba | Sqft | Sold | Price | $/sf | Match |
|---|---|---|---|---|---|---|---|
| 302 N Beech St | 0.11mi | 3/3.0 (+1) | 1,772 (-2%) | 8mo | $235,000 | $133 | 72 |
| 104 S Elm St | 0.22mi | 2/1.5 | 1,719 (-5%) | 11mo | $127,500 | $74 | 70 |
| 403 N Linn St | 0.41mi | 2/2.0 | 1,729 (-4%) | 4mo | $165,000 | $95 | 66 |
| 606 E Amherst St | 0.26mi | 2/1.5 | 1,922 (+7%) | 20mo | $150,000 | $78 | 58 |
| 308 S Elm St | 0.51mi | 3/2.0 (+1) | 1,960 (+9%) | 2mo | $252,350 | $129 | 52 |
| 109 N Oak St | 0.14mi | 3/2.0 (+1) | 1,626 (-10%) | 23mo | $155,000 | $95 | 49 |
| 204 Crestwood Dr | 0.48mi | 2/2.0 | 2,026 (+12%) | 24mo | $239,000 | $118 | 33 |
Match score weights: distance 35% · size 25% · config 20% · recency 20%. Top-matched comps best support the ARV.
Projected returns pro-forma
-3.0% appreciation · 3.0% rent growth · sell at horizon
- IRR
- -10.0%
- Equity multiple
- 0.64×
- Total profit
- $-12,251
- Equity at exit
- $17,892
- IRR
- -0.7%
- Equity multiple
- 0.95×
- Total profit
- $-1,513
- Equity at exit
- $10,375
Cash invested: $33,600 (down + closing). Projections, not guarantees.
Landlord ↔ Tenant lean methodology
- Overall (STATE)
- 83 Strongly Landlord-Friendly
- State Iowa
- 83 Strongly Landlord-Friendly · R+6
- County
- — inherits STATE
- City
- — inherits STATE
ZIP-level market 51035
- Home prices YoY
- -1.8%
- Active inventory
- 11
- Price-to-rent
- 9.3×
Monthly cashflow live
- Estimated rent
- $1,079 medium interval (Pro) →
- Mortgage (P&I)
- −$629
- Tax from tax record
- −$60 /mo · $716/yr
- Insurance
- −$50
- HOA
- −$0
- Vacancy / Maint / Mgmt
- −$227
- Net cashflow
- $114
Break-even live
UW: 25.0% down · 7.5% · 30yr · 1.5% tax · 5.0% vac · 8.0% maint · 8.0% mgmt
Financing live
Cash to close
- Down payment
- $30,000
- Closing costs
- $3,600
- Reserves months
- —
- Total cash needed
- —
Loan-product check · same deal, 3 products live
Conventional
25% down · 7.5% · 30yr
- Down + closing
- —
- Monthly P&I
- —
- Monthly cashflow
- —
- DSCR
- —
- Eligible?
- —
Personal DTI + credit; lowest rate.
DSCR
20% down · 8.5% · 30yr
- Down + closing
- —
- Monthly P&I
- —
- Monthly cashflow
- —
- DSCR
- —
- Eligible?
- —
No personal income docs; deal must DSCR.
Hard money
10% down · 12.0% · 12mo
- Down + closing
- —
- Monthly P&I
- —
- Monthly cashflow
- —
- DSCR
- —
- Eligible?
- —
Short-term bridge; refi at stabilization.
Listing history 16 events
-
2026-06-18days on market $120,000 Active 29 DOM
-
2026-06-17days on market $120,000 Active 28 DOM
-
2026-06-16days on market $120,000 Active 27 DOM
-
2026-06-15days on market $120,000 Active 26 DOM
-
2026-06-13days on market $120,000 Active 24 DOM
-
2026-06-12days on market $120,000 Active 23 DOM
-
2026-06-09days on market $120,000 Active 20 DOM
-
2026-06-08days on market $120,000 Active 19 DOM
-
2026-06-07days on market $120,000 Active 18 DOM
-
2026-06-05days on market $120,000 Active 16 DOM
-
2026-06-04days on market $120,000 Active 14 DOM
-
2026-06-02days on market $120,000 Active 13 DOM
-
2026-06-01days on market $120,000 Active 12 DOM
-
2026-05-31days on market $120,000 Active 11 DOM
-
2026-05-31days on market $120,000 Active 10 DOM
-
2026-05-20$120,000 Active
ⓘ Source: listings_history table (triggers on properties + properties_extension) + one-shot
backfill from property_details.listing_events for pre-trigger history.
Tax reassessment forecast IA · Partial reset (capped growth)
- Current annual tax
- $716 · $60/mo
- Projected year-2 tax
- $1,300 · $108/mo
- Expected delta
- +$584/yr (+$49/mo · 81.6%)
ⓘ Screening estimate from a state-policy table — verify with the county assessor before closing.
Climate risk First Street
- Flood 1/10 Low FEMA zone X (unshaded) · 0% chance over 30 yrs
- Wildfire 1/10 Low
- Heat 3/10 Moderate 7 d/yr ≥101°F today · 15 d/yr by 30 yrs out
- Wind 2/10 Low
- Air quality 1/10 Low 0 unhealthy d/yr today · 0 by 30 yrs out
Nearby sold comps map
Loading sold comps map…
Walkable amenities ~0.75 mi
Loading nearby amenities…
Taxation est. · year 1
- Rental income
- $12,950
- − Mortgage interest
- −$6,722
- − Property taxes
- −$716
- − Insurance
- −$600
- − Repairs & maintenance
- −$1,036
- − Management
- −$1,036
- − Depreciation
- −$3,491
- Taxable loss
- −$651
- Est. tax savings @ 24.0%
- +$156
- After-tax cash flow
- $1,519/yr
For passive investors: Depreciation is non-cash, so a rental often shows a tax loss while cash-flowing — sheltering income. Rental losses are passive: they offset passive income freely, and up to $25,000/yr can offset ordinary (W-2) income if you actively participate and your MAGI is under $100k (phasing out to $0 by $150k); unused losses carry forward. On sale, claimed depreciation is recaptured at up to 25%, and gains may owe capital-gains tax (a 1031 exchange can defer both). Figures are a year-1 estimate at your 24.0% rate — not tax advice; consult a CPA.
Schools (NCES district)
- District
- Marcus-Meriden-Cleghorn Community School District
- NCES district ID
- 1918630
- Math proficiency
- 75% ▼ -15.00%
- Reading proficiency
- 75% ▼ -15.00%
- Median HH income
- $54,764
- Composite
- 64.96/100
- National rank
- #1091
- State rank
- #102 of 330 in IA
Livability — Marcus
- Score
- 78/100
- State rank
- #130
- US rank
- #2373
Category grades
Schools grade is shown separately in the Schools card above.
Census & demographics
- Census place
- Marcus, IA
- Population (ZIP)
- 1,664
Population outlook (Cherokee County) Hauer SSP2
- Today (2025)
- 10,631 people
- By 2030
- 10,077 · -5.2%
- By 2040
- 9,015 · -15.2%
- By 2050
- 8,175 · -23.1%
- By 2075
- 7,192 · -32.3%
- By 2100
- 6,738 · -36.6%
Race, ethnicity, and origin ACS 2023
- Neighborhood character
- Predominantly White (89%)
- Race & ethnicity
- White 89% Black 5% Two or more races 4% Hispanic / Latino 2%
- Common ancestry
- Iranian 5% Portuguese 3% Lithuanian 3%
- Languages at home
- 98% English-only · German/W. Germanic 1% Spanish 1%
Political lean MEDSL · Cherokee
- 2024 margin
- Solid R (+45.8) · D 26.5% · R 72.2% · Other 1.3%
- 2008→2024 swing
- -38.2pp toward R · 2008: -7.6pp · 2024: -45.8pp
- All cycles
- 2024: R+45.8 2020: R+39.3 2016: R+40.6 2012: R+16.2 2008: R+7.6
Not yet ingested
- Civics
- —
Market trends
- HPI YoY
- ▼ -4.11%
- Current HPI
- 222.828
- Rent YoY
- —
- Metro
- —
- State GDP YoY
- ▲ 2.48%
- F500 in state
- 4
Industry mix (Fortune 500 HQ in IA)
| Industry | F500 HQs | Revenue |
|---|---|---|
| Financial Services | 1 | $16B |
|
||
| Retail / Convenience | 1 | $15B |
|
||
Price history
1 event — show timeline
- 2026-05-20 Listed $120,000 NWIA
Property tax history
+0.0%/yrLatest (2025): $716 · -9.1% YoY. Source: county tax records.
Cash-flow waterfall
monthlySold comps — $/sqft
last 12 mo · ≤1 miLoading sold comps…