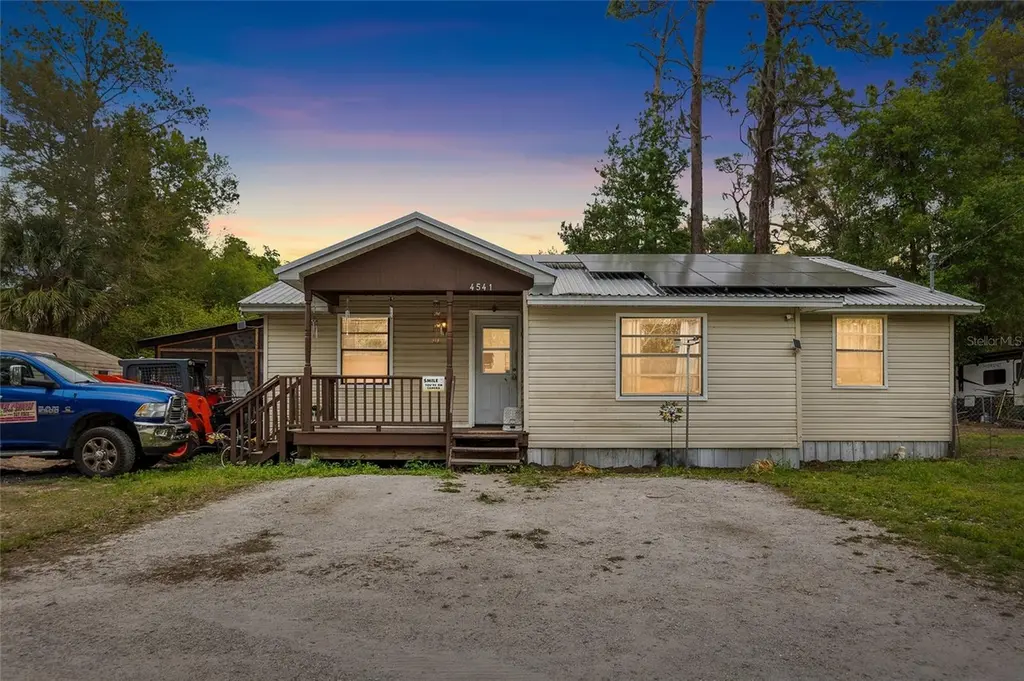
4541 N Winchester Ter · Hernando, FL
Flood risk 1/10 · Minimal
- FEMA flood zone
- X (unshaded)
- Chance of flooding over 30 yrs
- 0.0%
- Est. flood insurance / yr
- $507 – $1,088
Fire risk 5/10 · Moderate
- Est. fire insurance / yr
- $947 – $1,759
Heat risk 9/10 · Severe
- Hot days now (above 108°F)
- 7 days/yr
- Hot days in 30 yrs
- 23 days/yr
Wind risk 9/10 · Severe
- Chance of severe wind over 30 yrs
- 99.0%
Air-quality risk 1/10 · Minimal
- Unhealthy air days now
- 0 days/yr
- Unhealthy air days in 30 yrs
- 0 days/yr
Risk factors via First Street. Map © Google.
Why this score? — see what drove the B- grade
The composite is a weighted blend of 9 inputs, each scored 0–100. Each bar is that input's sub-score; the figure is the points it added to the 100-point composite (weight × sub-score).
- Cash flow +24.4/30.0
- ARV discount +15.0/15.0
- DSCR +7.9/10.0
- 1% rule +5.1/10.0
- Schools +4.1/10.0
- Livability +3.6/5.0
- Rent growth +2.5/5.0
- Condition / age +2.5/5.0
- Appreciation +0.0/10.0
$205,000
🖨 Deal sheet 📄 Offer letter ✓ Due diligence
Listing remarks MLS
HURRY! HURRY! PRICED TO SELL FIXER UPPER!! 4 bedroom with a den or could be a 5 bedroom. This is a house with 1536 living area. Perfect for families or retirees. Located on a quiet street not far from the Lake. Also has a front porch and a detached shop & lean to. Handicap ramp and handicap shower. CASH BUYERS ONLY.
Key facts
- Hardwood flooring
- Metal roof
- Accessible shower
Tags
Property features AI
Finance
- Other: Property zoned MDRMH
- Financial info:
- HOA & community: No homeowners association
Exterior
- Parking:
- Security:
- Utilities: Well water; Septic tank; Electricity connected; Cable connected; Water connected
- Home design: Single-family residence; One story; Home faces west; Homestead property
- Construction: Frame construction; Metal roof; Pillar/post/pier foundation; Built on a 0.23-acre lot
- Exterior features: Paved road access; Lot dimensions approximately 100 x 80
Interior
- Kitchen: Dishwasher; Range; Microwave; Refrigerator
- Bedrooms: 3 bedrooms
- Flooring: Laminate; Tile
- Bathrooms: 2 full bathrooms
- Heating & cooling: Central heating; Central air conditioning
- Interior features: Ceiling fans; Thermostat
- Laundry & utility: Laundry room; Washer; Dryer
Neighborhood map
What this means for you Summary
Snapshot
- This is a 3-bed/2.0-bath single-family listed at $205k.
Deal economics
- At list price, monthly cash flow is $418 ($5k/yr) — positive.
- The deal already cash-flows at list — no discount required.
- Meets the 1% rule at list price ($2k rent vs $205k).
- Recommended offer: $193k (6.0% below list) — sets the bar for market timing.
- Cap rate 8.7% vs local median 5.6% in Hernando — top-decile yield for the area; either an underpriced asset or a hidden risk that comps aren't pricing in. Stress-test before assuming the spread holds.
Location & tenants
- Location reads 71/100 on livability (#402 in FL) — a middle-class / working-renter tenant base. Strengths: cost of living A+, housing A+, health & safety A+; Watch: amenities F, commute F, employment D-.
- Citrus (rural): math 49% / reading 50% proficiency, ranked #44 of 73 in FL (top 60%) — families likely to look elsewhere, expect single-tenant / working-renter base with shorter leases.
- Market conditions: 444 active listings in the ZIP; 1 comparable units currently listed for rent nearby; 2,443 units permitted in Citrus County in 2024 (0 in 5+ unit buildings).
- This rent runs 43% of the median local income ($57k/yr) — at the standard rent-burdened threshold; future hikes will face affordability resistance.
Forward outlook
- Local home prices are declining (-3.0%/yr); year-one equity from $1k of loan paydown is wiped out by about $6k of value loss. Plan a longer hold.
- Citrus County population projected to shrink 10% by 2050 — rents likely to lag national; underwrite the cash flow, not the appreciation.
Negotiation context
- It's been on market 83 days — a 6% lower offer ($193k) is reasonable based on typical stale-listing flexibility.
- 3 sale attempts since 17y ago with the ask held roughly flat each time — persistent listings suggest the price (not the market) is what's stuck; bring a comps-based counter.
- Current owner paid $23k; list at $205k implies a 791% gain — meaningful room to come down on a strong offer.
Risks & watch-outs
- Climate carrying-cost: severe wind risk, 99% chance of damaging wind over 30y; moderate wildfire risk; extreme-heat days projected 7→23/yr by 2055 (HVAC capex compounding) — expect insurance premiums to compound above CPI over the hold.
Questions for the listing agent
- It's been on market 83 days. Have you received any prior offers? Is the seller open to a 6% concession, seller financing, or rate buy-down credit?
- Built in 1968 — when were the roof, HVAC, electrical panel, plumbing, and water heater last replaced?
- Why hasn't it sold? Are there any deal-killer items the seller is aware of (foundation, flood, title, zoning, code violations)?
- Is there a deadline driving the sale (1031 exchange, divorce, estate, relocation)? That informs how much negotiation room exists.
- What's the average days-on-market for RENTAL listings here right now (not sales)? A rising rental-DOM trend means longer vacancies and softer asking-rent achievability than the comps imply.
- What's the recent tenant-quality profile in this submarket — average credit score on applications, eviction rate, late-payment / NSF rate, and stable-employment percentage? A property-management company in the area should have these aggregated.
- How much new for-sale + rental construction is in the pipeline within 1–3 miles? Heavy new supply typically softens prices + rents 12–24 months out; constrained supply supports both.
Investment metrics
- 1% rule
- 1.01% ✓
- Cap rate
- 8.74%
- Cash-on-cash
- 8.74%
- DSCR
- 1.39
- GRM
- 8.2
CMA / ARV
- ARV (on-the-fly)
- $250,368
- Comps found
- 12
Show comp detail 12 sales within ~0.75 mi
| Address | Dist | Beds/Ba | Sqft | Sold | Price | $/sf | Match |
|---|---|---|---|---|---|---|---|
| 3658 E Arbor Lakes Dr | 0.62mi | 3/2.0 | 1,515 (-1%) | 3mo | $270,000 | $178 | 66 |
| 3622 E Arbor Lakes Dr | 0.58mi | 3/2.0 | 1,599 (+4%) | 2mo | $257,500 | $161 | 64 |
| 3748 E Lake Todd Dr | 0.69mi | 3/2.0 | 1,539 (+0%) | 11mo | $232,500 | $151 | 58 |
| 3682 E Lake Todd Dr | 0.63mi | 3/2.0 | 1,623 (+6%) | 5mo | $265,000 | $163 | 57 |
| 3548 E Cove Park Trl | 0.51mi | 3/2.0 | 1,704 (+11%) | 2mo | $210,000 | $123 | 56 |
| 4497 N Lake Vista Trl | 0.70mi | 3/2.0 | 1,614 (+5%) | 3mo | $239,000 | $148 | 56 |
| 4614 N Webster Island Ter | 0.67mi | 2/2.0 (-1) | 1,593 (+4%) | 9mo | $246,000 | $154 | 50 |
| 3564 E Cove Park Trl | 0.53mi | 3/2.0 | 1,678 (+9%) | 13mo | $295,000 | $176 | 49 |
| 3656 E Lake Todd Dr | 0.60mi | 3/2.0 | 1,715 (+12%) | 12mo | $326,000 | $190 | 43 |
| 3657 E Arbor Lakes Dr | 0.61mi | 3/2.0 | 1,308 (-15%) | 6mo | $260,000 | $199 | 42 |
| 3637 E Lake Todd Dr | 0.57mi | 3/2.0 | 1,740 (+13%) | 12mo | $330,000 | $190 | 41 |
| 3825 E Arbor Lakes Dr | 0.75mi | 3/2.0 | 1,730 (+13%) | 4mo | $240,000 | $139 | 40 |
Match score weights: distance 35% · size 25% · config 20% · recency 20%. Top-matched comps best support the ARV.
Projected returns pro-forma
-3.0% appreciation · 3.0% rent growth · sell at horizon
- IRR
- -3.1%
- Equity multiple
- 0.88×
- Total profit
- $-6,683
- Equity at exit
- $30,566
- IRR
- 6.6%
- Equity multiple
- 1.49×
- Total profit
- $28,101
- Equity at exit
- $17,725
Cash invested: $57,400 (down + closing). Projections, not guarantees.
Landlord ↔ Tenant lean methodology
- Overall (STATE)
- 87 Strongly Landlord-Friendly
- State Florida
- 87 Strongly Landlord-Friendly · R+3
- County
- — inherits STATE
- City
- — inherits STATE
ZIP-level market 34442
- Home prices YoY
- -21.9%
- Active inventory
- 444
- Price-to-rent
- 8.2×
Monthly cashflow live
- Estimated rent
- $2,074 medium interval (Pro) →
- Mortgage (P&I)
- −$1,075
- Tax from tax record
- −$60 /mo · $719/yr
- Insurance
- −$85
- HOA
- −$0
- Vacancy / Maint / Mgmt
- −$436
- Net cashflow
- $418
Break-even live
UW: 25.0% down · 7.5% · 30yr · 1.5% tax · 5.0% vac · 8.0% maint · 8.0% mgmt
Financing live
Cash to close
- Down payment
- $51,250
- Closing costs
- $6,150
- Reserves months
- —
- Total cash needed
- —
Loan-product check · same deal, 3 products live
Conventional
25% down · 7.5% · 30yr
- Down + closing
- —
- Monthly P&I
- —
- Monthly cashflow
- —
- DSCR
- —
- Eligible?
- —
Personal DTI + credit; lowest rate.
DSCR
20% down · 8.5% · 30yr
- Down + closing
- —
- Monthly P&I
- —
- Monthly cashflow
- —
- DSCR
- —
- Eligible?
- —
No personal income docs; deal must DSCR.
Hard money
10% down · 12.0% · 12mo
- Down + closing
- —
- Monthly P&I
- —
- Monthly cashflow
- —
- DSCR
- —
- Eligible?
- —
Short-term bridge; refi at stabilization.
Rent comps 1 comps
| Address | Beds | Baths | Sqft | Rent | $/sqft | DOM | Units | Dist |
|---|---|---|---|---|---|---|---|---|
| 3723 N Chandler Dr Hernando, FL | 3.0 | 2.0 | 1726 | $2,400 | $1.39 | 20d | 1 | 1.25mi |
Listing history 24 events
-
2026-06-19days on market $205,000 Active 83 DOM
-
2026-06-18days on market $205,000 Active 82 DOM
-
2026-06-17days on market $205,000 Active 81 DOM
-
2026-06-16days on market $205,000 Active 80 DOM
-
2026-06-15days on market $205,000 Active 79 DOM
-
2026-06-14days on market $205,000 Active 77 DOM
-
2026-06-13days on market $205,000 Active 76 DOM
-
2026-06-09days on market $205,000 Active 73 DOM
-
2026-06-08days on market $205,000 Active 72 DOM
-
2026-06-07days on market $205,000 Active 71 DOM
-
2026-06-03days on market $205,000 Active 67 DOM
-
2026-06-02days on market $205,000 Active 66 DOM
-
2026-06-01days on market $205,000 Active 65 DOM
-
2026-05-31days on market $205,000 Active 64 DOM
-
2026-05-30days on market $205,000 Active 63 DOM
-
2026-04-23price $205,000
-
2026-03-28$210,000 Active
-
2010-11-30soldstatus $23,000 323-char remark
Show marketing remark (323 chars)
HURRY! HURRY! PRICED TO SELL FIXER UPPER!! 4 bedroom with a den or could be a 5 bedroom. This is a house with 1536 living area. Perfect for families or retirees. Located on a quiet street not far from the Lake. Also has a front porch and a detached shop & lean to. Handicap ramp and handicap shower. CASH BUYERS ONLY.
-
2010-09-10$28,000 323-char remark
Show marketing remark (323 chars)
HURRY! HURRY! PRICED TO SELL FIXER UPPER!! 4 bedroom with a den or could be a 5 bedroom. This is a house with 1536 living area. Perfect for families or retirees. Located on a quiet street not far from the Lake. Also has a front porch and a detached shop & lean to. Handicap ramp and handicap shower. CASH BUYERS ONLY.
-
2009-06-03historical
-
2009-01-16$47,900
-
2003-01-24soldstatus $32,900
-
1998-06-05soldstatus $31,000
-
1983-03-01soldstatus $22,000
ⓘ Source: listings_history table (triggers on properties + properties_extension) + one-shot
backfill from property_details.listing_events for pre-trigger history.
Tax reassessment forecast FL · Resets to sale price
- Current annual tax
- $719 · $60/mo
- Projected year-2 tax
- $1,702 · $142/mo
- Expected delta
- +$982/yr (+$82/mo · 136.6%)
ⓘ Screening estimate from a state-policy table — verify with the county assessor before closing.
Climate risk First Street
- Flood 1/10 Low FEMA zone X (unshaded) · 0% chance over 30 yrs
- Wildfire 5/10 Major
- Heat 9/10 Extreme 7 d/yr ≥108°F today · 23 d/yr by 30 yrs out
- Wind 9/10 Extreme 99% chance of damaging wind over 30 yrs
- Air quality 1/10 Low 0 unhealthy d/yr today · 0 by 30 yrs out
Nearby sold comps map
Loading sold comps map…
Walkable amenities ~0.75 mi
Loading nearby amenities…
Taxation est. · year 1
- Rental income
- $24,888
- − Mortgage interest
- −$11,483
- − Property taxes
- −$719
- − Insurance
- −$1,025
- − Repairs & maintenance
- −$1,991
- − Management
- −$1,991
- − Depreciation
- −$5,964
- Taxable income
- $1,714
- Est. tax owed @ 24.0%
- −$411
- After-tax cash flow
- $4,605/yr
For passive investors: Depreciation is non-cash, so a rental often shows a tax loss while cash-flowing — sheltering income. Rental losses are passive: they offset passive income freely, and up to $25,000/yr can offset ordinary (W-2) income if you actively participate and your MAGI is under $100k (phasing out to $0 by $150k); unused losses carry forward. On sale, claimed depreciation is recaptured at up to 25%, and gains may owe capital-gains tax (a 1031 exchange can defer both). Figures are a year-1 estimate at your 24.0% rate — not tax advice; consult a CPA.
Schools (NCES district)
- District
- Citrus
- NCES district ID
- 1200270
- Math proficiency
- 49% ▼ -10.00%
- Reading proficiency
- 50% ▼ -6.00%
- Median HH income
- $38,618
- Composite
- 41.28/100
- National rank
- #3519
- State rank
- #44 of 73 in FL
Livability — Hernando
- Score
- 71/100
- State rank
- #402
- US rank
- #7137
Category grades
Schools grade is shown separately in the Schools card above.
Census & demographics
- Census place
- Hernando, FL
- County
- Citrus County · 111,314 people
- City population
- 17,281
- Metro
- Homosassa Springs, FL
- Population (ZIP)
- 17,281
- Household income
- $57,259
- Rent vs Own
- Severe rent burden
- 314.0
Population outlook (Citrus County) Hauer SSP2
- Today (2025)
- 138,622 people
- By 2030
- 136,886 · -1.3%
- By 2040
- 132,009 · -4.8%
- By 2050
- 125,196 · -9.7%
- By 2075
- 108,570 · -21.7%
- By 2100
- 84,454 · -39.1%
Race, ethnicity, and origin ACS 2023
- Neighborhood character
- Predominantly White (90%)
- Race & ethnicity
- White 90% Hispanic / Latino 4% Two or more races 3% Asian 2% Black 2%
- Common ancestry
- Romanian 4% Slovak 4% Lithuanian 3%
- Foreign-born
- 8% · Canada, China, South Korea
- Languages at home
- 93% English-only · Spanish 3% German/W. Germanic 2% Tagalog/Filipino 1%
Political lean MEDSL · Citrus
- 2024 margin
- Solid R (+45.9) · D 26.8% · R 72.6%
- 2008→2024 swing
- -29.8pp toward R · 2008: -16.1pp · 2024: -45.9pp
- All cycles
- 2024: R+45.9 2020: R+41.0 2016: R+39.7 2012: R+21.9 2008: R+16.1
Not yet ingested
- Civics
- —
Market trends
- HPI YoY
- ▼ -76.70%
- Current HPI
- 273.3262
- Rent YoY
- —
- Metro
- Homosassa Springs, FL
- State GDP YoY
- ▲ 3.28%
- F500 in state
- 36
Industry mix (Fortune 500 HQ in FL)
| Industry | F500 HQs | Revenue |
|---|---|---|
| Industrial Technology | 2 | $29B |
|
||
| Insurance | 2 | $17B |
|
||
| Retail | 1 | $60B |
|
||
| Technology Distribution | 1 | $58B |
|
||
| Homebuilding | 1 | $35B |
|
||
| Technology Manufacturing | 1 | $35B |
|
||
Price history
+831.8% since first listed9 events — show timeline
- 2026-04-23 Price Changed $205,000 Stellar MLS as Distributed by MLS Grid
- 2026-03-28 Listed $210,000 Stellar MLS as Distributed by MLS Grid
- 2010-11-30 Sold (MLS) $23,000 RACC
- 2010-09-10 Listed $28,000 RACC
- 2009-06-03 Listing Removed — Stellar MLS as Distributed by MLS Grid
- 2009-01-16 Listed $47,900 Stellar MLS as Distributed by MLS Grid
- 2003-01-24 Sold (Public Records) $32,900 Public Records
- 1998-06-05 Sold (Public Records) $31,000 Public Records
- 1983-03-01 Sold (Public Records) $22,000 Public Records
Property tax history
+2.6%/yrLatest (2025): $719 · +8.7% YoY. Source: county tax records.
Cash-flow waterfall
monthlySold comps — $/sqft
last 12 mo · ≤1 miLoading sold comps…