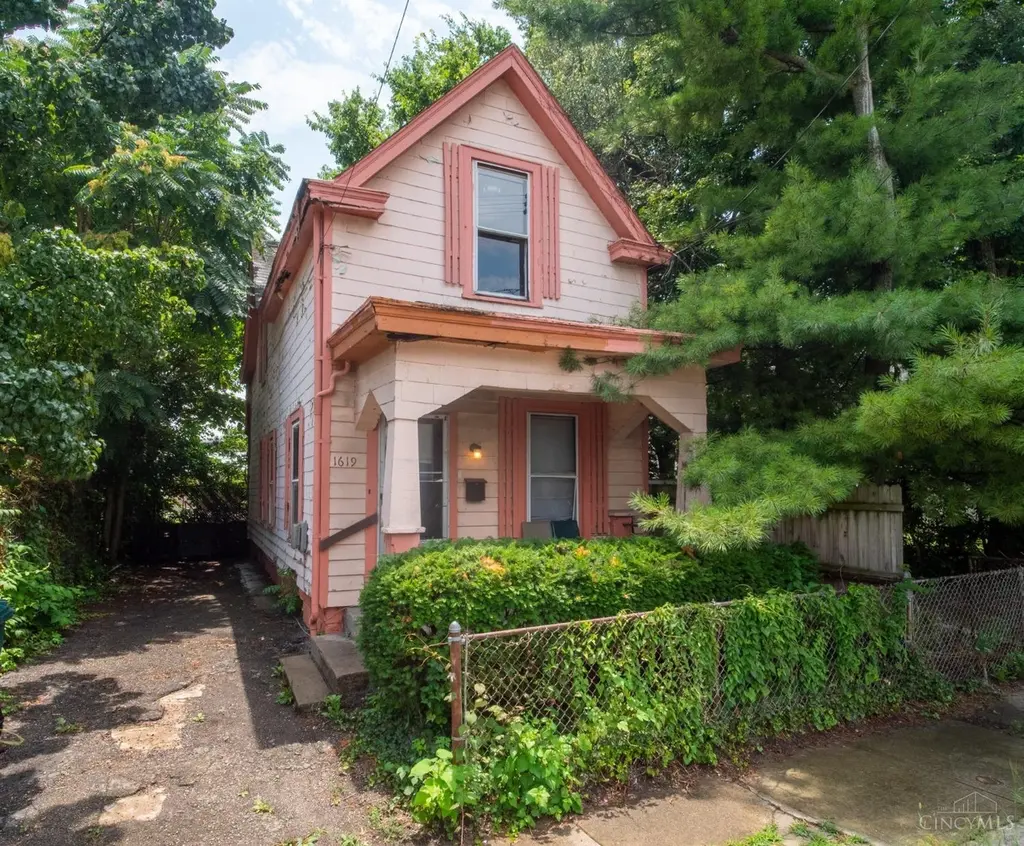
1619 Burgoyne St · Cincinnati, OH
Flood risk 3/10 · Minor
- FEMA flood zone
- X
- Chance of flooding over 30 yrs
- 0.1%
- Est. flood insurance / yr
- $473 – $860
Fire risk 1/10 · Minimal
- Est. fire insurance / yr
- $713 – $1,323
Heat risk 5/10 · Moderate
- Hot days now (above 103°F)
- 7 days/yr
- Hot days in 30 yrs
- 21 days/yr
Wind risk 2/10 · Minimal
- Chance of severe wind over 30 yrs
- 1.0%
Air-quality risk 3/10 · Minor
- Unhealthy air days now
- 2 days/yr
- Unhealthy air days in 30 yrs
- 3 days/yr
Risk factors via First Street. Map © Google.
Why this score? — see what drove the B- grade
The composite is a weighted blend of 9 inputs, each scored 0–100. Each bar is that input's sub-score; the figure is the points it added to the 100-point composite (weight × sub-score).
- Cash flow +28.6/30.0
- DSCR +10.0/10.0
- ARV discount +7.5/15.0
- 1% rule +7.4/10.0
- Rent growth +5.0/5.0
- Livability +4.0/5.0
- Schools +2.5/10.0
- Condition / age +2.5/5.0
- Appreciation +0.0/10.0
$99,000
🖨 Deal sheet (PDF) 📄 Offer letter ✓ Due diligence
Listing remarks MLS
Attention savvy investors! Look no further than this property that combines privacy and potential for growth. With a little TLC you can revive the natural beauty of this property and secure a valuable addition to your investment portfolio.
Key facts
- 1,742 sq ft lot
- Built 1909
- Listed 54 days
Property features AI
Finance
- HOA & community: No homeowners association
Exterior
- Parking: Off-street parking via driveway
- Security: Smoke alarm
- Utilities: Public water; Public sewer; Natural gas service
- Home design: Traditional single-family home; Two levels; Block foundation; Wood siding exterior; Shingle roof
- Construction: Wood siding construction; Block foundation; Shingle roof
- Exterior features: Covered deck/patio; Porch; Metal fencing; Cable and smoke alarm present
Interior
- Kitchen: Counter bar; Vinyl flooring in kitchen; Oven/Range
- Bedrooms: Two bedrooms (both on second level); Primary bedroom about 13 x 12; Second bedroom about 13 x 10
- Flooring: Vinyl flooring in kitchen; Wall-to-wall carpet in living and dining areas; Concrete floor in basement
- Bathrooms: One full bathroom (second level); One half bathroom (first level)
- Heating & cooling: Forced air heating; Gas water heating
- Interior features: Built-in bookcases; Wall-to-wall carpet in living and dining areas; Fireplace (gas)
- Laundry & utility: Basement utility space (unfinished)
Neighborhood map
What this means for you Summary
Snapshot
- This is a 2-bed/1.0-bath single-family listed at $99k.
Deal economics
- At list price, monthly cash flow is $325 ($4k/yr) — positive.
- The deal already cash-flows at list — no discount required.
- Meets the 1% rule at list price ($1k rent vs $99k).
- Recommended offer: $96k (3.0% below list) — sets the bar for market timing.
- Cap rate 10.2% vs local median 3.9% in Cincinnati — top-decile yield for the area; either an underpriced asset or a hidden risk that comps aren't pricing in. Stress-test before assuming the spread holds.
Location & tenants
- Location reads 80/100 on livability (#130 in OH, #1,856 nationally) — a professional / high-income tenant draw. Strengths: amenities A+, commute A+, cost of living A+; Watch: employment D, crime F.
- Cincinnati Public Schools (urban): math 25% / reading 36% proficiency, ranked #581 of 656 in OH (top 89%) — families likely to look elsewhere, expect single-tenant / working-renter base with shorter leases; 70% free/reduced lunch — lower-income household profile, screen leases tightly.
- Market conditions: Rents rising fast (+16.7%/yr); 46 active listings in the ZIP; 40 comparable units currently listed for rent nearby; rentals at typical pace (median 18d on market — plan ~3-4 weeks tenant-placement turnaround); 801 units permitted in Hamilton County in 2024 (190 in 5+ unit buildings).
Forward outlook
- Local home prices are declining (-3.0%/yr); year-one equity from $684 of loan paydown is wiped out by about $3k of value loss. Plan a longer hold.
- At projected returns (-3.0% appreciation + 8.0% rent growth), your $28k cash investment doubles in ~7 years — after that, you're playing with house money.
Negotiation context
- It's been on market 54 days — a 3% lower offer ($96k) is reasonable based on typical stale-listing flexibility.
- 10 sale attempts since 17y ago with the ask held roughly flat each time — persistent listings suggest the price (not the market) is what's stuck; bring a comps-based counter.
- Current owner paid $6k; list at $99k implies a 1550% gain — meaningful room to come down on a strong offer.
Risks & watch-outs
- Watch-outs: built in 1909 — expect roof / HVAC / electrical / plumbing capex.
- Climate carrying-cost: extreme-heat days projected 7→21/yr by 2055 (HVAC capex compounding) — expect insurance premiums to compound above CPI over the hold.
Questions for the listing agent
- It's been on market 54 days. Have you received any prior offers? Is the seller open to a 3% concession, seller financing, or rate buy-down credit?
- Built in 1909 — when were the roof, HVAC, electrical panel, plumbing, and water heater last replaced?
- Is there a deadline driving the sale (1031 exchange, divorce, estate, relocation)? That informs how much negotiation room exists.
- Schools are B-rated — typically a magnet for longer-tenancy family renters. What's the average tenant stay here, and is there a school-zone premium baked into asking?
- Crime grade is F in this area — have there been break-ins, vandalism, or insurance claims at this property in the last 3 years? What carrier currently insures it and at what premium?
- What's the average days-on-market for RENTAL listings here right now (not sales)? A rising rental-DOM trend means longer vacancies and softer asking-rent achievability than the comps imply.
- What's the recent tenant-quality profile in this submarket — average credit score on applications, eviction rate, late-payment / NSF rate, and stable-employment percentage? A property-management company in the area should have these aggregated.
- How much new for-sale + rental construction is in the pipeline within 1–3 miles? Heavy new supply typically softens prices + rents 12–24 months out; constrained supply supports both.
Investment metrics
- 1% rule
- 1.24% ✓
- Cap rate
- 10.24%
- Cash-on-cash
- 14.09%
- DSCR
- 1.63
- GRM
- 6.7
CMA / ARV
- ARV (on-the-fly)
- $234,710
- Comps found
- 4
Show comp detail 4 sales within ~0.75 mi
| Address | Dist | Beds/Ba | Sqft | Sold | Price | $/sf | Match |
|---|---|---|---|---|---|---|---|
| 3950 King Pl | 0.32mi | 2/2.0 | 884 (-8%) | 9mo | $146,000 | $165 | 61 |
| 4161 Apple St | 0.44mi | 2/1.5 | 1,078 (+12%) | 8mo | $105,000 | $97 | 50 |
| 4240 Fergus St | 0.66mi | 1/1.0 (-1) | 974 (+2%) | 20mo | $239,000 | $245 | 44 |
| 1762 Hanfield St | 0.56mi | 2/1.0 | 848 (-12%) | 23mo | $210,000 | $248 | 35 |
Match score weights: distance 35% · size 25% · config 20% · recency 20%. Top-matched comps best support the ARV.
Projected returns pro-forma
-3.0% appreciation · 8.0% rent growth · sell at horizon
- IRR
- 9.7%
- Equity multiple
- 1.40×
- Total profit
- $11,154
- Equity at exit
- $14,761
- IRR
- 22.5%
- Equity multiple
- 3.38×
- Total profit
- $65,842
- Equity at exit
- $8,560
Cash invested: $27,720 (down + closing). Projections, not guarantees.
Landlord ↔ Tenant lean methodology
- Overall (STATE)
- 73 Landlord-Friendly
- State Ohio
- 73 Landlord-Friendly · R+6
- County
- — inherits STATE
- City
- — inherits STATE
ZIP-level market 45223
- Rents YoY
- 16.7%
- Active inventory
- 46
- Price-to-rent
- 6.7×
Monthly cashflow live
- Estimated rent
- $1,225 high interval (Pro) →
- Mortgage (P&I)
- −$519
- Tax from tax record
- −$82 /mo · $983/yr
- Insurance
- −$41
- HOA
- −$0
- Vacancy / Maint / Mgmt
- −$257
- Net cashflow
- $325
Break-even live
Sensitivity live
| Price | -10% $382 | -5% $353 | +0% $325 | +5% $297 | +10% $269 |
|---|---|---|---|---|---|
| Rent | -10% $229 | -5% $277 | +0% $325 | +5% $374 | +10% $422 |
| Rate | -1.0pp $375 | -0.5pp $351 | base $325 | +0.5pp $300 | +1.0pp $274 |
UW: 25.0% down · 7.5% · 30yr · 1.5% tax · 5.0% vac · 8.0% maint · 8.0% mgmt
Financing live
Cash to close
- Down payment
- $24,750
- Closing costs
- $2,970
- Reserves months
- —
- Total cash needed
- —
Loan-product check · same deal, 3 products live
Conventional
25% down · 7.5% · 30yr
- Down + closing
- —
- Monthly P&I
- —
- Monthly cashflow
- —
- DSCR
- —
- Eligible?
- —
Personal DTI + credit; lowest rate.
DSCR
20% down · 8.5% · 30yr
- Down + closing
- —
- Monthly P&I
- —
- Monthly cashflow
- —
- DSCR
- —
- Eligible?
- —
No personal income docs; deal must DSCR.
Hard money
10% down · 12.0% · 12mo
- Down + closing
- —
- Monthly P&I
- —
- Monthly cashflow
- —
- DSCR
- —
- Eligible?
- —
Short-term bridge; refi at stabilization.
Rent comps 40 comps
| Address | Beds | Baths | Sqft | Rent | $/sqft | DOM | Units | Dist |
|---|---|---|---|---|---|---|---|---|
| 4046 Colerain Ave Unit 1 Cincinnati, OH | 1.0 | 1.0 | 900 | $1,400 | $1.56 | 4d | 1 | 0.33mi |
| 1686 Blue Rock St Cincinnati, OH | 1.0 | 1.0 | 750 | $1,045 | $1.39 | 5d | 1 | 0.33mi |
| 1580 Blue Rock St Cincinnati, OH | 2.0 | 1.0–2.0 | 730 | $1,970 | $2.70 | 2d | 5 | 0.34mi |
| 4101 Spring Grove Ave Cincinnati, OH | 2.0 | 1.0–2.0 | 2586 | $2,130 | $0.82 | 2d | 8 | 0.41mi |
| 1905 Elmore St Cincinnati, OH | 3.0 | 1.0 | 925 | $1,320 | $1.43 | 14d | 3 | 0.46mi |
| 4308 Hamilton Ave Unit 9 Cincinnati, OH | 2.0 | 1.0 | 650 | $925 | $1.42 | 24d | 1 | 0.70mi |
| 1710 Bruce Ave Cincinnati, OH | 2.0 | 1.0 | 974 | $1,495 | $1.53 | 24d | 1 | 0.83mi |
| 3301 Colerain Ave Cincinnati, OH | 1.0 | 1.0 | 1021 | $1,491 | $1.46 | 5d | 9 | 0.87mi |
| 500 Lafayette Ave Unit 500-202 Cincinnati, OH | 1.0 | 1.0 | 640 | $1,595 | $2.49 | 24d | 1 | 0.96mi |
| 1934 Kentucky Ave Unit 10 Cincinnati, OH | 1.0 | 1.0 | 608 | $898 | $1.48 | 5d | 1 | 0.98mi |
| 1932 Kentucky Ave Cincinnati, OH | 1.0–2.0 | 1.0 | 668 | $1,098 | $1.64 | 3d | 4 | 0.98mi |
| 1948 Kentucky Ave Apt 2 Cincinnati, OH | 2.0 | 1.0 | 728 | $1,098 | $1.51 | 24d | 1 | 0.99mi |
| 1938 Kentucky Ave Unit 3 Cincinnati, OH | 1.0 | 1.0 | 608 | $898 | $1.48 | 5d | 1 | 0.99mi |
| 4479 Colerain Ave Cincinnati, OH | 1.0–2.0 | 1.0 | 762 | $1,075 | $1.41 | 24d | 1 | 1.00mi |
| 1599 Glen Parker Ave Apt 12 Cincinnati, OH | 1.0 | 1.0 | 539 | $850 | $1.58 | 24d | 1 | 1.01mi |
| 1599 Glen Parker Ave Unit 3 Cincinnati, OH | 1.0 | 1.0 | 539 | $825 | $1.53 | 24d | 1 | 1.01mi |
| 1942 Kentucky Ave Unit 10 Cincinnati, OH | 2.0 | 1.0 | 728 | $1,098 | $1.51 | 4d | 1 | 1.01mi |
| 1942 Kentucky Ave Unit 8 Cincinnati, OH | 2.0 | 1.0 | 728 | $1,098 | $1.51 | 24d | 1 | 1.01mi |
| 1974 Kentucky Ave Cincinnati, OH | 2.0 | 1.0 | 728 | $1,098 | $1.51 | 5d | 1 | 1.03mi |
| 1976 Kentucky Ave Unit 7 Cincinnati, OH | 1.0 | 1.0 | 608 | $898 | $1.48 | 17d | 1 | 1.03mi |
| 458 Wood Ave Unit 458-05 Cincinnati, OH | 1.0 | 1.0 | 550 | $895 | $1.63 | 5d | 1 | 1.03mi |
| 1590 Glen Parker Ave Unit 8 Cincinnati, OH | 2.0 | 1.0 | 794 | $995 | $1.25 | 15d | 1 | 1.03mi |
| 1946 Kentucky Ave Cincinnati, OH | 1.0 | 1.0 | 608 | $898 | $1.48 | 5d | 1 | 1.04mi |
| 1978 Kentucky Ave Unit 7 Cincinnati, OH | 2.0 | 1.0 | 728 | $1,098 | $1.51 | 24d | 1 | 1.05mi |
| 1976 Kentucky Ave Cincinnati, OH | 1.0 | 1.0 | 608 | $898 | $1.48 | 24d | 1 | 1.06mi |
| 1932-1978 Kentucky Ave Cincinnati, OH | 2.0 | 1.0 | 728 | $1,098 | $1.51 | 17d | 1 | 1.06mi |
| 3107 Colerain Ave Unit 1 Cincinnati, OH | 1.0 | 1.0 | 700 | $895 | $1.28 | 17d | 1 | 1.09mi |
| 3103 Colerain Ave Unit 1 Cincinnati, OH | 1.0 | 1.0 | 700 | $895 | $1.28 | 24d | 1 | 1.10mi |
| 3271 Morrison Ave Unit 7 Cincinnati, OH | 2.0 | 1.0 | 526 | $1,195 | $2.27 | 20d | 1 | 1.19mi |
| 353 McAlpin Ave Unit 353-05 Cincinnati, OH | 1.0 | 1.0 | 670 | $895 | $1.34 | 4d | 1 | 1.20mi |
| 3346 Sherlock Ave Cincinnati, OH | 1.0 | 1.0 | 800 | $1,275 | $1.59 | 24d | 1 | 1.20mi |
| 596 Lowell Ave Unit 596-06 Cincinnati, OH | 2.0 | 1.0 | 580 | $995 | $1.72 | 24d | 1 | 1.22mi |
| 440 Ludlow Ave Unit 440-11 Cincinnati, OH | 2.0 | 1.0 | 655 | $1,195 | $1.82 | 24d | 1 | 1.23mi |
| 714 Clifton Colony Dr Cincinnati, OH | 1.0 | 1.0 | 605 | $825 | $1.36 | 4d | 31 | 1.24mi |
| 3404 Whitfield Ave Cincinnati, OH | 2.0 | 1.0 | 1291 | $1,595 | $1.23 | 5d | 55 | 1.28mi |
| 563 Lowell Ave Unit 563-06 Cincinnati, OH | 1.0 | 1.0 | 525 | $895 | $1.70 | 24d | 1 | 1.29mi |
| 550 Lowell Ave Unit 550-11 Cincinnati, OH | 2.0 | 1.0 | 610 | $1,195 | $1.96 | 24d | 1 | 1.31mi |
| 3570 McHenry Ave Unit 3574-3 Cincinnati, OH | 2.0 | 1.0 | 900 | $1,000 | $1.11 | 24d | 1 | 1.31mi |
| 551 Lowell Ave Unit 551-10 Cincinnati, OH | 1.0 | 1.0 | 525 | $795 | $1.51 | 5d | 1 | 1.32mi |
| 717 Martin Luther King Dr W Cincinnati, OH | 2.0 | 1.0–2.0 | 767 | $1,875 | $2.44 | 2d | 56 | 1.33mi |
Listing history 28 events
-
2026-06-02days on market $99,000 Active 54 DOM
-
2026-06-01days on market $99,000 Active 53 DOM
-
2026-05-31days on market $99,000 Active 52 DOM
-
2026-04-09$99,000 Active
-
2025-12-30historical 239-char remark
Show marketing remark (239 chars)
Attention savvy investors! Look no further than this property that combines privacy and potential for growth. With a little TLC you can revive the natural beauty of this property and secure a valuable addition to your investment portfolio.
-
2025-12-03price $95,900 239-char remark
Show marketing remark (239 chars)
Attention savvy investors! Look no further than this property that combines privacy and potential for growth. With a little TLC you can revive the natural beauty of this property and secure a valuable addition to your investment portfolio.
-
2025-10-30$99,900 Active 239-char remark
Show marketing remark (239 chars)
Attention savvy investors! Look no further than this property that combines privacy and potential for growth. With a little TLC you can revive the natural beauty of this property and secure a valuable addition to your investment portfolio.
-
2025-10-29historical 239-char remark
Show marketing remark (239 chars)
Attention savvy investors! Look no further than this property that combines privacy and potential for growth. With a little TLC you can revive the natural beauty of this property and secure a valuable addition to your investment portfolio.
-
2025-09-04$99,900 Active 239-char remark
Show marketing remark (239 chars)
Attention savvy investors! Look no further than this property that combines privacy and potential for growth. With a little TLC you can revive the natural beauty of this property and secure a valuable addition to your investment portfolio.
-
2025-08-01historical
-
2025-07-24status Active
-
2025-07-05historical Contingency Pending
-
2025-06-17price $110,000
-
2025-05-01$122,000 Active
-
2025-04-28historical
-
2025-03-13$129,000 Active
-
2025-02-27historical
-
2024-12-16$139,900 Active
-
2024-11-18historical
-
2024-09-20$139,000 Active
-
2024-09-19historical
-
2024-08-26price $159,000
-
2024-07-11$179,000 Active
-
2009-04-27soldstatus $6,000
-
2009-01-30$9,000
-
1996-01-11soldstatus $33,000
-
1995-07-26soldstatus $18,000
-
1990-07-16soldstatus $8,500
ⓘ Source: listings_history table (triggers on properties + properties_extension) + one-shot
backfill from property_details.listing_events for pre-trigger history.
Tax reassessment forecast OH · Partial reset (capped growth)
- Current annual tax
- $983 · $82/mo
- Projected year-2 tax
- $1,264 · $105/mo
- Expected delta
- +$281/yr (+$23/mo · 28.6%)
ⓘ Screening estimate from a state-policy table — verify with the county assessor before closing.
Climate risk First Street
- Flood 3/10 Moderate FEMA zone X · 10% chance over 30 yrs
- Wildfire 1/10 Low
- Heat 5/10 Major 7 d/yr ≥103°F today · 21 d/yr by 30 yrs out
- Wind 2/10 Low 100% chance of damaging wind over 30 yrs
- Air quality 3/10 Moderate 2 unhealthy d/yr today · 3 by 30 yrs out
Nearby sold comps map
Loading sold comps map…
Walkable amenities ~0.75 mi
Loading nearby amenities…
Taxation est. · year 1
- Rental income
- $14,701
- − Mortgage interest
- −$5,546
- − Property taxes
- −$983
- − Insurance
- −$495
- − Repairs & maintenance
- −$1,176
- − Management
- −$1,176
- − Depreciation
- −$2,880
- Taxable income
- $2,445
- Est. tax owed @ 24.0%
- −$587
- After-tax cash flow
- $3,319/yr
For passive investors: Depreciation is non-cash, so a rental often shows a tax loss while cash-flowing — sheltering income. Rental losses are passive: they offset passive income freely, and up to $25,000/yr can offset ordinary (W-2) income if you actively participate and your MAGI is under $100k (phasing out to $0 by $150k); unused losses carry forward. On sale, claimed depreciation is recaptured at up to 25%, and gains may owe capital-gains tax (a 1031 exchange can defer both). Figures are a year-1 estimate at your 24.0% rate — not tax advice; consult a CPA.
Schools (NCES district)
- District
- Cincinnati Public Schools
- NCES district ID
- 3904375
- Math proficiency
- 25% ▼ -19.00%
- Reading proficiency
- 36% ▼ -14.00%
- Median HH income
- $35,743
- Composite
- 25.21/100
- National rank
- #7508
- State rank
- #581 of 656 in OH
Livability — Cincinnati
- Score
- 80/100
- State rank
- #130
- US rank
- #1856
Category grades
Schools grade is shown separately in the Schools card above.
Census & demographics
- Census place
- Cincinnati, OH
- County
- Hamilton County · 701,295 people
- City population
- 505,555
- Metro
- Cincinnati, OH-KY-IN
- Population (ZIP)
- 14,182
- Household income
- $49,312
- Rent vs Own
- Severe rent burden
- 943.0
Population outlook (Hamilton County) Hauer SSP2
- Today (2025)
- 826,054 people
- By 2030
- 830,947 · +0.6%
- By 2040
- 832,319 · +0.8%
- By 2050
- 822,428 · -0.4%
- By 2075
- 788,688 · -4.5%
- By 2100
- 710,674 · -14.0%
Race, ethnicity, and origin ACS 2023
- Neighborhood character
- Diverse neighborhood (Simpson 0.61)
- Race & ethnicity
- White 53% Black 33% Two or more races 11% Hispanic / Latino 6% Asian 1%
- Hispanic origin (detail)
- Common ancestry
- Slovak 3% Romanian 2% Italian 1%
- Foreign-born
- 6% · Canada, Guatemala
- Languages at home
- 93% English-only · Spanish 4% German/W. Germanic 1%
Political lean MEDSL · Hamilton
- 2024 margin
- D (+14.9) · D 57.0% · R 42.1%
- 2008→2024 swing
- +7.9pp toward D · 2008: 7.0pp · 2024: 14.9pp
- All cycles
- 2024: D+14.9 2020: D+15.9 2016: D+9.5 2012: D+4.9 2008: D+7.0
Not yet ingested
- Civics
- —
Market trends
- HPI YoY
- ▼ -171.27%
- Current HPI
- 239.5488
- Rent YoY
- ▲ 16.66%
- Metro
- Cincinnati, OH-KY-IN
- State GDP YoY
- ▲ 1.98%
- F500 in state
- 48
Industry mix (Fortune 500 HQ in OH)
| Industry | F500 HQs | Revenue |
|---|---|---|
| Insurance | 3 | $145B |
|
||
| Industrial Machinery | 3 | $49B |
|
||
| Financial Services | 3 | $24B |
|
||
| Consumer Goods | 2 | $93B |
|
||
| Aerospace / Defense | 2 | $47B |
|
||
| Utilities | 2 | $33B |
|
||
Price history
+1064.7% since first listed25 events — show timeline
- 2026-04-09 Listed $99,000 Cincy MLS
- 2025-12-30 Listing Removed — Cincy MLS
- 2025-12-03 Price Changed $95,900 Cincy MLS
- 2025-10-30 Listed $99,900 Cincy MLS
- 2025-10-29 Listing Removed — Cincy MLS
- 2025-09-04 Listed $99,900 Cincy MLS
- 2025-08-01 Listing Removed — Cincy MLS
- 2025-07-24 Relisted — Cincy MLS
- 2025-07-05 Contingent — Cincy MLS
- 2025-06-17 Price Changed $110,000 Cincy MLS
- 2025-05-01 Listed $122,000 Cincy MLS
- 2025-04-28 Listing Removed — Cincy MLS
- 2025-03-13 Listed $129,000 Cincy MLS
- 2025-02-27 Listing Removed — Cincy MLS
- 2024-12-16 Listed $139,900 Cincy MLS
- 2024-11-18 Listing Removed — Cincy MLS
- 2024-09-20 Listed $139,000 Cincy MLS
- 2024-09-19 Listing Removed — Cincy MLS
- 2024-08-26 Price Changed $159,000 Cincy MLS
- 2024-07-11 Listed $179,000 Cincy MLS
- 2009-04-27 Sold (MLS) $6,000 Cincy MLS
- 2009-01-30 Listed $9,000 Cincy MLS
- 1996-01-11 Sold (Public Records) $33,000 Public Records
- 1995-07-26 Sold (Public Records) $18,000 Public Records
- 1990-07-16 Sold (Public Records) $8,500 Public Records
Property tax history
+18.3%/yrLatest (2025): $983 · +0.1% YoY. Source: county tax records.
Cash-flow waterfall
monthlySold comps — $/sqft
last 12 mo · ≤1 miLoading sold comps…