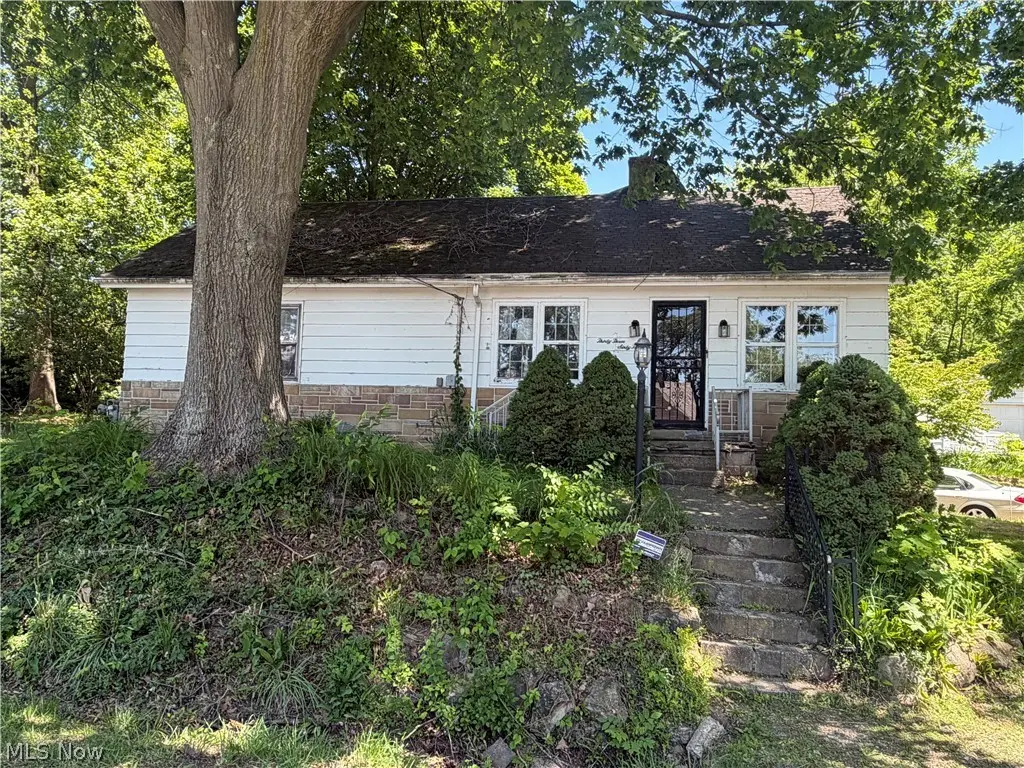
3365 Waterside Dr · Portage Lakes, OH
Flood risk 1/10 · Minimal
- FEMA flood zone
- X (unshaded)
- Chance of flooding over 30 yrs
- 0.0%
- Est. flood insurance / yr
- $473 – $860
Fire risk 1/10 · Minimal
- Est. fire insurance / yr
- $713 – $1,323
Heat risk 3/10 · Minor
- Hot days now (above 97°F)
- 7 days/yr
- Hot days in 30 yrs
- 17 days/yr
Wind risk 1/10 · Minimal
- Chance of severe wind over 30 yrs
- —
Air-quality risk 2/10 · Minimal
- Unhealthy air days now
- 1 days/yr
- Unhealthy air days in 30 yrs
- 2 days/yr
Risk factors via First Street. Map © Google.
Why this score? — see what drove the D+ grade
The composite is a weighted blend of 9 inputs, each scored 0–100. Each bar is that input's sub-score; the figure is the points it added to the 100-point composite (weight × sub-score).
- Cash flow +15.0/30.0
- ARV discount +7.5/15.0
- 1% rule +5.0/10.0
- DSCR +5.0/10.0
- Schools +5.0/10.0
- Livability +3.2/5.0
- Rent growth +2.5/5.0
- Condition / age +2.5/5.0
- Appreciation +0.0/10.0
$125,000
🖨 Deal sheet 📄 Offer letter ✓ Due diligence
Listing remarks
3 Bedroom Ranch located right in the heart of the Portage Lakes area. One car attached garage and private lot. Will need some updating.
Key facts
- 3,598 sq ft lot
- 2 garage spots
- Built 1938
Property features AI
Finance
- Financial info: Annual tax information available
Exterior
- Parking: Attached garage with 2 spaces; Driveway
- Utilities: Public sewer; Private well water
- Home design: Single-story home; Block and wood siding construction; Asphalt/fiberglass roof
- Construction: Block and wood siding construction; Asphalt and fiberglass roof; Year built reported by owner
- Exterior features: Gravel driveway; Built-in garage access
Interior
- Bedrooms: Three main-level bedrooms
- Bathrooms: One full bathroom on the main level
- Heating & cooling: Central air conditioning; Gas heating
- Interior features: Finished above-grade living area reported; Full basement (other type)
Neighborhood map
What this means for you Summary
Snapshot
- This is a 3-bed/1.0-bath single-family listed at $125k.
Deal economics
- At list price, monthly cash flow is $5k ($61k/yr) — positive.
- The deal already cash-flows at list — no discount required.
- Meets the 1% rule at list price ($8k rent vs $125k).
- Cap rate 55.3% vs local median 13.7% in Portage Lakes — top-decile yield for the area; either an underpriced asset or a hidden risk that comps aren't pricing in. Stress-test before assuming the spread holds.
Location & tenants
- Location reads 64/100 on livability (#772 in OH) — a middle-class / working-renter tenant base. Strengths: cost of living A+, housing A+, crime B+; Watch: employment D+, schools D-, amenities F.
- Coventry Local (suburban): math 52% / reading 64% proficiency, ranked #315 of 656 in OH (top 48%) — acceptable for families but not a draw, mixed tenant base, ~2y average lease.
- Market conditions: 90 active listings in the ZIP; 3 comparable units currently listed for rent nearby; rentals at typical pace (median 14d on market — plan ~3-4 weeks tenant-placement turnaround); 1,114 units permitted in Summit County in 2024 (397 in 5+ unit buildings).
- At $7,650/mo this rent would consume 123% of the median local household income ($75k/yr) — very limited rent-growth headroom before tenants either downsize or default.
Forward outlook
- Local home prices are declining (-3.0%/yr); year-one equity from $864 of loan paydown is wiped out by about $4k of value loss. Plan a longer hold.
- Summit County population projected to shrink 6% by 2050 — rents likely to lag national; underwrite the cash flow, not the appreciation.
- At projected returns (-3.0% appreciation + 3.0% rent growth), your $35k cash investment doubles in ~1 year — after that, you're playing with house money.
Negotiation context
- Only 1 days on market — expect competitive offers; lowballing is unlikely to land.
Risks & watch-outs
- Watch-outs: built in 1938 — expect roof / HVAC / electrical / plumbing capex.
Questions for the listing agent
- Built in 1938 — when were the roof, HVAC, electrical panel, plumbing, and water heater last replaced?
- Is there a deadline driving the sale (1031 exchange, divorce, estate, relocation)? That informs how much negotiation room exists.
- Schools are D-rated, which usually means shorter tenancies and higher turnover. Who's the typical renter profile here, and what's been the actual vacancy rate?
- The area grade is low — what's the realistic commute time and amenity access for the typical tenant pool here? Any planned neighborhood developments (good or bad) we should know about?
- What's the average days-on-market for RENTAL listings here right now (not sales)? A rising rental-DOM trend means longer vacancies and softer asking-rent achievability than the comps imply.
- What's the recent tenant-quality profile in this submarket — average credit score on applications, eviction rate, late-payment / NSF rate, and stable-employment percentage? A property-management company in the area should have these aggregated.
- How much new for-sale + rental construction is in the pipeline within 1–3 miles? Heavy new supply typically softens prices + rents 12–24 months out; constrained supply supports both.
Investment metrics
- 1% rule
- 6.12% ✓
- Cap rate
- 55.27%
- Cash-on-cash
- 174.93%
- DSCR
- 8.78
- GRM
- 1.4
CMA / ARV
- ARV (on-the-fly)
- $480,791
- Comps found
- 6
Show comp detail 6 sales within ~0.75 mi
| Address | Dist | Beds/Ba | Sqft | Sold | Price | $/sf | Match |
|---|---|---|---|---|---|---|---|
| 2976 S Main St | 0.52mi | 3/1.5 | 1,639 (-4%) | 8mo | $265,000 | $162 | 60 |
| 136 Wymore Ave | 0.22mi | 3/2.5 | 1,936 (+13%) | 17mo | $660,000 | $341 | 48 |
| 123 Wymore Ave | 0.21mi | 3/2.5 | 1,928 (+13%) | 19mo | $585,000 | $303 | 47 |
| 156 W Ingleside Dr | 0.54mi | 4/3.0 (+1) | 1,534 (-10%) | 2mo | $240,000 | $156 | 43 |
| 472 Saunders Ave | 0.72mi | 3/2.0 | 1,512 (-12%) | 10mo | $425,000 | $281 | 35 |
| 3691 S Turkeyfoot Rd | 0.74mi | 3/2.0 | 1,517 (-11%) | 12mo | $273,500 | $180 | 33 |
Match score weights: distance 35% · size 25% · config 20% · recency 20%. Top-matched comps best support the ARV.
Projected returns pro-forma
-3.0% appreciation · 3.0% rent growth · sell at horizon
- IRR
- —
- Equity multiple
- 9.71×
- Total profit
- $304,855
- Equity at exit
- $18,638
- IRR
- —
- Equity multiple
- 20.56×
- Total profit
- $684,547
- Equity at exit
- $10,808
Cash invested: $35,000 (down + closing). Projections, not guarantees.
Landlord ↔ Tenant lean methodology
- Overall (STATE)
- 73 Landlord-Friendly
- State Ohio
- 73 Landlord-Friendly · R+6
- County
- — inherits STATE
- City
- — inherits STATE
ZIP-level market 44319
- Active inventory
- 90
- Price-to-rent
- 1.4×
Monthly cashflow live
- Estimated rent
- $7,650 medium interval (Pro) →
- Mortgage (P&I)
- −$656
- Tax from tax record
- −$234 /mo · $2,805/yr
- Insurance
- −$52
- HOA
- −$0
- Vacancy / Maint / Mgmt
- −$1,606
- Net cashflow
- $5,102
Break-even live
UW: 25.0% down · 7.5% · 30yr · 1.5% tax · 5.0% vac · 8.0% maint · 8.0% mgmt
Financing live
Cash to close
- Down payment
- $31,250
- Closing costs
- $3,750
- Reserves months
- —
- Total cash needed
- —
Loan-product check · same deal, 3 products live
Conventional
25% down · 7.5% · 30yr
- Down + closing
- —
- Monthly P&I
- —
- Monthly cashflow
- —
- DSCR
- —
- Eligible?
- —
Personal DTI + credit; lowest rate.
DSCR
20% down · 8.5% · 30yr
- Down + closing
- —
- Monthly P&I
- —
- Monthly cashflow
- —
- DSCR
- —
- Eligible?
- —
No personal income docs; deal must DSCR.
Hard money
10% down · 12.0% · 12mo
- Down + closing
- —
- Monthly P&I
- —
- Monthly cashflow
- —
- DSCR
- —
- Eligible?
- —
Short-term bridge; refi at stabilization.
Rent comps 3 comps
| Address | Beds | Baths | Sqft | Rent | $/sqft | DOM | Units | Dist |
|---|---|---|---|---|---|---|---|---|
| 3581 Mong Ave Unit 1496037P Akron, OH | 4.0 | 2.0 | 2142 | $11,111 | $5.19 | 43d | 1 | 0.81mi |
| 234 Mallard Point Dr Akron, OH | 1.0–2.0 | 1.0–2.0 | 945 | $1,530 | $1.62 | 14d | 18 | 0.98mi |
| 829 Portage Lakes Dr Unit 1496076P Akron, OH | 3.0 | 1.0 | 1356 | $7,700 | $5.68 | 14d | 1 | 1.01mi |
Listing history 2 events
-
2026-06-07remarks 135-char remark
-
2026-06-07$125,000 Pending 1 DOM
ⓘ Source: listings_history table (triggers on properties + properties_extension) + one-shot
backfill from property_details.listing_events for pre-trigger history.
Tax reassessment forecast OH · Partial reset (capped growth)
- Current annual tax
- $2,805 · $234/mo
- Projected year-2 tax
- $2,805 · $234/mo
- Expected delta
- $0/yr ($0/mo · 0.0%)
ⓘ Screening estimate from a state-policy table — verify with the county assessor before closing.
Climate risk First Street
- Flood 1/10 Low FEMA zone X (unshaded) · 0% chance over 30 yrs
- Wildfire 1/10 Low
- Heat 3/10 Moderate 7 d/yr ≥97°F today · 17 d/yr by 30 yrs out
- Wind 1/10 Low
- Air quality 2/10 Low 1 unhealthy d/yr today · 2 by 30 yrs out
Nearby sold comps map
Loading sold comps map…
Walkable amenities ~0.75 mi
Loading nearby amenities…
Taxation est. · year 1
- Rental income
- $91,797
- − Mortgage interest
- −$7,002
- − Property taxes
- −$2,805
- − Insurance
- −$625
- − Repairs & maintenance
- −$7,344
- − Management
- −$7,344
- − Depreciation
- −$3,636
- Taxable income
- $63,041
- Est. tax owed @ 24.0%
- −$15,130
- After-tax cash flow
- $46,094/yr
For passive investors: Depreciation is non-cash, so a rental often shows a tax loss while cash-flowing — sheltering income. Rental losses are passive: they offset passive income freely, and up to $25,000/yr can offset ordinary (W-2) income if you actively participate and your MAGI is under $100k (phasing out to $0 by $150k); unused losses carry forward. On sale, claimed depreciation is recaptured at up to 25%, and gains may owe capital-gains tax (a 1031 exchange can defer both). Figures are a year-1 estimate at your 24.0% rate — not tax advice; consult a CPA.
Schools (NCES district)
- District
- Coventry Local
- NCES district ID
- 3904999
- Math proficiency
- 52% ▼ -13.00%
- Reading proficiency
- 64% ▼ -2.00%
- Median HH income
- $52,981
- Composite
- 49.66/100
- National rank
- #1976
- State rank
- #315 of 656 in OH
Livability — Portage Lakes
- Score
- 64/100
- State rank
- #772
- US rank
- #14032
Category grades
Schools grade is shown separately in the Schools card above.
Census & demographics
- Census place
- Portage Lakes, OH
- County
- Summit · 539,389 people
- Metro
- Akron, OH
- Population (ZIP)
- 21,469
- Household income
- $74,781
- Rent vs Own
- Severe rent burden
- 12.4
Population outlook (Summit County) Hauer SSP2
- Today (2025)
- 546,583 people
- By 2030
- 544,028 · -0.5%
- By 2040
- 531,363 · -2.8%
- By 2050
- 514,923 · -5.8%
- By 2075
- 481,765 · -11.9%
- By 2100
- 432,265 · -20.9%
Race, ethnicity, and origin ACS 2023
- Neighborhood character
- Predominantly White (91%)
- Race & ethnicity
- White 91% Two or more races 4% Black 2% Hispanic / Latino 2% Asian 2%
- Common ancestry
- Romanian 5% Slovak 2% Serbian 1%
- Foreign-born
- 2% · China, Vietnam
- Languages at home
- 97% English-only · Other Indo-European 1% Spanish 1% Chinese 1%
Political lean MEDSL · Summit
- 2024 margin
- Lean D (+7.0) · D 53.0% · R 46.0%
- 2008→2024 swing
- -9.6pp toward R · 2008: 16.6pp · 2024: 7.0pp
- All cycles
- 2024: D+7.0 2020: D+9.6 2016: D+8.2 2012: D+14.8 2008: D+16.6
Not yet ingested
- Civics
- —
Market trends
- HPI YoY
- ▼ -236.58%
- Current HPI
- 213.2267
- Rent YoY
- —
- Metro
- —
- State GDP YoY
- ▲ 1.98%
- F500 in state
- 48
Industry mix (Fortune 500 HQ in OH)
| Industry | F500 HQs | Revenue |
|---|---|---|
| Insurance | 3 | $145B |
|
||
| Industrial Machinery | 3 | $49B |
|
||
| Financial Services | 3 | $24B |
|
||
| Consumer Goods | 2 | $93B |
|
||
| Aerospace / Defense | 2 | $47B |
|
||
| Utilities | 2 | $33B |
|
||
Price history
2 events — show timeline
- 2026-06-04 Pending — MLSNOW
- 2026-06-03 Listed $125,000 MLSNOW
Property tax history
+3.7%/yrLatest (2025): $2,805 · +2.5% YoY. Source: county tax records.
Cash-flow waterfall
monthlySold comps — $/sqft
last 12 mo · ≤1 miLoading sold comps…