 🏢 Co-op
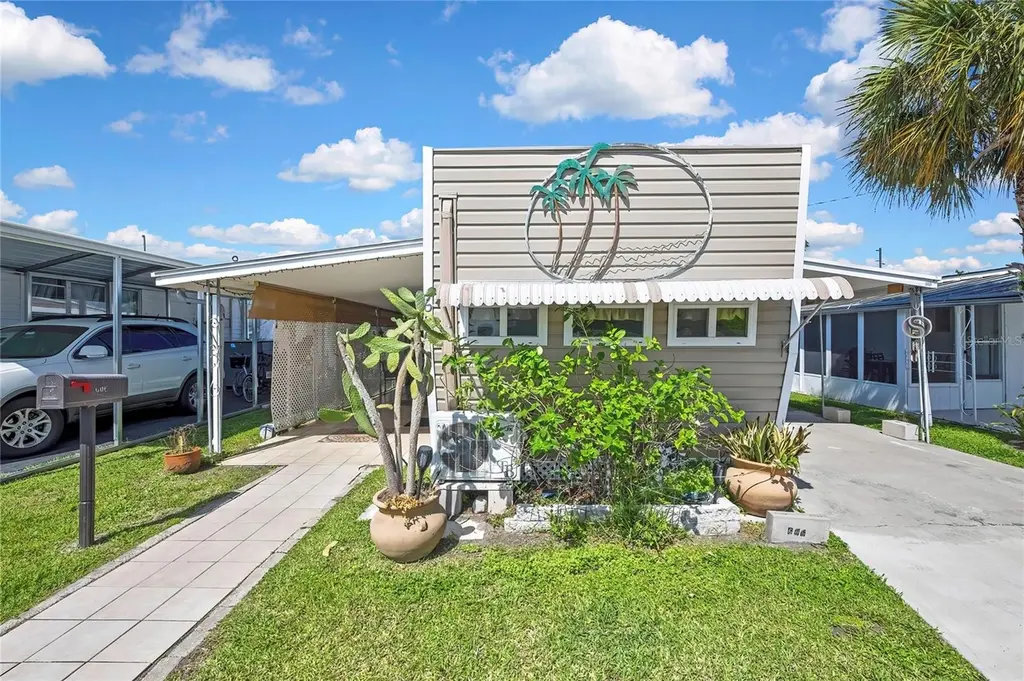
800 32nd Ave S #606 · St. Petersburg, FL
Flood risk 9/10 · Severe
- FEMA flood zone
- AE
- Chance of flooding over 30 yrs
- 0.99%
- Est. flood insurance / yr
- $1,737 – $8,500
Fire risk 3/10 · Minor
- Est. fire insurance / yr
- $947 – $1,759
Heat risk 10/10 · Severe
- Hot days now (above 106°F)
- 5 days/yr
- Hot days in 30 yrs
- 18 days/yr
Wind risk 10/10 · Severe
- Chance of severe wind over 30 yrs
- 99.0%
Air-quality risk 3/10 · Minor
- Unhealthy air days now
- 3 days/yr
- Unhealthy air days in 30 yrs
- 4 days/yr
Risk factors via First Street. Map © Google.
Why this score? — see what drove the B- grade
The composite is a weighted blend of 9 inputs, each scored 0–100. Each bar is that input's sub-score; the figure is the points it added to the 100-point composite (weight × sub-score).
- Cash flow +30.0/30.0
- 1% rule +10.0/10.0
- DSCR +10.0/10.0
- ARV discount +7.5/15.0
- Schools +4.3/10.0
- Rent growth +2.5/5.0
- Livability +2.5/5.0
- Condition / age +2.5/5.0
- Appreciation +0.0/10.0
$65,000
🖨 Deal sheet 📄 Offer letter ✓ Due diligence
Listing remarks
800 32nd Ave S #606 – Move-in ready 2BR/1BA in desirable 55+ Lakeshore Mobile Home Park! This 440 sq ft home features an open living/dining layout, bright interior, and efficient use of space. Built in 1960 and updated, the property offers central A/C, updated finishes, ceiling fans, and a flexible guest room/office. Public records state the home includes approximately 1,100 total sq ft, a covered carport, and sits within a 13-acre co-op community. Enjoy outdoor living with a patio and outdoor kitchen area—perfect for entertaining. Low-maintenance co-op ownership with no lot rent and affordable taxes. Furnishings negotiable. Community amenities include a pool and clubhouse, maki
Key facts
- Move-in ready
- Updated finishes
- Ceiling fans
Tags
Property features AI
Finance
- Other: Total acreage listed as 10 to less than 20 acres (lot dimensions 40 x 60); Building area reported (public records) and living area reported (public records)
- Financial info: Lease restrictions apply
- HOA & community: Has HOA; monthly fee $140 (includes pool); Association approval required; Association name: Kerry Loud; Community clubhouse and pool; Community mailbox; Golf carts allowed; Senior community; Pets allowed: cats and dogs
Exterior
- Parking: Has carport (1 space)
- Security: Community security gates
- Utilities: Public water; Public sewer; Electricity available; Cable available; High-speed internet available
- Home design: Mobile home (single wide); One story; Faces west; Entry level: One
- Construction: Vinyl siding and frame construction; Membrane and metal roof; Foundation information not specified; Built as manufactured/mobile home
- Exterior features: Hurricane shutters; Asphalt road access
Interior
- Kitchen: Cooktop; Microwave; Refrigerator
- Bedrooms: 2 bedrooms
- Flooring: Ceramic tile; Central heating; Central air
- Bathrooms: 1 full bathroom
- Heating & cooling: Central heating; Central air
- Interior features: Kitchen and family room combo; Thermostat
- Laundry & utility: Washer hookup; Common area laundry
Neighborhood map
What this means for you Summary
Snapshot
- This is a 2-bed/1.0-bath manufactured listed at $65k.
Deal economics
- At list price, monthly cash flow is $287 ($3k/yr) — positive.
- The deal already cash-flows at list — no discount required.
- Meets the 1% rule at list price ($2k rent vs $65k).
- Recommended offer: $63k (3.0% below list) — sets the bar for market timing.
- Cap rate 19.5% vs local median 2.6% in St. Petersburg — top-decile yield for the area; either an underpriced asset or a hidden risk that comps aren't pricing in. Stress-test before assuming the spread holds.
Location & tenants
- Location reads: area grade B — affects rentability + tenant quality, not the cash-flow math above.
- Pinellas (suburban): math 51% / reading 51% proficiency, ranked #31 of 73 in FL (top 42%) — acceptable for families but not a draw, mixed tenant base, ~2y average lease.
- Market conditions: Rents soft (-0.1%/yr); 308 active listings in the ZIP; 3 comparable units currently listed for rent nearby; rentals at typical pace (median 15d on market — plan ~3-4 weeks tenant-placement turnaround); 2,676 units permitted in Pinellas County in 2024 (1,422 in 5+ unit buildings).
Forward outlook
- Local home prices are declining (-3.0%/yr); year-one equity from $449 of loan paydown is wiped out by about $2k of value loss. Plan a longer hold.
- Pinellas County population projected at +14% by 2050 — modest demand growth; plan on rents tracking national, not racing it.
Negotiation context
- It's been on market 44 days — a 3% lower offer ($63k) is reasonable based on typical stale-listing flexibility.
- 3 sale attempts with the ask held roughly flat each time — persistent listings suggest the price (not the market) is what's stuck; bring a comps-based counter.
- Current owner paid $9k; list at $65k implies a 599% gain — meaningful room to come down on a strong offer.
Risks & watch-outs
- Watch-outs: flood insurance adds $427/mo.
- Climate carrying-cost: in FEMA flood zone AE (mandatory federal flood insurance); severe wind risk, 99% chance of damaging wind over 30y; extreme-heat days projected 5→18/yr by 2055 (HVAC capex compounding) — expect insurance premiums to compound above CPI over the hold.
Questions for the listing agent
- It's been on market 44 days. Have you received any prior offers? Is the seller open to a 3% concession, seller financing, or rate buy-down credit?
- Built in 1960 — when were the roof, HVAC, electrical panel, plumbing, and water heater last replaced?
- What's the actual annual flood-insurance premium (NFIP or private), and is the property in a SFHA with mandatory coverage?
- What does the HOA fee cover, when was the last increase, and are there any pending special assessments or reserve-fund shortfalls?
- Is there a deadline driving the sale (1031 exchange, divorce, estate, relocation)? That informs how much negotiation room exists.
- This sits on a lake — are riparian / water-frontage rights deeded with the parcel? Any dock permits, shoreline easements, or HOA water-use restrictions?
- What's the documented flood / surge / shoreline-erosion history here (FEMA AND non-FEMA — e.g., storm surge, creek backup, septic-field saturation)?
- Any water-quality or seasonal algae-bloom issues that affect tenant satisfaction or short-term-rental demand?
- What's the average days-on-market for RENTAL listings here right now (not sales)? A rising rental-DOM trend means longer vacancies and softer asking-rent achievability than the comps imply.
- What's the recent tenant-quality profile in this submarket — average credit score on applications, eviction rate, late-payment / NSF rate, and stable-employment percentage? A property-management company in the area should have these aggregated.
- How much new for-sale + rental construction is in the pipeline within 1–3 miles? Heavy new supply typically softens prices + rents 12–24 months out; constrained supply supports both.
Investment metrics
- 1% rule
- 2.57% ✓
- Cap rate
- 19.47%
- Cash-on-cash
- 47.07%
- DSCR
- 3.09
- GRM
- 3.2
CMA / ARV
No comps found within radius.
Projected returns pro-forma
-3.0% appreciation · 0.0% rent growth · sell at horizon
- IRR
- 4.9%
- Equity multiple
- 1.18×
- Total profit
- $3,258
- Equity at exit
- $9,692
- IRR
- 8.6%
- Equity multiple
- 1.50×
- Total profit
- $9,038
- Equity at exit
- $5,620
Cash invested: $18,200 (down + closing). Projections, not guarantees.
Landlord ↔ Tenant lean methodology
- Overall (STATE)
- 87 Strongly Landlord-Friendly
- State Florida
- 87 Strongly Landlord-Friendly · R+3
- County
- — inherits STATE
- City
- — inherits STATE
ZIP-level market 33705
- Rents YoY
- -0.1%
- Active inventory
- 308
- Price-to-rent
- 3.2×
Monthly cashflow live
- Estimated rent
- $1,671 medium interval (Pro) →
- Mortgage (P&I)
- −$341
- Tax from tax record
- −$98 /mo · $1,181/yr
- Insurance
- −$27
- Flood insurance flood zone
- −$427 /mo · $5,118/yr
- HOA
- −$140
- Vacancy / Maint / Mgmt
- −$351
- Net cashflow
- $287
Break-even live
UW: 25.0% down · 7.5% · 30yr · 1.5% tax · 5.0% vac · 8.0% maint · 8.0% mgmt
Financing live
Cash to close
- Down payment
- $16,250
- Closing costs
- $1,950
- Reserves months
- —
- Total cash needed
- —
Loan-product check · same deal, 3 products live
Conventional
25% down · 7.5% · 30yr
- Down + closing
- —
- Monthly P&I
- —
- Monthly cashflow
- —
- DSCR
- —
- Eligible?
- —
Personal DTI + credit; lowest rate.
DSCR
20% down · 8.5% · 30yr
- Down + closing
- —
- Monthly P&I
- —
- Monthly cashflow
- —
- DSCR
- —
- Eligible?
- —
No personal income docs; deal must DSCR.
Hard money
10% down · 12.0% · 12mo
- Down + closing
- —
- Monthly P&I
- —
- Monthly cashflow
- —
- DSCR
- —
- Eligible?
- —
Short-term bridge; refi at stabilization.
Rent comps 3 comps
| Address | Beds | Baths | Sqft | Rent | $/sqft | DOM | Units | Dist |
|---|---|---|---|---|---|---|---|---|
| 3901 6th St S Unit 4 St. Petersburg, FL | 1.0 | 1.0 | 316 | $1,450 | $4.59 | 18d | 1 | 0.45mi |
| 2410 4th St S Saint Petersburg, FL | 3.0 | 1.0 | 575 | $1,717 | $2.99 | 4d | 1 | 0.65mi |
| 674 22nd Ave S Saint Petersburg, FL | 1.0 | 1.0 | 405 | $1,250 | $3.09 | 15d | 1 | 0.66mi |
HOA detail
- Monthly dues
- $140 · $1,680/yr
- Likely covers
- pool
Listing history 19 events
-
2026-06-18days on market $65,000 Active 44 DOM
-
2026-06-17days on market $65,000 Active 43 DOM
-
2026-06-16days on market $65,000 Active 42 DOM
-
2026-06-15days on market $65,000 Active 41 DOM
-
2026-06-13days on market $65,000 Active 39 DOM
-
2026-06-09days on market $65,000 Active 35 DOM
-
2026-06-08days on market $65,000 Active 34 DOM
-
2026-06-07days on market $65,000 Active 33 DOM
-
2026-06-04days on market $65,000 Active 30 DOM
-
2026-06-03days on market $65,000 Active 29 DOM
-
2026-06-01days on market $65,000 Active 27 DOM
-
2026-05-31days on market $65,000 Active 26 DOM
-
2026-05-05$65,000 Active
-
2025-11-15historical
-
2025-10-01status Active
-
2025-06-08status Pending
-
2025-03-27$58,000 Active
-
2001-03-01soldstatus $9,300
-
1995-01-01soldstatus $11,500
ⓘ Source: listings_history table (triggers on properties + properties_extension) + one-shot
backfill from property_details.listing_events for pre-trigger history.
Tax reassessment forecast FL · Resets to sale price
- Current annual tax
- $1,181 · $98/mo
- Projected year-2 tax
- $1,181 · $98/mo
- Expected delta
- $0/yr ($0/mo · 0.0%)
ⓘ Screening estimate from a state-policy table — verify with the county assessor before closing.
Climate risk First Street
- Flood 9/10 Extreme FEMA zone AE · 99% chance over 30 yrs
- Wildfire 3/10 Moderate
- Heat 10/10 Extreme 5 d/yr ≥106°F today · 18 d/yr by 30 yrs out
- Wind 10/10 Extreme 99% chance of damaging wind over 30 yrs
- Air quality 3/10 Moderate 3 unhealthy d/yr today · 4 by 30 yrs out
Nearby sold comps map
Loading sold comps map…
Walkable amenities ~0.75 mi
Loading nearby amenities…
Taxation est. · year 1
- Rental income
- $20,055
- − Mortgage interest
- −$3,641
- − Property taxes
- −$1,181
- − Insurance
- −$5,444
- − Repairs & maintenance
- −$1,604
- − Management
- −$1,604
- − HOA
- −$1,680
- − Depreciation
- −$1,891
- Taxable income
- $3,010
- Est. tax owed @ 24.0%
- −$722
- After-tax cash flow
- $2,726/yr
For passive investors: Depreciation is non-cash, so a rental often shows a tax loss while cash-flowing — sheltering income. Rental losses are passive: they offset passive income freely, and up to $25,000/yr can offset ordinary (W-2) income if you actively participate and your MAGI is under $100k (phasing out to $0 by $150k); unused losses carry forward. On sale, claimed depreciation is recaptured at up to 25%, and gains may owe capital-gains tax (a 1031 exchange can defer both). Figures are a year-1 estimate at your 24.0% rate — not tax advice; consult a CPA.
Schools (NCES district)
- District
- Pinellas
- NCES district ID
- 1201560
- Math proficiency
- 51% ▼ -5.00%
- Reading proficiency
- 51% ▼ -3.00%
- Median HH income
- $46,270
- Composite
- 43.27/100
- National rank
- #3046
- State rank
- #31 of 73 in FL
Livability — St. Petersburg
No livability data for this city. (Only ~50 U.S. cities are tracked.)
Census & demographics
- Census place
- St. Petersburg, FL
- County
- Pinellas County · 939,478 people
- City population
- 249,151
- Metro
- Tampa-St. Petersburg-Clearwater, FL
- Population (ZIP)
- 27,939
- Household income
- $73,027
- Rent vs Own
- Severe rent burden
- 1386.0
Population outlook (Pinellas County) Hauer SSP2
- Today (2025)
- 1,027,532 people
- By 2030
- 1,063,586 · +3.5%
- By 2040
- 1,125,020 · +9.5%
- By 2050
- 1,168,637 · +13.7%
- By 2075
- 1,265,188 · +23.1%
- By 2100
- 1,260,357 · +22.7%
Race, ethnicity, and origin ACS 2023
- Neighborhood character
- Diverse neighborhood (Simpson 0.64)
- Race & ethnicity
- Black 44% White 41% Two or more races 10% Hispanic / Latino 5%
- Hispanic origin (detail)
- Puerto Rican 1%
- Common ancestry
- Lithuanian 2% Italian 1% Slovak 1%
- Foreign-born
- 9% · Canada, Dominican Republic
- Languages at home
- 92% English-only · Spanish 4% Other Indo-European 1% Russian/Polish/Slavic 1%
Political lean MEDSL · Pinellas
- 2024 margin
- Lean R (+5.2) · D 46.9% · R 52.1%
- 2008→2024 swing
- -13.5pp toward R · 2008: 8.3pp · 2024: -5.2pp
- All cycles
- 2024: R+5.2 2020: D+0.2 2016: R+1.1 2012: D+5.6 2008: D+8.3
Not yet ingested
- Civics
- —
Market trends
- HPI YoY
- ▼ -540.28%
- Current HPI
- 388.3086
- Rent YoY
- ▼ -0.13%
- Metro
- Tampa-St. Petersburg-Clearwater, FL
- State GDP YoY
- ▲ 3.28%
- F500 in state
- 36
Industry mix (Fortune 500 HQ in FL)
| Industry | F500 HQs | Revenue |
|---|---|---|
| Industrial Technology | 2 | $29B |
|
||
| Insurance | 2 | $17B |
|
||
| Retail | 1 | $60B |
|
||
| Technology Distribution | 1 | $58B |
|
||
| Homebuilding | 1 | $35B |
|
||
| Technology Manufacturing | 1 | $35B |
|
||
Price history
+465.2% since first listed7 events — show timeline
- 2026-05-05 Listed $65,000 Stellar MLS as Distributed by MLS Grid
- 2025-11-15 Listing Removed — Stellar MLS as Distributed by MLS Grid
- 2025-10-01 Relisted — Stellar MLS as Distributed by MLS Grid
- 2025-06-08 Pending — Stellar MLS as Distributed by MLS Grid
- 2025-03-27 Listed $58,000 Stellar MLS as Distributed by MLS Grid
- 2001-03-01 Sold (Public Records) $9,300 Public Records
- 1995-01-01 Sold (Public Records) $11,500 Public Records
Property tax history
+9.8%/yrLatest (2025): $1,181 · +12.2% YoY. Source: county tax records.
Cash-flow waterfall
monthlySold comps — $/sqft
last 12 mo · ≤1 miLoading sold comps…