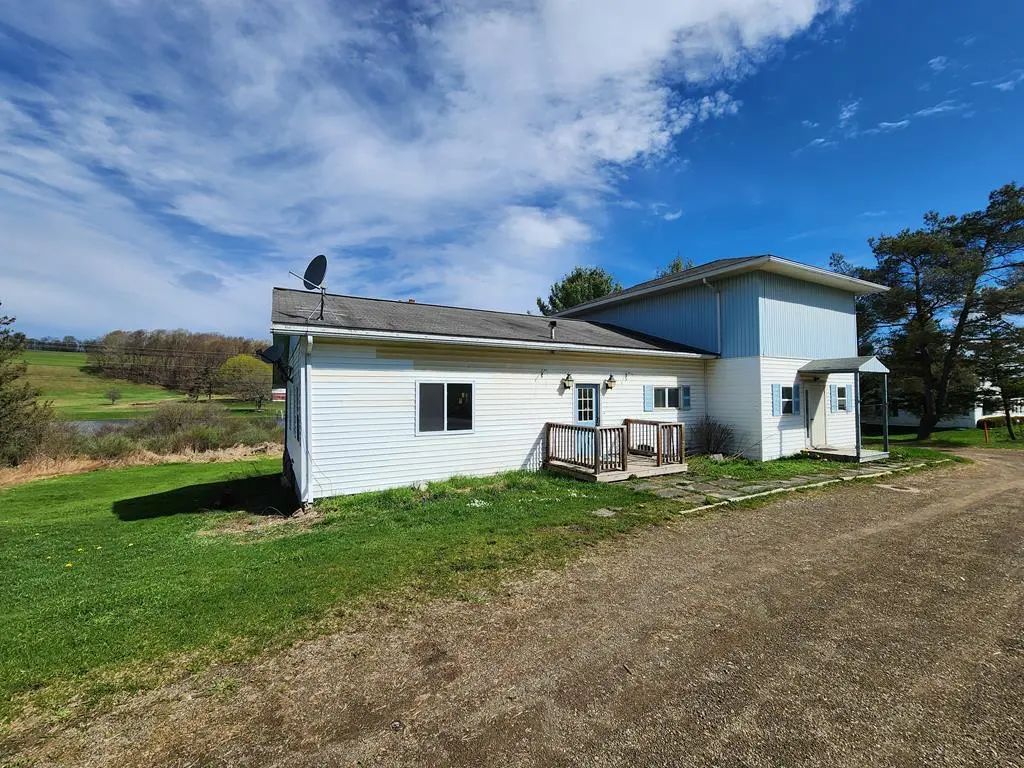
2110 SR 49 West · Ulysses, PA
Flood risk 6/10 · Moderate
- FEMA flood zone
- X (unshaded)
- Chance of flooding over 30 yrs
- 0.95%
- Est. flood insurance / yr
- $473 – $860
Fire risk 3/10 · Minor
- Est. fire insurance / yr
- $511 – $949
Heat risk 1/10 · Minimal
- Hot days now (above 88°F)
- 7 days/yr
- Hot days in 30 yrs
- 17 days/yr
Wind risk 1/10 · Minimal
- Chance of severe wind over 30 yrs
- —
Air-quality risk 2/10 · Minimal
- Unhealthy air days now
- 0 days/yr
- Unhealthy air days in 30 yrs
- 1 days/yr
Risk factors via First Street. Map © Google.
Why this score? — see what drove the C grade
The composite is a weighted blend of 9 inputs, each scored 0–100. Each bar is that input's sub-score; the figure is the points it added to the 100-point composite (weight × sub-score).
- Cash flow +19.9/30.0
- ARV discount +7.5/15.0
- Appreciation +6.6/10.0
- DSCR +6.3/10.0
- 1% rule +5.1/10.0
- Schools +3.1/10.0
- Livability +2.9/5.0
- Rent growth +2.5/5.0
- Condition / age +2.5/5.0
$130,000
🖨 Deal sheet (PDF) 📄 Offer letter ✓ Due diligence
Listing remarks
Discover the perfect combination of comfort and flexibility in this charming property! With 3 bedrooms and 2 baths on the main level this home offers endless possibilities for living or investment. A separate 1-bedroom, 1-bath apartment is ideal for guests, extended family, or rental income. A spacious layout designed for comfort day to day living is perfect for families or those seeking single level accommodations. The large yard is perfect for relaxing, gardening, or entertaining. This property offers a unique opportunity for multi-generational living or generating additional income, all while enjoying the comforts of home.
Key facts
- Large yard
- Additional income
- 1.5 acre lot
Tags
Property features AI
Exterior
- Utilities: Spring water source
- Home design: Residential single family home
- Construction: Vinyl siding
- Exterior features: Shingle roof; 1.5-acre lot
Interior
- Bathrooms: 3 full bathrooms
- Heating & cooling: Forced air heating; Natural gas heating
- Interior features: Gas water heater; 8 total rooms
Neighborhood map
What this means for you Summary
Snapshot
- This is a 4-bed/3.0-bath other listed at $130k.
Deal economics
- At list price, monthly cash flow is $158 ($2k/yr) — positive.
- The deal already cash-flows at list — no discount required.
- Meets the 1% rule at list price ($1k rent vs $130k).
- Recommended offer: $126k (3.0% below list) — sets the bar for market timing.
Location & tenants
- Location reads 57/100 on livability (#1,616 in PA) — a working-class tenant base; expect higher turnover. Strengths: cost of living A+; Watch: crime D+, health & safety D, schools D-.
- Northern Potter SD (rural): math 29% / reading 45% proficiency, ranked #404 of 539 in PA (top 75%) — families likely to look elsewhere, expect single-tenant / working-renter base with shorter leases.
- Market conditions: 11 active listings in the ZIP; 24 units permitted in Potter County in 2024 (0 in 5+ unit buildings).
Forward outlook
- In year one you build about $5k of equity ($899 loan paydown + $4k appreciation (3.3% local appreciation)).
- Potter County population projected at -27% by 2050 — secular population decline; favor cash flow + early exit over multi-decade hold.
- At projected returns (3.3% appreciation + 3.0% rent growth), your $36k cash investment doubles in ~5 years — after that, you're playing with house money.
- By year 7, paydown + projected appreciation supports a ~$32k cash-out refi (75% LTV) — recoverable capital for the next deal without selling this one.
Negotiation context
- It's been on market 55 days — a 3% lower offer ($126k) is reasonable based on typical stale-listing flexibility.
- 3 sale attempts since 2y ago with the ask held roughly flat each time — persistent listings suggest the price (not the market) is what's stuck; bring a comps-based counter.
- Current owner paid $60k; list at $130k implies a 117% gain — meaningful room to come down on a strong offer.
Risks & watch-outs
- Watch-outs: built in 1890 — expect roof / HVAC / electrical / plumbing capex.
- Climate carrying-cost: major flood risk — expect insurance premiums to compound above CPI over the hold.
Questions for the listing agent
- It's been on market 55 days. Have you received any prior offers? Is the seller open to a 3% concession, seller financing, or rate buy-down credit?
- Built in 1890 — when were the roof, HVAC, electrical panel, plumbing, and water heater last replaced?
- Is there a deadline driving the sale (1031 exchange, divorce, estate, relocation)? That informs how much negotiation room exists.
- Schools are D-rated, which usually means shorter tenancies and higher turnover. Who's the typical renter profile here, and what's been the actual vacancy rate?
- Crime grade is D in this area — have there been break-ins, vandalism, or insurance claims at this property in the last 3 years? What carrier currently insures it and at what premium?
- What's the average days-on-market for RENTAL listings here right now (not sales)? A rising rental-DOM trend means longer vacancies and softer asking-rent achievability than the comps imply.
- What's the recent tenant-quality profile in this submarket — average credit score on applications, eviction rate, late-payment / NSF rate, and stable-employment percentage? A property-management company in the area should have these aggregated.
- How much new for-sale + rental construction is in the pipeline within 1–3 miles? Heavy new supply typically softens prices + rents 12–24 months out; constrained supply supports both.
Investment metrics
- 1% rule
- 1.01% ✓
- Cap rate
- 7.75%
- Cash-on-cash
- 5.21%
- DSCR
- 1.23
- GRM
- 8.3
CMA / ARV
No comps found within radius.
Projected returns pro-forma
3.26% appreciation · 3.0% rent growth · sell at horizon
- IRR
- 13.0%
- Equity multiple
- 1.76×
- Total profit
- $27,506
- Equity at exit
- $60,347
- IRR
- 14.8%
- Equity multiple
- 3.24×
- Total profit
- $81,671
- Equity at exit
- $94,501
Cash invested: $36,400 (down + closing). Projections, not guarantees.
Landlord ↔ Tenant lean methodology
- Overall (STATE)
- 62 Landlord-Friendly
- State Pennsylvania
- 62 Landlord-Friendly · EVEN
- County
- — inherits STATE
- City
- — inherits STATE
ZIP-level market 16948
- Home prices YoY
- 2.5%
- Active inventory
- 11
- Price-to-rent
- 8.3×
Monthly cashflow live
- Estimated rent
- $1,313 medium interval (Pro) →
- Mortgage (P&I)
- −$682
- Tax from tax record
- −$143 /mo · $1,717/yr
- Insurance
- −$54
- HOA
- −$0
- Vacancy / Maint / Mgmt
- −$276
- Net cashflow
- $158
Break-even live
Sensitivity live
| Price | -10% $232 | -5% $195 | +0% $158 | +5% $121 | +10% $84 |
|---|---|---|---|---|---|
| Rent | -10% $54 | -5% $106 | +0% $158 | +5% $210 | +10% $262 |
| Rate | -1.0pp $223 | -0.5pp $191 | base $158 | +0.5pp $124 | +1.0pp $90 |
UW: 25.0% down · 7.5% · 30yr · 1.5% tax · 5.0% vac · 8.0% maint · 8.0% mgmt
Financing live
Cash to close
- Down payment
- $32,500
- Closing costs
- $3,900
- Reserves months
- —
- Total cash needed
- —
Loan-product check · same deal, 3 products live
Conventional
25% down · 7.5% · 30yr
- Down + closing
- —
- Monthly P&I
- —
- Monthly cashflow
- —
- DSCR
- —
- Eligible?
- —
Personal DTI + credit; lowest rate.
DSCR
20% down · 8.5% · 30yr
- Down + closing
- —
- Monthly P&I
- —
- Monthly cashflow
- —
- DSCR
- —
- Eligible?
- —
No personal income docs; deal must DSCR.
Hard money
10% down · 12.0% · 12mo
- Down + closing
- —
- Monthly P&I
- —
- Monthly cashflow
- —
- DSCR
- —
- Eligible?
- —
Short-term bridge; refi at stabilization.
Listing history 26 events
-
2026-06-21days on market $130,000 Active 55 DOM
-
2026-06-21days on market $130,000 Active 54 DOM
-
2026-06-18days on market $130,000 Active 52 DOM
-
2026-06-17days on market $130,000 Active 51 DOM
-
2026-06-16days on market $130,000 Active 50 DOM
-
2026-06-15days on market $130,000 Active 49 DOM
-
2026-06-13days on market $130,000 Active 47 DOM
-
2026-06-12days on market $130,000 Active 46 DOM
-
2026-06-09days on market $130,000 Active 43 DOM
-
2026-06-08days on market $130,000 Active 42 DOM
-
2026-06-08days on market $130,000 Active 41 DOM
-
2026-06-05days on market $130,000 Active 39 DOM
-
2026-06-04days on market $130,000 Active 37 DOM
-
2026-06-02days on market $130,000 Active 36 DOM
-
2026-06-01days on market $130,000 Active 35 DOM
-
2026-05-31days on market $130,000 Active 34 DOM
-
2026-04-27$130,000 Active 635-char remark
-
2025-06-03price $130,000
-
2025-01-16price $145,000
-
2024-12-01status Active
-
2024-10-21historical Active Under Contract
-
2024-09-12price $150,000
-
2024-07-23$165,000 Active
-
2021-12-09soldstatus $60,000
-
2015-10-26soldstatus $55,000
-
1998-03-01soldstatus $40,000
ⓘ Source: listings_history table (triggers on properties + properties_extension) + one-shot
backfill from property_details.listing_events for pre-trigger history.
Tax reassessment forecast PA · Partial reset (capped growth)
- Current annual tax
- $1,717 · $143/mo
- Projected year-2 tax
- $1,885 · $157/mo
- Expected delta
- +$169/yr (+$14/mo · 9.8%)
ⓘ Screening estimate from a state-policy table — verify with the county assessor before closing.
Climate risk First Street
- Flood 6/10 Major FEMA zone X (unshaded) · 95% chance over 30 yrs
- Wildfire 3/10 Moderate
- Heat 1/10 Low 7 d/yr ≥88°F today · 17 d/yr by 30 yrs out
- Wind 1/10 Low
- Air quality 2/10 Low 0 unhealthy d/yr today · 1 by 30 yrs out
Nearby sold comps map
Loading sold comps map…
Walkable amenities ~0.75 mi
Loading nearby amenities…
Taxation est. · year 1
- Rental income
- $15,750
- − Mortgage interest
- −$7,282
- − Property taxes
- −$1,717
- − Insurance
- −$650
- − Repairs & maintenance
- −$1,260
- − Management
- −$1,260
- − Depreciation
- −$3,782
- Taxable loss
- −$200
- Est. tax savings @ 24.0%
- +$48
- After-tax cash flow
- $1,943/yr
For passive investors: Depreciation is non-cash, so a rental often shows a tax loss while cash-flowing — sheltering income. Rental losses are passive: they offset passive income freely, and up to $25,000/yr can offset ordinary (W-2) income if you actively participate and your MAGI is under $100k (phasing out to $0 by $150k); unused losses carry forward. On sale, claimed depreciation is recaptured at up to 25%, and gains may owe capital-gains tax (a 1031 exchange can defer both). Figures are a year-1 estimate at your 24.0% rate — not tax advice; consult a CPA.
Schools (NCES district)
- District
- Northern Potter SD
- NCES district ID
- 4217700
- Math proficiency
- 29% ▼ -8.00%
- Reading proficiency
- 45% ▼ -12.00%
- Median HH income
- $38,863
- Composite
- 30.88/100
- National rank
- #6120
- State rank
- #404 of 539 in PA
Livability — Ulysses
- Score
- 57/100
- State rank
- #1616
- US rank
- #22081
Category grades
Schools grade is shown separately in the Schools card above.
Census & demographics
- Population (ZIP)
- 1,683
Population outlook (Potter County) Hauer SSP2
- Today (2025)
- 15,824 people
- By 2030
- 15,023 · -5.1%
- By 2040
- 13,290 · -16.0%
- By 2050
- 11,572 · -26.9%
- By 2075
- 8,144 · -48.5%
- By 2100
- 5,102 · -67.8%
Race, ethnicity, and origin ACS 2023
- Neighborhood character
- Predominantly White (96%)
- Race & ethnicity
- White 96% Two or more races 3%
- Common ancestry
- Polish 8% Romanian 2% Slovak 2%
- Foreign-born
- 0%
- Languages at home
- 86% English-only · German/W. Germanic 14%
Political lean MEDSL · Potter
- 2024 margin
- Solid R (+62.3) · D 18.4% · R 80.7%
- 2008→2024 swing
- -24.9pp toward R · 2008: -37.4pp · 2024: -62.3pp
- All cycles
- 2024: R+62.3 2020: R+60.8 2016: R+63.6 2012: R+45.9 2008: R+37.4
Not yet ingested
- Civics
- —
Market trends
- HPI YoY
- ▲ 3.26%
- Current HPI
- 135.243
- Rent YoY
- —
- Metro
- —
- State GDP YoY
- ▲ 1.68%
- F500 in state
- 34
Industry mix (Fortune 500 HQ in PA)
| Industry | F500 HQs | Revenue |
|---|---|---|
| Healthcare | 2 | $309B |
|
||
| Insurance | 2 | $27B |
|
||
| Telecommunications / Media | 1 | $124B |
|
||
| Industrial Distribution | 1 | $22B |
|
||
| Financial Services | 1 | $20B |
|
||
| Chemicals / Materials | 1 | $18B |
|
||
Price history
+225.0% since first listed10 events — show timeline
- 2026-04-27 Listed $130,000 NMPA
- 2025-06-03 Price Changed $130,000 NMPA
- 2025-01-16 Price Changed $145,000 NMPA
- 2024-12-01 Relisted — NMPA
- 2024-10-21 Contingent — NMPA
- 2024-09-12 Price Changed $150,000 NMPA
- 2024-07-23 Listed $165,000 NMPA
- 2021-12-09 Sold (Public Records) $60,000 Public Records
- 2015-10-26 Sold (Public Records) $55,000 Public Records
- 1998-03-01 Sold (Public Records) $40,000 Public Records
Property tax history
+3.3%/yrLatest (2026): $1,717 · +5.3% YoY. Source: county tax records.
Cash-flow waterfall
monthlySold comps — $/sqft
last 12 mo · ≤1 miLoading sold comps…