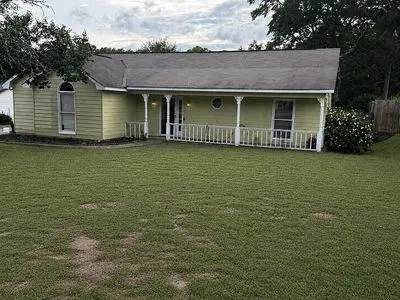
62 Lee Road 819 · Ladonia, AL
Flood risk 1/10 · Minimal
- FEMA flood zone
- X (unshaded)
- Chance of flooding over 30 yrs
- 0.0%
- Est. flood insurance / yr
- $507 – $1,088
Fire risk 5/10 · Moderate
- Est. fire insurance / yr
- $916 – $1,700
Heat risk 7/10 · Major
- Hot days now (above 108°F)
- 7 days/yr
- Hot days in 30 yrs
- 19 days/yr
Wind risk 8/10 · Major
- Chance of severe wind over 30 yrs
- 80.0%
Air-quality risk 4/10 · Minor
- Unhealthy air days now
- 4 days/yr
- Unhealthy air days in 30 yrs
- 4 days/yr
Risk factors via First Street. Map © Google.
Why this score? — see what drove the D+ grade
The composite is a weighted blend of 9 inputs, each scored 0–100. Each bar is that input's sub-score; the figure is the points it added to the 100-point composite (weight × sub-score).
- Cash flow +20.2/30.0
- ARV discount +8.1/15.0
- DSCR +6.4/10.0
- 1% rule +4.2/10.0
- Livability +3.1/5.0
- Schools +3.0/10.0
- Rent growth +2.5/5.0
- Condition / age +2.5/5.0
- Appreciation +0.0/10.0
$225,000
🖨 Deal sheet 📄 Offer letter ✓ Due diligence
Listing remarks MLS
Absolutely adorable 3 bedroom 2 bath home with new flooring throughout, freshly painted, new kitchen sink and faucet. This home features a spacious eat-in kitchen with bay window. The privacy fenced back yard is very spacious. The living room has vaulted ceilings and a wood burning fireplace. Master bedroom has a walk in closet and ensuite bathroom. Attached 1 car carport with storage room.
Key facts
- Updated kitchen
- Newer hvac system
- Built 2003
Tags
Neighborhood map
What this means for you Summary
Snapshot
- This is a 3-bed/2.0-bath single-family listed at $225k.
Deal economics
- At list price, monthly cash flow is $285 ($3k/yr) — positive.
- The deal already cash-flows at list — no discount required.
- To meet the 1% rule (rent ≥ 1% of price), the offer needs to be $206k (8.4% below list).
- Recommended offer: $206k (8.4% below list) — sets the bar for 1% rule.
- Cap rate 7.8% vs local median 4.4% in Ladonia — top-decile yield for the area; either an underpriced asset or a hidden risk that comps aren't pricing in. Stress-test before assuming the spread holds.
Location & tenants
- Location reads 61/100 on livability (#251 in AL) — a middle-class / working-renter tenant base. Strengths: cost of living A+, housing A+, crime A-; Watch: employment D, schools F, amenities F.
- Lee County (rural): math 23% / reading 47% proficiency, ranked #40 of 129 in AL (top 31%) — families likely to look elsewhere, expect single-tenant / working-renter base with shorter leases.
- Market conditions: 132 active listings in the ZIP; 2 comparable units currently listed for rent nearby; 1,858 units permitted in Lee County in 2024 (113 in 5+ unit buildings).
- This rent runs 34% of the median local income ($72k/yr) — at the standard rent-burdened threshold; future hikes will face affordability resistance.
Forward outlook
- Local home prices are declining (-3.0%/yr); year-one equity from $2k of loan paydown is wiped out by about $7k of value loss. Plan a longer hold.
- Lee County population projected at +54% by 2050 — long-run rental-demand tailwind backs the buy-and-hold thesis.
Negotiation context
- Only 5 days on market — expect competitive offers; lowballing is unlikely to land.
- 3 sale attempts since 5y ago with the ask held roughly flat each time — persistent listings suggest the price (not the market) is what's stuck; bring a comps-based counter.
- Current owner paid $142k; list at $225k implies a 58% gain — meaningful room to come down on a strong offer.
Risks & watch-outs
- Climate carrying-cost: severe wind risk, 80% chance of damaging wind over 30y; moderate wildfire risk; extreme-heat days projected 7→19/yr by 2055 (HVAC capex compounding) — expect insurance premiums to compound above CPI over the hold.
Questions for the listing agent
- Is there a deadline driving the sale (1031 exchange, divorce, estate, relocation)? That informs how much negotiation room exists.
- Schools are F-rated, which usually means shorter tenancies and higher turnover. Who's the typical renter profile here, and what's been the actual vacancy rate?
- The area grade is low — what's the realistic commute time and amenity access for the typical tenant pool here? Any planned neighborhood developments (good or bad) we should know about?
- What's the average days-on-market for RENTAL listings here right now (not sales)? A rising rental-DOM trend means longer vacancies and softer asking-rent achievability than the comps imply.
- What's the recent tenant-quality profile in this submarket — average credit score on applications, eviction rate, late-payment / NSF rate, and stable-employment percentage? A property-management company in the area should have these aggregated.
- How much new for-sale + rental construction is in the pipeline within 1–3 miles? Heavy new supply typically softens prices + rents 12–24 months out; constrained supply supports both.
Investment metrics
- 1% rule
- 0.92% ✗
- Cap rate
- 7.81%
- Cash-on-cash
- 5.43%
- DSCR
- 1.24
- GRM
- 9.1
CMA / ARV
- ARV (on-the-fly)
- $227,955
- Comps found
- 12
Show comp detail 12 sales within ~0.75 mi
| Address | Dist | Beds/Ba | Sqft | Sold | Price | $/sf | Match |
|---|---|---|---|---|---|---|---|
| 45 Lee Road 996 Rd | 0.23mi | 3/2.0 | 1,434 (+5%) | 2mo | $269,900 | $188 | 80 |
| 45 Lee Road 0996 | 0.23mi | 3/2.0 | 1,434 (+5%) | 2mo | $269,900 | $188 | 80 |
| 97 Lee Road 916 | 0.40mi | 3/2.0 | 1,372 (+0%) | 6mo | $232,500 | $169 | 75 |
| 745 Lee Road 2095 | 0.56mi | 3/2.0 | 1,332 (-2%) | 7mo | $222,000 | $167 | 64 |
| 2245 Lee Road 0208 | 0.40mi | 4/2.0 (+1) | 1,444 (+6%) | 7mo | $189,900 | $132 | 61 |
| 200 Lee Road 520 | 0.50mi | 3/2.0 | 1,440 (+6%) | 8mo | $219,900 | $153 | 61 |
| 849 Lee Road 238 | 0.43mi | 3/2.0 | 1,476 (+8%) | 9mo | $228,500 | $155 | 59 |
| 95 Lee Road 517 | 0.43mi | 3/2.0 | 1,537 (+13%) | 1mo | $255,000 | $166 | 58 |
| 476 Lee Road 520 | 0.50mi | 3/2.0 | 1,201 (-12%) | 0mo | $220,000 | $183 | 56 |
| 57 Lee Road 919 | 0.72mi | 3/2.0 | 1,296 (-5%) | 6mo | $200,000 | $154 | 52 |
| 121 Lee Road 0850 | 0.48mi | 3/2.0 | 1,537 (+13%) | 6mo | $250,000 | $163 | 51 |
| 57 Lee Road 0996 | 0.72mi | 3/2.0 | 1,488 (+9%) | 6mo | $250,000 | $168 | 46 |
Match score weights: distance 35% · size 25% · config 20% · recency 20%. Top-matched comps best support the ARV.
Projected returns pro-forma
-3.0% appreciation · 3.0% rent growth · sell at horizon
- IRR
- -7.9%
- Equity multiple
- 0.71×
- Total profit
- $-18,404
- Equity at exit
- $33,548
- IRR
- 1.6%
- Equity multiple
- 1.11×
- Total profit
- $6,948
- Equity at exit
- $19,454
Cash invested: $63,000 (down + closing). Projections, not guarantees.
Landlord ↔ Tenant lean methodology
- Overall (STATE)
- 90 Strongly Landlord-Friendly
- State Alabama
- 90 Strongly Landlord-Friendly · R+15
- County
- — inherits STATE
- City
- — inherits STATE
ZIP-level market 36870
- Home prices YoY
- -10.5%
- Active inventory
- 132
- Price-to-rent
- 9.1×
Monthly cashflow live
- Estimated rent
- $2,060 medium interval (Pro) →
- Mortgage (P&I)
- −$1,180
- Tax from tax record
- −$69 /mo · $828/yr
- Insurance
- −$94
- HOA
- −$0
- Vacancy / Maint / Mgmt
- −$433
- Net cashflow
- $285
Break-even live
UW: 25.0% down · 7.5% · 30yr · 1.5% tax · 5.0% vac · 8.0% maint · 8.0% mgmt
Financing live
Cash to close
- Down payment
- $56,250
- Closing costs
- $6,750
- Reserves months
- —
- Total cash needed
- —
Loan-product check · same deal, 3 products live
Conventional
25% down · 7.5% · 30yr
- Down + closing
- —
- Monthly P&I
- —
- Monthly cashflow
- —
- DSCR
- —
- Eligible?
- —
Personal DTI + credit; lowest rate.
DSCR
20% down · 8.5% · 30yr
- Down + closing
- —
- Monthly P&I
- —
- Monthly cashflow
- —
- DSCR
- —
- Eligible?
- —
No personal income docs; deal must DSCR.
Hard money
10% down · 12.0% · 12mo
- Down + closing
- —
- Monthly P&I
- —
- Monthly cashflow
- —
- DSCR
- —
- Eligible?
- —
Short-term bridge; refi at stabilization.
Rent comps 2 comps
| Address | Beds | Baths | Sqft | Rent | $/sqft | DOM | Units | Dist |
|---|---|---|---|---|---|---|---|---|
| 393 Lee Rd Unit 554 Phenix City, AL | 4.0 | 2.0 | 1745 | $2,000 | $1.15 | 20d | 1 | 0.59mi |
| 567 Mill Pond Dr Phenix City, AL | 3.0 | 2.0 | 1240 | $1,400 | $1.13 | 13d | 1 | 1.49mi |
Listing history 6 events
-
2026-06-18days on market $225,000 Active 5 DOM
-
2026-06-17days on market $225,000 Active 4 DOM
-
2026-06-16days on market $225,000 Active 3 DOM
-
2026-06-15days on market $225,000 Active 2 DOM
-
2026-06-14remarks 699-char remark
-
2026-06-14$225,000 Active 1 DOM
ⓘ Source: listings_history table (triggers on properties + properties_extension) + one-shot
backfill from property_details.listing_events for pre-trigger history.
Tax reassessment forecast AL · Resets to sale price
- Current annual tax
- $828 · $69/mo
- Projected year-2 tax
- $923 · $77/mo
- Expected delta
- +$95/yr (+$8/mo · 11.5%)
ⓘ Screening estimate from a state-policy table — verify with the county assessor before closing.
Climate risk First Street
- Flood 1/10 Low FEMA zone X (unshaded) · 0% chance over 30 yrs
- Wildfire 5/10 Major
- Heat 7/10 Severe 7 d/yr ≥108°F today · 19 d/yr by 30 yrs out
- Wind 8/10 Severe 80% chance of damaging wind over 30 yrs
- Air quality 4/10 Moderate 4 unhealthy d/yr today · 4 by 30 yrs out
Nearby sold comps map
Loading sold comps map…
Walkable amenities ~0.75 mi
Loading nearby amenities…
Taxation est. · year 1
- Rental income
- $24,725
- − Mortgage interest
- −$12,603
- − Property taxes
- −$828
- − Insurance
- −$1,125
- − Repairs & maintenance
- −$1,978
- − Management
- −$1,978
- − Depreciation
- −$6,545
- Taxable loss
- −$333
- Est. tax savings @ 24.0%
- +$80
- After-tax cash flow
- $3,501/yr
For passive investors: Depreciation is non-cash, so a rental often shows a tax loss while cash-flowing — sheltering income. Rental losses are passive: they offset passive income freely, and up to $25,000/yr can offset ordinary (W-2) income if you actively participate and your MAGI is under $100k (phasing out to $0 by $150k); unused losses carry forward. On sale, claimed depreciation is recaptured at up to 25%, and gains may owe capital-gains tax (a 1031 exchange can defer both). Figures are a year-1 estimate at your 24.0% rate — not tax advice; consult a CPA.
Schools (NCES district)
- District
- Lee County
- NCES district ID
- 0102070
- Math proficiency
- 23% ▼ -27.00%
- Reading proficiency
- 47% ▬ 0.00%
- Median HH income
- $47,786
- Composite
- 30.04/100
- National rank
- #6355
- State rank
- #40 of 129 in AL
Livability — Ladonia
- Score
- 61/100
- State rank
- #251
- US rank
- #17877
Category grades
Schools grade is shown separately in the Schools card above.
Census & demographics
- County
- Lee County · 144,175 people
- Metro
- Auburn-Opelika, AL
- Population (ZIP)
- 17,951
- Household income
- $72,500
- Rent vs Own
- Severe rent burden
- 500.0
Population outlook (Lee County) Hauer SSP2
- Today (2025)
- 196,440 people
- By 2030
- 217,417 · +10.7%
- By 2040
- 259,467 · +32.1%
- By 2050
- 301,557 · +53.5%
- By 2075
- 402,186 · +104.7%
- By 2100
- 474,503 · +141.6%
Race, ethnicity, and origin ACS 2023
- Neighborhood character
- Predominantly White (72%)
- Race & ethnicity
- White 72% Black 18% Two or more races 4% Hispanic / Latino 4%
- Common ancestry
- Slovak 3% Romanian 2% Portuguese 2%
- Foreign-born
- 3% · Canada, South Korea, Jamaica
- Languages at home
- 95% English-only · Spanish 3% Korean 1%
Political lean MEDSL · Lee
- 2024 margin
- Strong R (+27.8) · D 35.5% · R 63.3% · Other 1.2%
- 2008→2024 swing
- -8.1pp toward R · 2008: -19.8pp · 2024: -27.8pp
- All cycles
- 2024: R+27.8 2020: R+20.1 2016: R+23.1 2012: R+19.9 2008: R+19.8
Not yet ingested
- Civics
- —
Market trends
- HPI YoY
- ▼ -28.19%
- Current HPI
- 241.1403
- Rent YoY
- —
- Metro
- Auburn-Opelika, AL
- State GDP YoY
- ▲ 2.94%
- F500 in state
- 4
Industry mix (Fortune 500 HQ in AL)
| Industry | F500 HQs | Revenue |
|---|---|---|
| Financial Services | 1 | $8B |
|
||
| Healthcare | 1 | $5B |
|
||
Price history
+129.6% since first listed8 events — show timeline
- 2026-06-13 Listed $225,000 FSBO.com
- 2021-10-19 Sold (Public Records) $142,000 Public Records
- 2021-10-19 Sold (MLS) $142,000 EABOR
- 2021-10-19 Sold (MLS) $142,000 EABOR
- 2021-08-03 Listed $136,900 EABOR
- 2021-08-03 Listed $136,900 EABOR
- 2011-10-20 Sold (Public Records) $98,000 Public Records
- 2011-09-30 Sold (Public Records) $98,000 Public Records
Property tax history
+1.8%/yrLatest (2025): $828 · +7.0% YoY. Source: county tax records.
Cash-flow waterfall
monthlySold comps — $/sqft
last 12 mo · ≤1 miLoading sold comps…