 Fourplex
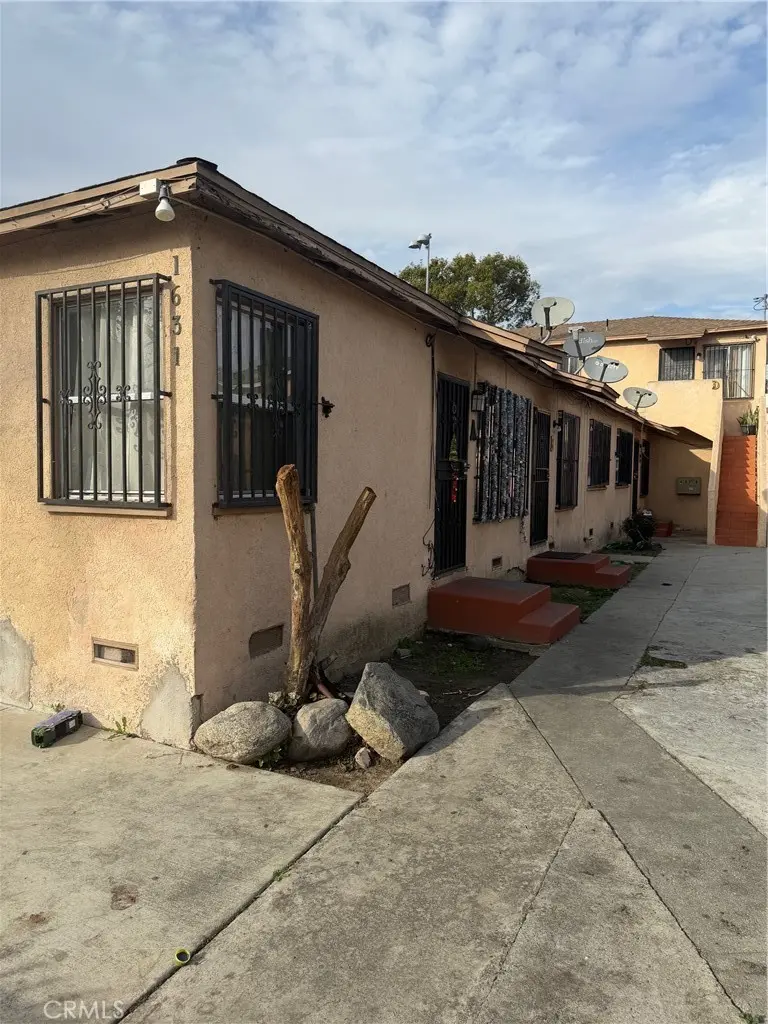
1631 E Saunders · Compton, CA
Flood risk 1/10 · Minimal
- FEMA flood zone
- X (shaded)
- Chance of flooding over 30 yrs
- 0.0%
- Est. flood insurance / yr
- $507 – $1,088
Fire risk 1/10 · Minimal
- Est. fire insurance / yr
- $659 – $1,223
Heat risk 5/10 · Moderate
- Hot days now (above 91°F)
- 7 days/yr
- Hot days in 30 yrs
- 21 days/yr
Wind risk 1/10 · Minimal
- Chance of severe wind over 30 yrs
- —
Air-quality risk 6/10 · Moderate
- Unhealthy air days now
- 10 days/yr
- Unhealthy air days in 30 yrs
- 10 days/yr
Risk factors via First Street. Map © Google.
Why this score? — see what drove the D- grade
The composite is a weighted blend of 9 inputs, each scored 0–100. Each bar is that input's sub-score; the figure is the points it added to the 100-point composite (weight × sub-score).
- Cash flow +16.3/30.0
- DSCR +5.1/10.0
- 1% rule +4.4/10.0
- Schools +3.2/10.0
- ARV discount +3.0/15.0
- Livability +2.8/5.0
- Rent growth +2.5/5.0
- Condition / age +1.0/5.0
- Appreciation +0.0/10.0
$849,000
🖨 Deal sheet 📄 Offer letter ✓ Due diligence
Multi-family units
County records classify this as Multi-Family (5+ Unit). Listing-text estimate: 4 units. estimate disagrees with records
5+ unit building — per-unit beds/baths from public records are typically unavailable; the breakdown below (if shown) is an estimate from the listing text.
Listing remarks MLS
PRICED TO SELL TODAY! 4 PLEX IN A PRIME RENTAL MARKET ON A STREET WITH A GREAT PARK NEXT DOOR! UNIT MIX CONSISTING OF 1-3 BED/2BATH, 1- 2 BED/1BATH AND 2- 1 BED/1 BATH. SEPARATELY METERED FOR GAS AND ELECTRIC. GREAT INVESTMENT PROPERTY OR PERFECT OPPORTUNITY FOR OWNER-USER TO LIVE IN ONE UNIT AND RENT OUT THE OTHER 3 TO HELP PAY MORTGAGE! ENDLESS POSSIBILITIES AT A GREAT PRICE!! HURRY THIS OPPORTUNITY WON'T LAST LONG!
Key facts
- Investment property
- 5,172 sq ft lot
- 4 garage spots
Tags
Neighborhood map
What this means for you Summary
Snapshot
- This is a 2×1bd/1ba + 1×2bd/1ba + 1×3bd/2ba units multifamily listed at $849k. Condition is rated poor.
Deal economics
- At list price, monthly cash flow is $468 ($6k/yr) — positive. Per door: $117/mo.
- The deal already cash-flows at list — no discount required.
- To meet the 1% rule (rent ≥ 1% of price), the offer needs to be $802k (5.5% below list).
- Recommended offer: $747k (12.0% below list) — sets the bar for market timing.
- Cap rate 7.0% vs local median 3.0% in Compton — top-decile yield for the area; either an underpriced asset or a hidden risk that comps aren't pricing in. Stress-test before assuming the spread holds.
Location & tenants
- Location reads 56/100 on livability (#803 in CA) — a working-class tenant base; expect higher turnover. Strengths: commute A+, housing B; Watch: schools D, crime F, amenities D-.
- Compton Unified (suburban): math 31% / reading 38% proficiency, ranked #910 of 1,400 in CA (top 65%) — families likely to look elsewhere, expect single-tenant / working-renter base with shorter leases; 78% free/reduced lunch — lower-income household profile, screen leases tightly.
- Market conditions: 40 active listings in the ZIP; 19,697 units permitted in Los Angeles County in 2024 (9,426 in 5+ unit buildings).
Forward outlook
- Local home prices are declining (-3.0%/yr); year-one equity from $6k of loan paydown is wiped out by about $25k of value loss. Plan a longer hold.
- Los Angeles County population projected at +9% by 2050 — modest demand growth; plan on rents tracking national, not racing it.
Negotiation context
- It's been on market 157 days — a 12% lower offer ($747k) is reasonable based on typical stale-listing flexibility.
- 17 sale attempts since 26y ago; this cycle's ask has dropped $50k (6%) from the opening price — seller is motivated, your offer sets the floor, not the list.
- Current owner paid $575k; 48% above their basis — modest negotiation headroom, anchor on the comps not their cost.
Risks & watch-outs
- Watch-outs: built in 1953 — expect roof / HVAC / electrical / plumbing capex.
- Climate carrying-cost: extreme-heat days projected 7→21/yr by 2055 (HVAC capex compounding) — expect insurance premiums to compound above CPI over the hold.
Questions for the listing agent
- It's been on market 157 days. Have you received any prior offers? Is the seller open to a 12% concession, seller financing, or rate buy-down credit?
- Can we see the unit-by-unit rent roll, current vacancy, and any below-market leases? What's the average tenancy length?
- What capital expenditures (roof, boiler, parking lot, exteriors) have been made in the last 5 years, and what's planned in the next 2?
- Have any recent inspections been done? Can we get a copy of the seller's disclosures and any deferred-maintenance estimates?
- Built in 1953 — when were the roof, HVAC, electrical panel, plumbing, and water heater last replaced?
- Why hasn't it sold? Are there any deal-killer items the seller is aware of (foundation, flood, title, zoning, code violations)?
- Is there a deadline driving the sale (1031 exchange, divorce, estate, relocation)? That informs how much negotiation room exists.
- Schools are D-rated, which usually means shorter tenancies and higher turnover. Who's the typical renter profile here, and what's been the actual vacancy rate?
- Crime grade is F in this area — have there been break-ins, vandalism, or insurance claims at this property in the last 3 years? What carrier currently insures it and at what premium?
- The area grade is low — what's the realistic commute time and amenity access for the typical tenant pool here? Any planned neighborhood developments (good or bad) we should know about?
- What's the average days-on-market for RENTAL listings here right now (not sales)? A rising rental-DOM trend means longer vacancies and softer asking-rent achievability than the comps imply.
- What's the recent tenant-quality profile in this submarket — average credit score on applications, eviction rate, late-payment / NSF rate, and stable-employment percentage? A property-management company in the area should have these aggregated.
- How much new apartment / multifamily construction is in the pipeline within 1–3 miles? Heavy new supply (>2% of stock underway) typically softens rents 12–24 months out; light construction supports rent growth.
Investment metrics
- 1% rule
- 0.94% ✗
- Cap rate
- 6.95%
- Cash-on-cash
- 2.36%
- DSCR
- 1.11
- GRM
- 8.8
CMA / ARV
- ARV (median comp)
- $772,362
- List price
- $849,000
- Delta
- 9.92%
- Verdict
- FAIR
- Comps
- 20 within 1.0 mi
Projected returns pro-forma
-3.0% appreciation · 3.0% rent growth · sell at horizon
- IRR
- -12.5%
- Equity multiple
- 0.55×
- Total profit
- $-107,661
- Equity at exit
- $126,589
- IRR
- -3.5%
- Equity multiple
- 0.77×
- Total profit
- $-54,896
- Equity at exit
- $73,406
Cash invested: $237,720 (down + closing). Projections, not guarantees.
Landlord ↔ Tenant lean methodology
- Overall (STATE)
- 18 Strongly Tenant-Friendly
- State California
- 18 Strongly Tenant-Friendly · D+13
- County
- — inherits STATE
- City
- — inherits STATE
ZIP-level market 90221
- Active inventory
- 40
- Price-to-rent
- 37.7×
Monthly cashflow live
- Estimated rent
- $8,019 high interval (Pro) →
- Mortgage (P&I)
- −$4,452
- Tax est. 1.5%
- −$1,061 /mo · $12,735/yr
- Insurance
- −$354
- HOA
- −$0
- Vacancy / Maint / Mgmt
- −$1,684
- Net cashflow
- $468
Break-even live
4-unit breakdown (identical units grouped — click to expand)
| Units | Beds | Baths | Est. rent |
|---|---|---|---|
| 2× units | 1 | 1 | $3,756 |
| #1 | 1 | 1 | $1,878 |
| #2 | 1 | 1 | $1,878 |
| 1× unit | 2 | 1 | $1,951 |
| 1× unit | 3 | 2 | $2,312 |
| Total (4 units) | $8,019 | ||
UW: 25.0% down · 7.5% · 30yr · 1.5% tax · 5.0% vac · 8.0% maint · 8.0% mgmt
Financing live
Cash to close
- Down payment
- $212,250
- Closing costs
- $25,470
- Reserves months
- —
- Total cash needed
- —
Loan-product check · same deal, 3 products live
Conventional
25% down · 7.5% · 30yr
- Down + closing
- —
- Monthly P&I
- —
- Monthly cashflow
- —
- DSCR
- —
- Eligible?
- —
Personal DTI + credit; lowest rate.
DSCR
20% down · 8.5% · 30yr
- Down + closing
- —
- Monthly P&I
- —
- Monthly cashflow
- —
- DSCR
- —
- Eligible?
- —
No personal income docs; deal must DSCR.
Hard money
10% down · 12.0% · 12mo
- Down + closing
- —
- Monthly P&I
- —
- Monthly cashflow
- —
- DSCR
- —
- Eligible?
- —
Short-term bridge; refi at stabilization.
Listing history 50 events
-
2026-06-18days on market $849,000 Active 157 DOM
-
2026-06-17days on market $849,000 Active 156 DOM
-
2026-06-16days on market $849,000 Active 155 DOM
-
2026-06-15days on market $849,000 Active 154 DOM
-
2026-06-13days on market $849,000 Active 151 DOM
-
2026-06-09days on market $849,000 Active 148 DOM
-
2026-06-08days on market $849,000 Active 147 DOM
-
2026-06-07days on market $849,000 Active 146 DOM
-
2026-06-04days on market $849,000 Active 143 DOM
-
2026-06-03days on market $849,000 Active 142 DOM
-
2026-06-02days on market $849,000 Active 141 DOM
-
2026-06-01days on market $849,000 Active 140 DOM
-
2026-05-31days on market $849,000 Active 139 DOM
-
2026-03-18price $849,000 421-char remark
Show marketing remark (421 chars)
PRICED TO SELL TODAY! 4 PLEX IN A PRIME RENTAL MARKET ON A STREET WITH A GREAT PARK NEXT DOOR! UNIT MIX CONSISTING OF 1-3 BED/2BATH, 1- 2 BED/1BATH AND 2- 1 BED/1 BATH. SEPARATELY METERED FOR GAS AND ELECTRIC. GREAT INVESTMENT PROPERTY OR PERFECT OPPORTUNITY FOR OWNER-USER TO LIVE IN ONE UNIT AND RENT OUT THE OTHER 3 TO HELP PAY MORTGAGE! ENDLESS POSSIBILITIES AT A GREAT PRICE!! HURRY THIS OPPORTUNITY WON'T LAST LONG!
-
2026-01-12$899,000 Active 421-char remark
Show marketing remark (421 chars)
PRICED TO SELL TODAY! 4 PLEX IN A PRIME RENTAL MARKET ON A STREET WITH A GREAT PARK NEXT DOOR! UNIT MIX CONSISTING OF 1-3 BED/2BATH, 1- 2 BED/1BATH AND 2- 1 BED/1 BATH. SEPARATELY METERED FOR GAS AND ELECTRIC. GREAT INVESTMENT PROPERTY OR PERFECT OPPORTUNITY FOR OWNER-USER TO LIVE IN ONE UNIT AND RENT OUT THE OTHER 3 TO HELP PAY MORTGAGE! ENDLESS POSSIBILITIES AT A GREAT PRICE!! HURRY THIS OPPORTUNITY WON'T LAST LONG!
-
2016-10-25soldstatus $575,000 Closed Sale 299-char remark
Show marketing remark (299 chars)
Perfect for your Investors with a high income return. Next to recreational park with public swimming facility. (4- units) First unit consists of 3 bedrooms / 2 bath, second Unit: 2 bedrooms / 1 bath. Third and fourth units are both: 1 bath/ 1 bedroom each. Easy access to the 105 and 710 Freeways.
-
2016-10-21status Pending Sale 299-char remark
Show marketing remark (299 chars)
Perfect for your Investors with a high income return. Next to recreational park with public swimming facility. (4- units) First unit consists of 3 bedrooms / 2 bath, second Unit: 2 bedrooms / 1 bath. Third and fourth units are both: 1 bath/ 1 bedroom each. Easy access to the 105 and 710 Freeways.
-
2016-09-19historical Active Under Contract 299-char remark
Show marketing remark (299 chars)
Perfect for your Investors with a high income return. Next to recreational park with public swimming facility. (4- units) First unit consists of 3 bedrooms / 2 bath, second Unit: 2 bedrooms / 1 bath. Third and fourth units are both: 1 bath/ 1 bedroom each. Easy access to the 105 and 710 Freeways.
-
2016-06-28price $575,000 299-char remark
Show marketing remark (299 chars)
Perfect for your Investors with a high income return. Next to recreational park with public swimming facility. (4- units) First unit consists of 3 bedrooms / 2 bath, second Unit: 2 bedrooms / 1 bath. Third and fourth units are both: 1 bath/ 1 bedroom each. Easy access to the 105 and 710 Freeways.
-
2016-01-01$650,000 Active 299-char remark
Show marketing remark (299 chars)
Perfect for your Investors with a high income return. Next to recreational park with public swimming facility. (4- units) First unit consists of 3 bedrooms / 2 bath, second Unit: 2 bedrooms / 1 bath. Third and fourth units are both: 1 bath/ 1 bedroom each. Easy access to the 105 and 710 Freeways.
-
2015-09-13historical
-
2015-09-13soldstatus $450,000 Closed Sale
-
2015-09-12status Pending Sale
-
2015-09-12historical Hold Do Not Show
-
2015-09-11status Active
-
2015-09-04status Active
-
2015-09-04historical Hold Do Not Show
-
2015-08-25historical Hold Do Not Show
-
2015-08-23status Active
-
2015-07-02status Active
-
2015-07-02historical Hold Do Not Show
-
2015-06-08historical Hold Do Not Show
-
2015-06-07status Active
-
2015-05-22historical Hold Do Not Show
-
2015-05-14$450,000 Active
-
2008-02-12historical
-
2007-09-11$750,000
-
2006-06-09soldstatus $6,200,000
-
2006-06-08soldstatus $619,000
-
2006-05-31soldstatus $619,000
-
2006-03-10$619,000
-
2006-03-09historical
-
2006-03-05$619,000
-
2006-03-05$6,190,000
-
2006-03-05$619,000
-
2004-02-05historical
-
2004-02-05historical
-
2003-08-06$380,000
-
2003-08-05$380,000
-
2002-05-20soldstatus $249,900
ⓘ Source: listings_history table (triggers on properties + properties_extension) + one-shot
backfill from property_details.listing_events for pre-trigger history.
Climate risk First Street
- Flood 1/10 Low FEMA zone X (shaded) · 0% chance over 30 yrs
- Wildfire 1/10 Low
- Heat 5/10 Major 7 d/yr ≥91°F today · 21 d/yr by 30 yrs out
- Wind 1/10 Low
- Air quality 6/10 Major 10 unhealthy d/yr today · 10 by 30 yrs out
Nearby sold comps map
Loading sold comps map…
Walkable amenities ~0.75 mi
Loading nearby amenities…
Taxation est. · year 1
- Rental income
- $96,228
- − Mortgage interest
- −$47,557
- − Property taxes
- −$12,735
- − Insurance
- −$4,245
- − Repairs & maintenance
- −$7,698
- − Management
- −$7,698
- − Depreciation
- −$24,698
- Taxable loss
- −$8,404
- Est. tax savings @ 24.0%
- +$2,017
- After-tax cash flow
- $7,630/yr
For passive investors: Depreciation is non-cash, so a rental often shows a tax loss while cash-flowing — sheltering income. Rental losses are passive: they offset passive income freely, and up to $25,000/yr can offset ordinary (W-2) income if you actively participate and your MAGI is under $100k (phasing out to $0 by $150k); unused losses carry forward. On sale, claimed depreciation is recaptured at up to 25%, and gains may owe capital-gains tax (a 1031 exchange can defer both). Figures are a year-1 estimate at your 24.0% rate — not tax advice; consult a CPA.
Condition & rehab AI · 5 photos
This multi-family property requires extensive repairs and updates to its exterior, interior, and systems, significantly impacting its current condition and value. Significant investment is needed to bring it up to a livable and marketable standard.
Repairs flagged
- Major exterior paint — Peeling paint
- Major exterior siding — Visible wear
- Major interior walls — No visible interior walls
- Major bathrooms — No visible bathrooms
- Major kitchen — No visible kitchen
- Major roof — No visible damage
Value-add opportunities
- Both exterior paint — Enhances curb appeal and resale value
- Both exterior siding repair — Improves structural integrity and resale value
- Both interior walls and paint — Enhances interior aesthetics and resale value
- Both install bathrooms and kitchen — Improves functionality and rental value
Renovation cost estimate screening
| Repair item | Severity | Est. cost |
|---|---|---|
| exterior paint · Peeling paint | Major | $15,000–50,000 |
| exterior siding · Visible wear | Major | $15,000–50,000 |
| interior walls · No visible interior walls | Major | $15,000–50,000 |
| bathrooms · No visible bathrooms | Major | $15,000–50,000 |
| kitchen · No visible kitchen | Major | $15,000–50,000 |
| roof · No visible damage | Major | $15,000–50,000 |
| Total estimated repair cost · 6 items | $90,000–300,000 |
Value-add ROI direction
- Both exterior paint — Enhances curb appeal and resale value ↑
- Both exterior siding repair — Improves structural integrity and resale value ↑
- Both interior walls and paint — Enhances interior aesthetics and resale value ↑
- Both install bathrooms and kitchen — Improves functionality and rental value ↑
ⓘ Cost ranges are severity-bucket heuristics (US national rule-of-thumb). Get contractor quotes + a written scope before underwriting a rehab budget.
Schools (NCES district)
- District
- Compton Unified
- NCES district ID
- 0609620
- Math proficiency
- 31% ▲ 5.00%
- Reading proficiency
- 38% ▲ 3.00%
- Median HH income
- $45,045
- Composite
- 32.1/100
- National rank
- #10985
- State rank
- #910 of 1400 in CA
Livability — Compton
- Score
- 56/100
- State rank
- #803
- US rank
- #22778
Category grades
Schools grade is shown separately in the Schools card above.
Census & demographics
- Census place
- Compton, CA
- City population
- 48,354
- Population (ZIP)
- 50,782
Population outlook (Los Angeles County) Hauer SSP2
- Today (2025)
- 10,940,515 people
- By 2030
- 11,256,481 · +2.9%
- By 2040
- 11,729,929 · +7.2%
- By 2050
- 11,948,407 · +9.2%
- By 2075
- 11,818,114 · +8.0%
- By 2100
- 10,842,928 · -0.9%
Race, ethnicity, and origin ACS 2023
- Neighborhood character
- Predominantly Hispanic (79%)
- Race & ethnicity
- Hispanic / Latino 79% Two or more races 33% Black 18% Native American 2% Asian 1%
- Hispanic origin (detail)
- Mexican 70%
- Foreign-born
- 37% · Canada
- Languages at home
- 30% English-only · Spanish 68% Tagalog/Filipino 1%
Political lean MEDSL · Los Angeles
- 2024 margin
- Solid D (+32.9) · D 64.8% · R 31.9% · Other 3.3%
- 2008→2024 swing
- -7.4pp toward R · 2008: 40.4pp · 2024: 32.9pp
- All cycles
- 2024: D+32.9 2020: D+44.2 2016: D+48.0 2012: D+40.0 2008: D+40.4
Not yet ingested
- Civics
- —
Market trends
- HPI YoY
- ▼ -482.21%
- Current HPI
- 490.5921
- Rent YoY
- —
- Metro
- —
- State GDP YoY
- ▲ 3.21%
- F500 in state
- 116
Industry mix (Fortune 500 HQ in CA)
| Industry | F500 HQs | Revenue |
|---|---|---|
| Technology | 27 | $1,492B |
|
||
| Financial Services | 3 | $174B |
|
||
| Retail | 3 | $44B |
|
||
| Insurance | 3 | $26B |
|
||
| Media / Entertainment | 2 | $115B |
|
||
| Pharmaceuticals / Biotech | 2 | $62B |
|
||
Price history
+283.5% since first listed40 events — show timeline
- 2026-03-18 Price Changed $849,000 CRMLS
- 2026-01-12 Listed $899,000 CRMLS
- 2016-10-25 Sold (MLS) $575,000 CRMLS
- 2016-10-21 Pending — CRMLS
- 2016-09-19 Contingent — CRMLS
- 2016-06-28 Price Changed $575,000 CRMLS
- 2016-01-01 Listed $650,000 CRMLS
- 2015-09-13 Listing Removed — CRMLS
- 2015-09-13 Sold (MLS) $450,000 CRMLS
- 2015-09-12 Pending — CRMLS
- 2015-09-12 Delisted — CRMLS
- 2015-09-11 Relisted — CRMLS
- 2015-09-04 Relisted — CRMLS
- 2015-09-04 Delisted — CRMLS
- 2015-08-25 Delisted — CRMLS
- 2015-08-23 Relisted — CRMLS
- 2015-07-02 Relisted — CRMLS
- 2015-07-02 Delisted — CRMLS
- 2015-06-08 Delisted — CRMLS
- 2015-06-07 Relisted — CRMLS
- 2015-05-22 Delisted — CRMLS
- 2015-05-14 Listed $450,000 CRMLS
- 2008-02-12 Listing Removed — CRMLS
- 2007-09-11 Listed $750,000 CRMLS
- 2006-06-09 Sold (MLS) $6,200,000 CRMLS
- 2006-06-08 Sold (MLS) $619,000 CRMLS
- 2006-05-31 Sold (MLS) $619,000 CRMLS
- 2006-03-10 Listed $619,000 CRMLS
- 2006-03-09 Listing Removed — CRMLS
- 2006-03-05 Listed $619,000 CRMLS
- 2006-03-05 Listed $6,190,000 CRMLS
- 2006-03-05 Listed $619,000 CRMLS
- 2004-02-05 Listing Removed — CRMLS
- 2004-02-05 Listing Removed — CRMLS
- 2003-08-06 Listed $380,000 CRMLS
- 2003-08-05 Listed $380,000 CRMLS
- 2002-05-20 Sold (MLS) $249,900 CRMLS
- 2002-01-17 Listed $249,900 CRMLS
- 2001-09-04 Sold (MLS) $160,000 CRMLS
- 2000-11-22 Listed $221,400 CRMLS
Cash-flow waterfall
monthlySold comps — $/sqft
last 12 mo · ≤1 miLoading sold comps…