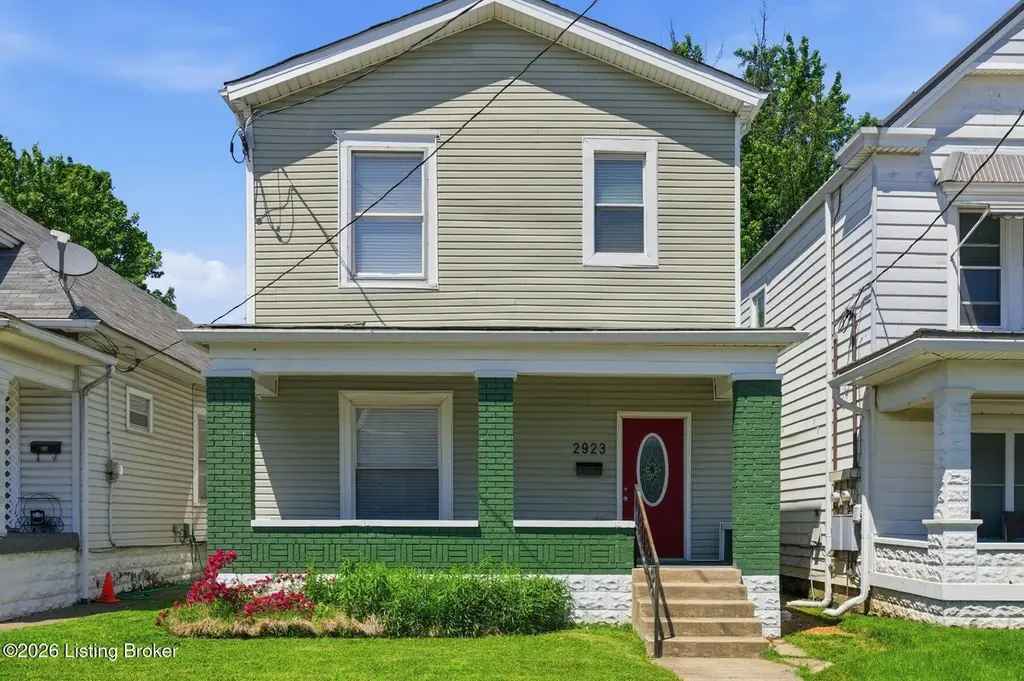
2923 W Market St · Louisville, KY
Flood risk 1/10 · Minimal
- FEMA flood zone
- X (unshaded)
- Chance of flooding over 30 yrs
- 0.0%
- Est. flood insurance / yr
- $507 – $1,088
Fire risk 1/10 · Minimal
- Est. fire insurance / yr
- $839 – $1,559
Heat risk 5/10 · Moderate
- Hot days now (above 105°F)
- 7 days/yr
- Hot days in 30 yrs
- 20 days/yr
Wind risk 2/10 · Minimal
- Chance of severe wind over 30 yrs
- 1.0%
Air-quality risk 2/10 · Minimal
- Unhealthy air days now
- 1 days/yr
- Unhealthy air days in 30 yrs
- 2 days/yr
Risk factors via First Street. Map © Google.
Why this score? — see what drove the D+ grade
The composite is a weighted blend of 9 inputs, each scored 0–100. Each bar is that input's sub-score; the figure is the points it added to the 100-point composite (weight × sub-score).
- Cash flow +16.5/30.0
- Appreciation +10.0/10.0
- DSCR +5.1/10.0
- 1% rule +3.5/10.0
- Livability +3.2/5.0
- Rent growth +2.6/5.0
- Condition / age +2.5/5.0
- Schools +2.3/10.0
- ARV discount +1.7/15.0
$200,000
🖨 Deal sheet 📄 Offer letter ✓ Due diligence
Listing remarks
Welcome home to 2923 W Market St—this spacious, renovated 5-bedroom, 2 full bath home offers modern updates throughout. Fresh paint with new flooring and light fixtures create a bright, inviting feel. The updated kitchen features ample cabinetry and counter space. Laundry room can double as pantry storage. Seller will add appliances with an acceptable offer. Large bedrooms on both floors and both full baths have been updated. Outside, vinyl siding and fresh paint make for easy maintenance. Enjoy a fenced yard, a 2-car garage, and an additional storage shed. Conveniently located near the Norton Sports and Learning Center Campus. Move-in ready with room to grow—don't miss this one
Key facts
- Renovated
- Fenced yard
- Updated kitchen
Tags
Property features AI
Finance
- Other: Building area reported by appraiser; above-grade living area 2,136
- HOA & community: No association fee
Exterior
- Parking: Detached garage with rear entry (2 garage spaces)
- Utilities: Electricity connected; Natural gas available
- Home design: Single-family residence with a traditional style; Two stories; Built in 1900
- Construction: Vinyl siding; Shingle roof; Crawl space foundation
- Exterior features: Lot is cleared, level and includes sidewalks; Fencing includes privacy, partial and chain-link sections; Lot dimensions approximately 30 x 179
Interior
- Kitchen: Kitchen on the first floor; Dining area on the first floor
- Bedrooms: 5 bedrooms total; Two bedrooms on the first floor; Three bedrooms on the second floor
- Bathrooms: Two full bathrooms; Full bathrooms located on the second floor
- Heating & cooling: Forced-air heating (natural gas); Central air conditioning
- Interior features: 7 main rooms and 11 total rooms; Cellar basement
- Laundry & utility: Laundry room on the first floor
Neighborhood map
What this means for you Summary
Snapshot
- This is a 5-bed/2.0-bath single-family listed at $200k.
Deal economics
- At list price, monthly cash flow is $118 ($1k/yr) — positive.
- The deal already cash-flows at list — no discount required.
- To meet the 1% rule (rent ≥ 1% of price), the offer needs to be $171k (14.5% below list).
- Recommended offer: $171k (14.5% below list) — sets the bar for 1% rule.
- Cap rate 7.0% vs local median 5.0% in Louisville — top-decile yield for the area; either an underpriced asset or a hidden risk that comps aren't pricing in. Stress-test before assuming the spread holds.
Location & tenants
- Location reads 63/100 on livability (#333 in KY) — a middle-class / working-renter tenant base. Strengths: cost of living A+, housing A+; Watch: employment C-, health & safety D+, schools D-.
- Jefferson County (urban): math 19% / reading 35% proficiency, ranked #121 of 165 in KY (top 73%) — low school quality limits family demand, transient renter base, plan for 1-2y turnover.
- Market conditions: Rents flat; 140 active listings in the ZIP; 6 comparable units currently listed for rent nearby; rentals at typical pace (median 16d on market — plan ~3-4 weeks tenant-placement turnaround); lower-income renter base — watch delinquency; 2,836 units permitted in Jefferson County in 2024 (1,558 in 5+ unit buildings).
Forward outlook
- In year one you build about $21k of equity ($1k loan paydown + $20k appreciation (10.0% local appreciation)).
- Jefferson County population projected at +13% by 2050 — modest demand growth; plan on rents tracking national, not racing it.
- At projected returns (10.0% appreciation + 0.5% rent growth), your $56k cash investment doubles in ~3 years — after that, you're playing with house money.
- By year 2, paydown + projected appreciation supports a ~$34k cash-out refi (75% LTV) — recoverable capital for the next deal without selling this one.
Negotiation context
- It's been on market 20 days — a 2% lower offer ($197k) is reasonable based on typical stale-listing flexibility.
- 6 sale attempts since 17y ago with the ask held roughly flat each time — persistent listings suggest the price (not the market) is what's stuck; bring a comps-based counter.
- Current owner paid $75k; list at $200k implies a 167% gain — meaningful room to come down on a strong offer.
Risks & watch-outs
- Watch-outs: built in 1900 — expect roof / HVAC / electrical / plumbing capex.
- Climate carrying-cost: extreme-heat days projected 7→20/yr by 2055 (HVAC capex compounding) — expect insurance premiums to compound above CPI over the hold.
Questions for the listing agent
- Built in 1900 — when were the roof, HVAC, electrical panel, plumbing, and water heater last replaced?
- Is there a deadline driving the sale (1031 exchange, divorce, estate, relocation)? That informs how much negotiation room exists.
- Schools are D-rated, which usually means shorter tenancies and higher turnover. Who's the typical renter profile here, and what's been the actual vacancy rate?
- Crime grade is F in this area — have there been break-ins, vandalism, or insurance claims at this property in the last 3 years? What carrier currently insures it and at what premium?
- The area grade is low — what's the realistic commute time and amenity access for the typical tenant pool here? Any planned neighborhood developments (good or bad) we should know about?
- What's the average days-on-market for RENTAL listings here right now (not sales)? A rising rental-DOM trend means longer vacancies and softer asking-rent achievability than the comps imply.
- What's the recent tenant-quality profile in this submarket — average credit score on applications, eviction rate, late-payment / NSF rate, and stable-employment percentage? A property-management company in the area should have these aggregated.
- How much new for-sale + rental construction is in the pipeline within 1–3 miles? Heavy new supply typically softens prices + rents 12–24 months out; constrained supply supports both.
Investment metrics
- 1% rule
- 0.85% ✗
- Cap rate
- 7.00%
- Cash-on-cash
- 2.54%
- DSCR
- 1.11
- GRM
- 9.8
CMA / ARV
- ARV (on-the-fly)
- $177,288
- Comps found
- 9
Show comp detail 9 sales within ~0.75 mi
| Address | Dist | Beds/Ba | Sqft | Sold | Price | $/sf | Match |
|---|---|---|---|---|---|---|---|
| 2535 Duncan St | 0.49mi | 5/2.0 | 2,100 (-2%) | 10mo | $170,000 | $81 | 66 |
| 3128 W Muhammad Ali Blvd | 0.36mi | 4/2.0 (-1) | 2,333 (+9%) | 9mo | $124,000 | $53 | 56 |
| 123 S 39th St | 0.71mi | 4/2.5 (-1) | 2,159 (+1%) | 6mo | $215,000 | $100 | 53 |
| 2513 W Chestnut St | 0.63mi | 4/2.0 (-1) | 2,108 (-1%) | 14mo | $144,000 | $68 | 52 |
| 3233 W Jefferson St | 0.30mi | 4/2.0 (-1) | 1,922 (-10%) | 15mo | $159,000 | $83 | 52 |
| 3232 Del Park Ter Ter | 0.64mi | 4/2.5 (-1) | 2,192 (+3%) | 9mo | $211,000 | $96 | 51 |
| 657 Louis Coleman Jr Dr | 0.74mi | 4/4.5 (-1) | 2,223 (+4%) | 9mo | $72,500 | $33 | 36 |
| 3141 River Park Dr | 0.48mi | 4/3.0 (-1) | 2,340 (+10%) | 22mo | $197,000 | $84 | 34 |
| 3612 River Park Dr | 0.71mi | 5/2.0 | 1,926 (-10%) | 24mo | $187,500 | $97 | 31 |
Match score weights: distance 35% · size 25% · config 20% · recency 20%. Top-matched comps best support the ARV.
Projected returns pro-forma
10.0% appreciation · 0.51% rent growth · sell at horizon
- IRR
- 25.3%
- Equity multiple
- 3.00×
- Total profit
- $112,219
- Equity at exit
- $180,176
- IRR
- 21.7%
- Equity multiple
- 6.66×
- Total profit
- $316,761
- Equity at exit
- $388,556
Cash invested: $56,000 (down + closing). Projections, not guarantees.
Landlord ↔ Tenant lean methodology
- Overall (STATE)
- 83 Strongly Landlord-Friendly
- State Kentucky
- 83 Strongly Landlord-Friendly · R+16
- County
- — inherits STATE
- City
- — inherits STATE
ZIP-level market 40212
- Home prices YoY
- 11.0%
- Rents YoY
- 0.5%
- Active inventory
- 140
- Price-to-rent
- 9.8×
Monthly cashflow live
- Estimated rent
- $1,709 high interval (Pro) →
- Mortgage (P&I)
- −$1,049
- Tax from tax record
- −$100 /mo · $1,197/yr
- Insurance
- −$83
- HOA
- −$0
- Vacancy / Maint / Mgmt
- −$359
- Net cashflow
- $118
Break-even live
UW: 25.0% down · 7.5% · 30yr · 1.5% tax · 5.0% vac · 8.0% maint · 8.0% mgmt
Financing live
Cash to close
- Down payment
- $50,000
- Closing costs
- $6,000
- Reserves months
- —
- Total cash needed
- —
Loan-product check · same deal, 3 products live
Conventional
25% down · 7.5% · 30yr
- Down + closing
- —
- Monthly P&I
- —
- Monthly cashflow
- —
- DSCR
- —
- Eligible?
- —
Personal DTI + credit; lowest rate.
DSCR
20% down · 8.5% · 30yr
- Down + closing
- —
- Monthly P&I
- —
- Monthly cashflow
- —
- DSCR
- —
- Eligible?
- —
No personal income docs; deal must DSCR.
Hard money
10% down · 12.0% · 12mo
- Down + closing
- —
- Monthly P&I
- —
- Monthly cashflow
- —
- DSCR
- —
- Eligible?
- —
Short-term bridge; refi at stabilization.
Rent comps 6 comps
| Address | Beds | Baths | Sqft | Rent | $/sqft | DOM | Units | Dist |
|---|---|---|---|---|---|---|---|---|
| 205 N 26th St Louisville, KY | 5.0 | 2.0 | 1538 | $1,700 | $1.11 | 23d | 1 | 0.40mi |
| 2319 W Muhammad Ali Blvd Louisville, KY | 4.0 | 1.0 | 1644 | $1,300 | $0.79 | 16d | 1 | 0.64mi |
| 820 Hazel St Louisville, KY | 4.0 | 2.0 | 1872 | $1,395 | $0.75 | 2d | 1 | 0.97mi |
| 3909 W Broadway Louisville, KY | 5.0 | 2.0 | 2000 | $1,745 | $0.87 | 16d | 1 | 1.15mi |
| 858 S 23rd St Louisville, KY | 5.0 | 1.0 | 2228 | $2,100 | $0.94 | 17d | 1 | 1.16mi |
| 722 S 40th St Unit NA Louisville, KY | 4.0 | 2.5 | 1556 | $1,700 | $1.09 | 3d | 1 | 1.24mi |
Listing history 13 events
-
2026-06-18days on market $200,000 Active 20 DOM
-
2026-06-17days on market $200,000 Active 19 DOM
-
2026-06-16days on market $200,000 Active 18 DOM
-
2026-06-15days on market $200,000 Active 17 DOM
-
2026-06-13days on market $200,000 Active 15 DOM
-
2026-06-10days on market $200,000 Active 12 DOM
-
2026-06-09days on market $200,000 Active 11 DOM
-
2026-06-08days on market $200,000 Active 10 DOM
-
2026-06-07days on market $200,000 Active 9 DOM
-
2026-06-03days on market $200,000 Active 5 DOM
-
2026-06-02days on market $200,000 Active 4 DOM
-
2026-06-01days on market $200,000 Active 3 DOM
-
2026-05-31days on market $200,000 Active 2 DOM
ⓘ Source: listings_history table (triggers on properties + properties_extension) + one-shot
backfill from property_details.listing_events for pre-trigger history.
Tax reassessment forecast KY · Resets to sale price
- Current annual tax
- $1,197 · $100/mo
- Projected year-2 tax
- $1,720 · $143/mo
- Expected delta
- +$523/yr (+$44/mo · 43.7%)
ⓘ Screening estimate from a state-policy table — verify with the county assessor before closing.
Climate risk First Street
- Flood 1/10 Low FEMA zone X (unshaded) · 0% chance over 30 yrs
- Wildfire 1/10 Low
- Heat 5/10 Major 7 d/yr ≥105°F today · 20 d/yr by 30 yrs out
- Wind 2/10 Low 100% chance of damaging wind over 30 yrs
- Air quality 2/10 Low 1 unhealthy d/yr today · 2 by 30 yrs out
Nearby sold comps map
Loading sold comps map…
Walkable amenities ~0.75 mi
Loading nearby amenities…
Taxation est. · year 1
- Rental income
- $20,511
- − Mortgage interest
- −$11,203
- − Property taxes
- −$1,197
- − Insurance
- −$1,000
- − Repairs & maintenance
- −$1,641
- − Management
- −$1,641
- − Depreciation
- −$5,818
- Taxable loss
- −$1,989
- Est. tax savings @ 24.0%
- +$477
- After-tax cash flow
- $1,898/yr
For passive investors: Depreciation is non-cash, so a rental often shows a tax loss while cash-flowing — sheltering income. Rental losses are passive: they offset passive income freely, and up to $25,000/yr can offset ordinary (W-2) income if you actively participate and your MAGI is under $100k (phasing out to $0 by $150k); unused losses carry forward. On sale, claimed depreciation is recaptured at up to 25%, and gains may owe capital-gains tax (a 1031 exchange can defer both). Figures are a year-1 estimate at your 24.0% rate — not tax advice; consult a CPA.
Schools (NCES district)
- District
- Jefferson County
- NCES district ID
- 2102990
- Math proficiency
- 19% ▼ -17.00%
- Reading proficiency
- 35% ▼ -11.00%
- Median HH income
- $47,885
- Composite
- 23.45/100
- National rank
- #7884
- State rank
- #121 of 165 in KY
Livability — Louisville
- Score
- 63/100
- State rank
- #333
- US rank
- #15887
Category grades
Schools grade is shown separately in the Schools card above.
Census & demographics
- Census place
- Louisville, KY
- County
- Jefferson County · 790,184 people
- City population
- 769,292
- Metro
- Louisville/Jefferson County, KY-IN
- Population (ZIP)
- 14,661
- Household income
- $35,753
- Rent vs Own
- Severe rent burden
- 1148.0
Population outlook (Jefferson County) Hauer SSP2
- Today (2025)
- 823,112 people
- By 2030
- 849,343 · +3.2%
- By 2040
- 895,696 · +8.8%
- By 2050
- 933,630 · +13.4%
- By 2075
- 1,028,262 · +24.9%
- By 2100
- 1,072,675 · +30.3%
Race, ethnicity, and origin ACS 2023
- Neighborhood character
- Majority Black (60%)
- Race & ethnicity
- Black 60% White 37% Two or more races 2% Hispanic / Latino 1%
- Common ancestry
- Slovak 1% Lithuanian 1% Iranian 1%
- Foreign-born
- 1% · Canada
- Languages at home
- 98% English-only · Spanish 1%
Political lean MEDSL · Jefferson
- 2024 margin
- D (+16.6) · D 57.4% · R 40.9% · Other 1.7%
- 2008→2024 swing
- +4.5pp toward D · 2008: 12.0pp · 2024: 16.6pp
- All cycles
- 2024: D+16.6 2020: D+20.1 2016: D+13.3 2012: D+11.1 2008: D+12.0
Not yet ingested
- Civics
- —
Market trends
- HPI YoY
- ▲ 29.02%
- Current HPI
- 293.2624
- Rent YoY
- ▲ 0.51%
- Metro
- Louisville/Jefferson County, KY-IN
- State GDP YoY
- ▲ 1.81%
- F500 in state
- 4
Industry mix (Fortune 500 HQ in KY)
| Industry | F500 HQs | Revenue |
|---|---|---|
| Healthcare | 1 | $118B |
|
||
| Food / Beverage | 1 | $7B |
|
||
Price history
+1042.9% since first listed14 events — show timeline
- 2026-05-29 Listed $200,000 Metro Search MLS
- 2025-08-28 Price Changed $189,500 Metro Search MLS
- 2025-05-13 Price Changed $215,999 Metro Search MLS
- 2017-12-11 Sold (Public Records) $75,000 Public Records
- 2009-08-11 Sold (MLS) $10,000 Metro Search MLS
- 2009-07-09 Listing Removed — Metro Search MLS
- 2009-06-09 Listing Removed — Metro Search MLS
- 2009-05-28 Listing Removed — Metro Search MLS
- 2009-05-09 Listing Removed — Metro Search MLS
- 2009-03-11 Listed $17,500 Metro Search MLS
- 2009-03-11 Listed $17,500 Metro Search MLS
- 2009-03-11 Listed $12,500 Metro Search MLS
- 2009-03-11 Listed $10,000 Metro Search MLS
- 2009-03-11 Listed $17,500 Metro Search MLS
Property tax history
+20.1%/yrLatest (2025): $1,197 · -1.9% YoY. Source: county tax records.
Cash-flow waterfall
monthlySold comps — $/sqft
last 12 mo · ≤1 miLoading sold comps…