9942 Bayou Woods Dr · Baytown, TX
Flood risk 1/10 · Minimal
- FEMA flood zone
- X (unshaded)
- Chance of flooding over 30 yrs
- 0.0%
- Est. flood insurance / yr
- $507 – $1,088
Fire risk 4/10 · Minor
- Est. fire insurance / yr
- $1,222 – $2,270
Heat risk 9/10 · Severe
- Hot days now (above 111°F)
- 7 days/yr
- Hot days in 30 yrs
- 25 days/yr
Wind risk 9/10 · Severe
- Chance of severe wind over 30 yrs
- 99.0%
Air-quality risk 2/10 · Minimal
- Unhealthy air days now
- 1 days/yr
- Unhealthy air days in 30 yrs
- 1 days/yr
Risk factors via First Street. Map © Google.
Why this score? — see what drove the D+ grade
The composite is a weighted blend of 9 inputs, each scored 0–100. Each bar is that input's sub-score; the figure is the points it added to the 100-point composite (weight × sub-score).
- Cash flow +14.2/30.0
- ARV discount +14.1/15.0
- 1% rule +5.0/10.0
- DSCR +4.3/10.0
- Livability +3.5/5.0
- Schools +3.2/10.0
- Rent growth +2.9/5.0
- Condition / age +2.5/5.0
- Appreciation +0.0/10.0
$210,000
🖨 Deal sheet (PDF) 📄 Offer letter ✓ Due diligence
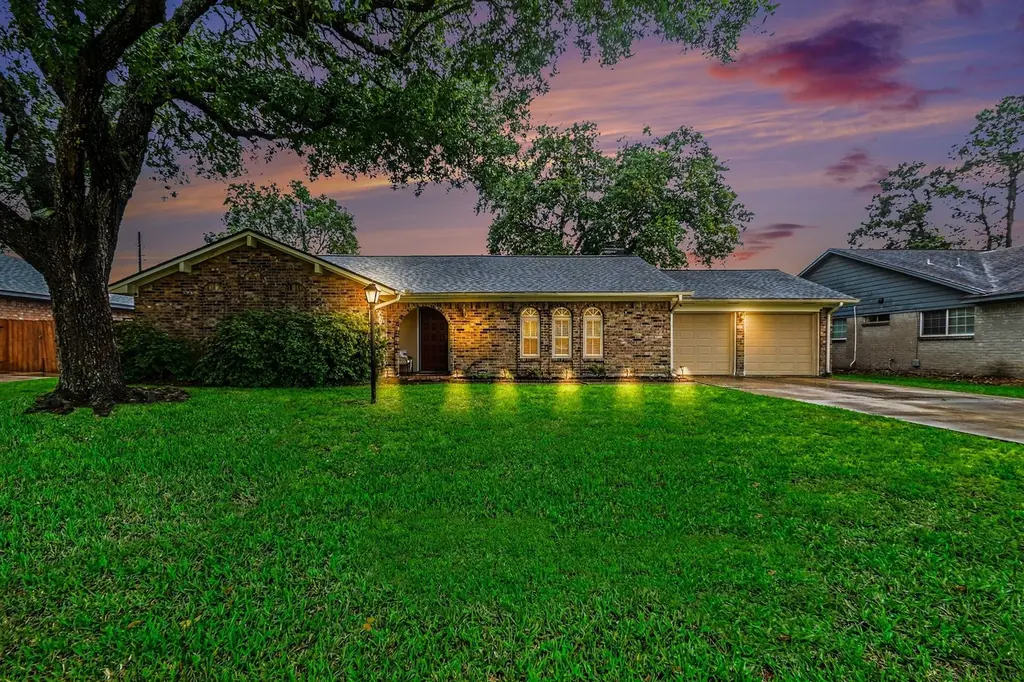
Listing remarks
Welcome to this lovely home with a spacious back yard with mature trees in a desired neighborhood. Step in to a great floor plan with entry, vaulted ceiling living room with fireplace, and circle around to the dining room and kitchen. Granite counters and tile backsplash add modern touches. Fridge included. The hall leads to 3 bedrooms and two baths. Primary bath has updated tile shower. Enjoy the spacious back yard and covered patio with privacy fence. Updates include new roof 2024, pex plumbing, Window World windows and sliding glass door, new carpet 2026, electrical panel replaced. Convenient location for shopping or commuting. Motivated sellers. NEVER flooded!
Key facts
- Large backyard
- Covered patio
- Privacy fence
Tags
Property features AI
Finance
- HOA & community: Pinehurst HOA/ CMI; HOA covers common areas; Annual HOA fee of $100; Community amenities include playground, park, and tennis courts
Exterior
- Parking: Attached garage with garage door opener (2 car)
- Utilities: Public water; Public sewer
- Home design: Residential property; North-facing; Built in 1978; Slab foundation
- Construction: Brick construction; Composition roof
- Exterior features: Covered patio; Patio; Deck; Fenced backyard; Subdivision lot features
Interior
- Kitchen: Dishwasher; Electric oven; Electric range; Microwave; Disposal; Refrigerator; ENERGY STAR qualified appliances
- Bedrooms: Primary bedroom on the first floor (approx. 12x14); Bedroom on the first floor (approx. 10x12); Bedroom on the first floor (approx. 10x11)
- Flooring: Carpet; Vinyl
- Bathrooms: 2 full bathrooms
- Heating & cooling: Central heating (electric); Central air (electric)
- Interior features: Breakfast bar; Vaulted ceilings; Window treatments; Low-E windows; Window coverings; Wood-burning fireplace (1)
- Laundry & utility: Washer hookup; Electric dryer hookup
Neighborhood map
What this means for you Summary
Snapshot
- This is a 3-bed/2.0-bath single-family listed at $210k.
Deal economics
- At list price, monthly cash flow is $35 ($425/yr) — positive.
- The deal already cash-flows at list — no discount required.
- Meets the 1% rule at list price ($2k rent vs $210k).
- Recommended offer: $204k (3.0% below list) — sets the bar for market timing.
- Cap rate 6.5% vs local median 4.2% in Baytown — top-decile yield for the area; either an underpriced asset or a hidden risk that comps aren't pricing in. Stress-test before assuming the spread holds.
Location & tenants
- Location reads 69/100 on livability (#412 in TX) — a middle-class / working-renter tenant base. Strengths: cost of living A+, housing A+; Watch: employment D+, crime F, amenities F.
- Goose Creek CISD (urban): math 37% / reading 36% proficiency, ranked #473 of 826 in TX (top 57%) — families likely to look elsewhere, expect single-tenant / working-renter base with shorter leases; 61% free/reduced lunch — lower-income household profile, screen leases tightly.
- Zoned schools: Clark El (math 37% / reading 47%, grade F, #1,335 of 4,322 statewide, top 33%, 683 students, 63% FRL); E F Green Junior School (1,020 students, 67% FRL); High Point School (12 students, 75% FRL).
- Market conditions: Rents rising (+1.5%/yr); 624 active listings in the ZIP; 4 comparable units currently listed for rent nearby; rentals leasing fast (median 1d on market — plan ~1-2 weeks tenant-placement turnaround); 629 units permitted in Chambers County in 2024 (0 in 5+ unit buildings).
- This rent runs 34% of the median local income ($74k/yr) — at the standard rent-burdened threshold; future hikes will face affordability resistance.
Forward outlook
- Local home prices are declining (-3.0%/yr); year-one equity from $1k of loan paydown is wiped out by about $6k of value loss. Plan a longer hold.
- Chambers County population projected at +46% by 2050 — long-run rental-demand tailwind backs the buy-and-hold thesis.
Negotiation context
- It's been on market 32 days — a 3% lower offer ($204k) is reasonable based on typical stale-listing flexibility.
- 2 sale attempts with the ask held roughly flat each time — persistent listings suggest the price (not the market) is what's stuck; bring a comps-based counter.
Risks & watch-outs
- Climate carrying-cost: severe wind risk, 99% chance of damaging wind over 30y; extreme-heat days projected 7→25/yr by 2055 (HVAC capex compounding) — expect insurance premiums to compound above CPI over the hold.
Questions for the listing agent
- It's been on market 32 days. Have you received any prior offers? Is the seller open to a 3% concession, seller financing, or rate buy-down credit?
- Built in 1978 — when were the roof, HVAC, electrical panel, plumbing, and water heater last replaced?
- What does the HOA fee cover, when was the last increase, and are there any pending special assessments or reserve-fund shortfalls?
- Is there a deadline driving the sale (1031 exchange, divorce, estate, relocation)? That informs how much negotiation room exists.
- Schools are D-rated, which usually means shorter tenancies and higher turnover. Who's the typical renter profile here, and what's been the actual vacancy rate?
- Crime grade is F in this area — have there been break-ins, vandalism, or insurance claims at this property in the last 3 years? What carrier currently insures it and at what premium?
- The area grade is low — what's the realistic commute time and amenity access for the typical tenant pool here? Any planned neighborhood developments (good or bad) we should know about?
- What's the average days-on-market for RENTAL listings here right now (not sales)? A rising rental-DOM trend means longer vacancies and softer asking-rent achievability than the comps imply.
- What's the recent tenant-quality profile in this submarket — average credit score on applications, eviction rate, late-payment / NSF rate, and stable-employment percentage? A property-management company in the area should have these aggregated.
- How much new for-sale + rental construction is in the pipeline within 1–3 miles? Heavy new supply typically softens prices + rents 12–24 months out; constrained supply supports both.
Investment metrics
- 1% rule
- 1.00% ✓
- Cap rate
- 6.50%
- Cash-on-cash
- 0.72%
- DSCR
- 1.03
- GRM
- 8.3
CMA / ARV
- ARV (on-the-fly)
- $245,846
- Comps found
- 12
Show comp detail 12 sales within ~0.75 mi
| Address | Dist | Beds/Ba | Sqft | Sold | Price | $/sf | Match |
|---|---|---|---|---|---|---|---|
| 9942 Bayou Woods Dr | 0.00mi | 3/2.0 | 1,481 (0%) | 1mo | $210,000 | $142 | 100 |
| 9915 Bayou Woods Dr | 0.11mi | 3/2.0 | 1,484 (+0%) | 3mo | $244,900 | $165 | 92 |
| 7319 Willow Oak Dr | 0.17mi | 3/2.0 | 1,488 (+0%) | 5mo | $237,000 | $159 | 87 |
| 10010 Pinehurst St | 0.08mi | 3/2.5 | 1,546 (+4%) | 8mo | $284,000 | $184 | 80 |
| 9911 Bayou Woods Dr | 0.12mi | 3/3.0 | 1,388 (-6%) | 1mo | $235,000 | $169 | 79 |
| 9802 Bayou Woods Dr | 0.32mi | 3/2.0 | 1,413 (-5%) | 2mo | $239,500 | $169 | 76 |
| 7106 Hopi St | 0.14mi | 3/2.0 | 1,640 (+11%) | 8mo | $275,000 | $168 | 69 |
| 9763 El Chaco St | 0.35mi | 3/2.0 | 1,603 (+8%) | 2mo | $150,000 | $94 | 68 |
| 10023 Sweet Gum Ln | 0.18mi | 3/2.0 | 1,683 (+14%) | 2mo | $279,999 | $166 | 67 |
| 7302 Maple Ln | 0.19mi | 3/2.0 | 1,693 (+14%) | 2mo | $283,000 | $167 | 66 |
| 10010 Pine Valley Ct | 0.61mi | 4/2.0 (+1) | 1,604 (+8%) | 3mo | $255,000 | $159 | 50 |
| 1703 Sterling Dr | 0.70mi | 2/1.0 (-1) | 1,454 (-2%) | 8mo | $224,500 | $154 | 49 |
Match score weights: distance 35% · size 25% · config 20% · recency 20%. Top-matched comps best support the ARV.
Projected returns pro-forma
-3.0% appreciation · 1.48% rent growth · sell at horizon
- IRR
- -17.0%
- Equity multiple
- 0.41×
- Total profit
- $-34,806
- Equity at exit
- $31,312
- IRR
- -12.2%
- Equity multiple
- 0.33×
- Total profit
- $-39,468
- Equity at exit
- $18,157
Cash invested: $58,800 (down + closing). Projections, not guarantees.
Landlord ↔ Tenant lean methodology
- Overall (STATE)
- 87 Strongly Landlord-Friendly
- State Texas
- 87 Strongly Landlord-Friendly · R+5
- County
- — inherits STATE
- City
- — inherits STATE
ZIP-level market 77521
- Rents YoY
- 1.5%
- Active inventory
- 624
- Price-to-rent
- 8.3×
Monthly cashflow live
- Estimated rent
- $2,108 medium interval (Pro) →
- Mortgage (P&I)
- −$1,101
- Tax from tax record
- −$433 /mo · $5,201/yr
- Insurance
- −$88
- HOA
- −$8
- Vacancy / Maint / Mgmt
- −$443
- Net cashflow
- $35
Break-even live
Sensitivity live
| Price | -10% $154 | -5% $95 | +0% $35 | +5% $-24 | +10% $-83 |
|---|---|---|---|---|---|
| Rent | -10% $-131 | -5% $-48 | +0% $35 | +5% $119 | +10% $202 |
| Rate | -1.0pp $141 | -0.5pp $89 | base $35 | +0.5pp $-19 | +1.0pp $-74 |
UW: 25.0% down · 7.5% · 30yr · 1.5% tax · 5.0% vac · 8.0% maint · 8.0% mgmt
Financing live
Cash to close
- Down payment
- $52,500
- Closing costs
- $6,300
- Reserves months
- —
- Total cash needed
- —
Loan-product check · same deal, 3 products live
Conventional
25% down · 7.5% · 30yr
- Down + closing
- —
- Monthly P&I
- —
- Monthly cashflow
- —
- DSCR
- —
- Eligible?
- —
Personal DTI + credit; lowest rate.
DSCR
20% down · 8.5% · 30yr
- Down + closing
- —
- Monthly P&I
- —
- Monthly cashflow
- —
- DSCR
- —
- Eligible?
- —
No personal income docs; deal must DSCR.
Hard money
10% down · 12.0% · 12mo
- Down + closing
- —
- Monthly P&I
- —
- Monthly cashflow
- —
- DSCR
- —
- Eligible?
- —
Short-term bridge; refi at stabilization.
Rent comps 4 comps
| Address | Beds | Baths | Sqft | Rent | $/sqft | DOM | Units | Dist |
|---|---|---|---|---|---|---|---|---|
| 1716 Sterling Dr Baytown, TX | 3.0 | 2.0 | 1371 | $2,250 | $1.64 | 45d | 1 | 0.70mi |
| 1900 Kilgore Pkwy Baytown, TX | 1.0–2.0 | 1.0–2.0 | 918 | $1,956 | $2.13 | 0d | 17 | 0.82mi |
| 2100 Kilgore Pkwy Baytown, TX | 1.0–2.0 | 1.0–2.0 | 920 | $1,964 | $2.13 | 0d | 13 | 1.07mi |
| 10235 Cedar Crossing St Baytown, TX | 1.0–3.0 | 1.0–2.0 | 1097 | $2,506 | $2.28 | 0d | 28 | 1.19mi |
HOA detail
- Monthly dues
- $8 · $96/yr
- Likely covers
- electric
Listing history 8 events
-
2026-05-12status Pending
-
2026-05-01status Pending
-
2026-04-20price $210,000
-
2026-04-17status Active
-
2026-04-15status Pending
-
2026-04-09$215,000 Active
-
2004-12-22soldstatus
-
1987-06-04soldstatus
ⓘ Source: listings_history table (triggers on properties + properties_extension) + one-shot
backfill from property_details.listing_events for pre-trigger history.
Tax reassessment forecast TX · Resets to sale price
- Current annual tax
- $5,201 · $433/mo
- Projected year-2 tax
- $5,201 · $433/mo
- Expected delta
- $0/yr ($0/mo · 0.0%)
ⓘ Screening estimate from a state-policy table — verify with the county assessor before closing.
Climate risk First Street
- Flood 1/10 Low FEMA zone X (unshaded) · 0% chance over 30 yrs
- Wildfire 4/10 Moderate
- Heat 9/10 Extreme 7 d/yr ≥111°F today · 25 d/yr by 30 yrs out
- Wind 9/10 Extreme 99% chance of damaging wind over 30 yrs
- Air quality 2/10 Low 1 unhealthy d/yr today · 1 by 30 yrs out
Nearby sold comps map
Loading sold comps map…
Walkable amenities ~0.75 mi
Loading nearby amenities…
Taxation est. · year 1
- Rental income
- $25,301
- − Mortgage interest
- −$11,763
- − Property taxes
- −$5,201
- − Insurance
- −$1,050
- − Repairs & maintenance
- −$2,024
- − Management
- −$2,024
- − HOA
- −$96
- − Depreciation
- −$6,109
- Taxable loss
- −$2,967
- Est. tax savings @ 24.0%
- +$712
- After-tax cash flow
- $1,137/yr
For passive investors: Depreciation is non-cash, so a rental often shows a tax loss while cash-flowing — sheltering income. Rental losses are passive: they offset passive income freely, and up to $25,000/yr can offset ordinary (W-2) income if you actively participate and your MAGI is under $100k (phasing out to $0 by $150k); unused losses carry forward. On sale, claimed depreciation is recaptured at up to 25%, and gains may owe capital-gains tax (a 1031 exchange can defer both). Figures are a year-1 estimate at your 24.0% rate — not tax advice; consult a CPA.
Schools (NCES district)
- District
- Goose Creek CISD
- NCES district ID
- 4821150
- Math proficiency
- 37% ▼ -11.00%
- Reading proficiency
- 36% ▼ -4.00%
- Median HH income
- $52,468
- Composite
- 31.84/100
- National rank
- #5877
- State rank
- #473 of 826 in TX
Livability — Baytown
- Score
- 69/100
- State rank
- #412
- US rank
- #8494
Category grades
Schools grade is shown separately in the Schools card above.
Census & demographics
- Census place
- Baytown, TX
- County
- Harris County · 4,702,590 people
- City population
- 135,579
- Metro
- Houston-The Woodlands-Sugar Land, TX
- Population (ZIP)
- 69,038
- Household income
- $73,629
- Rent vs Own
- Severe rent burden
- 2121.0
Population outlook (Chambers County) Hauer SSP2
- Today (2025)
- 46,946 people
- By 2030
- 51,094 · +8.8%
- By 2040
- 59,578 · +26.9%
- By 2050
- 68,318 · +45.5%
- By 2075
- 90,485 · +92.7%
- By 2100
- 104,885 · +123.4%
Race, ethnicity, and origin ACS 2023
- Neighborhood character
- Diverse neighborhood (Simpson 0.64)
- Race & ethnicity
- Hispanic / Latino 50% White 28% Two or more races 18% Black 17% Asian 3%
- Hispanic origin (detail)
- Mexican 42% Puerto Rican 2%
- Common ancestry
- Lithuanian 2% Slovak 1%
- Foreign-born
- 20% · Canada, Vietnam
- Languages at home
- 59% English-only · Spanish 36% French/Haitian/Cajun 1% Other Asian/Pacific 1%
Political lean MEDSL · Chambers
- 2024 margin
- Solid R (+65.6) · D 16.8% · R 82.4%
- 2008→2024 swing
- -14.4pp toward R · 2008: -51.2pp · 2024: -65.6pp
- All cycles
- 2024: R+65.6 2020: R+61.7 2016: R+62.1 2012: R+61.1 2008: R+51.2
Not yet ingested
- Civics
- —
Market trends
- HPI YoY
- ▼ -154.80%
- Current HPI
- 246.1892
- Rent YoY
- ▲ 1.48%
- Metro
- Houston-The Woodlands-Sugar Land, TX
- State GDP YoY
- ▲ 3.95%
- F500 in state
- 110
Industry mix (Fortune 500 HQ in TX)
| Industry | F500 HQs | Revenue |
|---|---|---|
| Energy | 16 | $1,198B |
|
||
| Technology | 5 | $198B |
|
||
| Engineering / Construction | 4 | $72B |
|
||
| Energy Services | 3 | $60B |
|
||
| Utilities | 3 | $41B |
|
||
| Healthcare | 2 | $330B |
|
||
Price history
-2.3% since first listed8 events — show timeline
- 2026-05-12 Pending — HARMLS
- 2026-05-01 Pending — HARMLS
- 2026-04-20 Price Changed $210,000 HARMLS
- 2026-04-17 Relisted — HARMLS
- 2026-04-15 Pending — HARMLS
- 2026-04-09 Listed $215,000 HARMLS
- 2004-12-22 Sold (Public Records) — Public Records
- 1987-06-04 Sold (Public Records) — Public Records
Property tax history
+5.2%/yrLatest (2025): $5,201 · +9.9% YoY. Source: county tax records.
Cash-flow waterfall
monthlySold comps — $/sqft
last 12 mo · ≤1 miLoading sold comps…