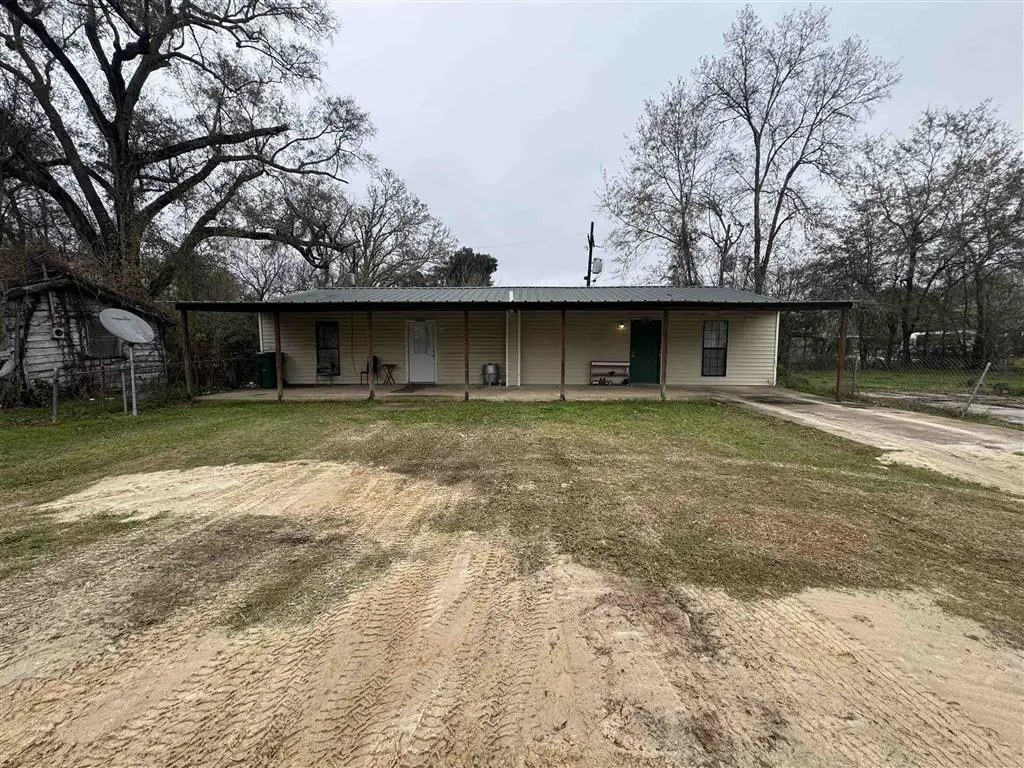
1025.5 Horridge St · Vinton, LA
Flood risk 8/10 · Major
- FEMA flood zone
- X (shaded)
- Chance of flooding over 30 yrs
- 0.99%
- Est. flood insurance / yr
- $507 – $1,088
Fire risk 4/10 · Minor
- Est. fire insurance / yr
- $1,269 – $2,357
Heat risk 9/10 · Severe
- Hot days now (above 109°F)
- 7 days/yr
- Hot days in 30 yrs
- 23 days/yr
Wind risk 9/10 · Severe
- Chance of severe wind over 30 yrs
- 99.0%
Air-quality risk 2/10 · Minimal
- Unhealthy air days now
- 1 days/yr
- Unhealthy air days in 30 yrs
- 1 days/yr
Risk factors via First Street. Map © Google.
Why this score? — see what drove the C+ grade
The composite is a weighted blend of 9 inputs, each scored 0–100. Each bar is that input's sub-score; the figure is the points it added to the 100-point composite (weight × sub-score).
- Cash flow +25.2/30.0
- DSCR +8.3/10.0
- ARV discount +7.5/15.0
- Appreciation +6.1/10.0
- 1% rule +5.4/10.0
- Livability +3.2/5.0
- Schools +3.1/10.0
- Rent growth +2.5/5.0
- Condition / age +2.5/5.0
$114,999
🖨 Deal sheet (PDF) 📄 Offer letter ✓ Due diligence
Listing remarks MLS
This well maintained duplex offers a turnkey investment with both units already occupied and producing income. Each side features comfortable living spaces designed to attract long term tenants. The property has a solid rental history, making it an ideal addition to any investor’s portfolio. With separate units, it provides flexibility and reduced vacancy risk. An excellent opportunity to own a stable income producing property in a desirable setting. * * All Measurements are more or Less * *
Key facts
- Solid rental history
- Turnkey investment
- Separate units
Tags
Neighborhood map
What this means for you Summary
Snapshot
- This is a 4-bed/2.0-bath townhouse listed at $115k.
Deal economics
- At list price, monthly cash flow is $191 ($2k/yr) — positive.
- The deal already cash-flows at list — no discount required.
- Meets the 1% rule at list price ($1k rent vs $115k).
- Recommended offer: $101k (12.0% below list) — sets the bar for market timing.
Location & tenants
- Location reads 64/100 on livability (#173 in LA) — a middle-class / working-renter tenant base. Strengths: cost of living A+, housing A+, health & safety A+; Watch: employment C-, crime F, amenities F.
- Calcasieu Parish (other): math 30% / reading 44% proficiency, ranked #29 of 98 in LA (top 30%) — families likely to look elsewhere, expect single-tenant / working-renter base with shorter leases.
- Market conditions: 50 active listings in the ZIP; 2 comparable units currently listed for rent nearby; 1,298 units permitted in Calcasieu Parish in 2024 (526 in 5+ unit buildings).
Forward outlook
- In year one you build about $3k of equity ($795 loan paydown + $3k appreciation (2.3% local appreciation)).
- Calcasieu County population projected at +11% by 2050 — modest demand growth; plan on rents tracking national, not racing it.
- At projected returns (2.3% appreciation + 3.0% rent growth), your $32k cash investment doubles in ~5 years — after that, you're playing with house money.
- By year 10, paydown + projected appreciation supports a ~$33k cash-out refi (75% LTV) — recoverable capital for the next deal without selling this one.
Negotiation context
- It's been on market 146 days — a 12% lower offer ($101k) is reasonable based on typical stale-listing flexibility.
Risks & watch-outs
- Watch-outs: flood insurance adds $66/mo.
- Climate carrying-cost: severe flood risk; severe wind risk, 99% chance of damaging wind over 30y; extreme-heat days projected 7→23/yr by 2055 (HVAC capex compounding) — expect insurance premiums to compound above CPI over the hold.
Questions for the listing agent
- It's been on market 146 days. Have you received any prior offers? Is the seller open to a 12% concession, seller financing, or rate buy-down credit?
- What's the actual annual flood-insurance premium (NFIP or private), and is the property in a SFHA with mandatory coverage?
- Why hasn't it sold? Are there any deal-killer items the seller is aware of (foundation, flood, title, zoning, code violations)?
- Is there a deadline driving the sale (1031 exchange, divorce, estate, relocation)? That informs how much negotiation room exists.
- Schools are B-rated — typically a magnet for longer-tenancy family renters. What's the average tenant stay here, and is there a school-zone premium baked into asking?
- Crime grade is F in this area — have there been break-ins, vandalism, or insurance claims at this property in the last 3 years? What carrier currently insures it and at what premium?
- What's the average days-on-market for RENTAL listings here right now (not sales)? A rising rental-DOM trend means longer vacancies and softer asking-rent achievability than the comps imply.
- What's the recent tenant-quality profile in this submarket — average credit score on applications, eviction rate, late-payment / NSF rate, and stable-employment percentage? A property-management company in the area should have these aggregated.
- How much new for-sale + rental construction is in the pipeline within 1–3 miles? Heavy new supply typically softens prices + rents 12–24 months out; constrained supply supports both.
Investment metrics
- 1% rule
- 1.04% ✓
- Cap rate
- 8.98%
- Cash-on-cash
- 9.60%
- DSCR
- 1.43
- GRM
- 8.0
CMA / ARV
No comps found within radius.
Projected returns pro-forma
2.26% appreciation · 3.0% rent growth · sell at horizon
- IRR
- 12.2%
- Equity multiple
- 1.67×
- Total profit
- $21,565
- Equity at exit
- $46,972
- IRR
- 14.8%
- Equity multiple
- 3.03×
- Total profit
- $65,436
- Equity at exit
- $68,901
Cash invested: $32,200 (down + closing). Projections, not guarantees.
Landlord ↔ Tenant lean methodology
- Overall (STATE)
- 90 Strongly Landlord-Friendly
- State Louisiana
- 90 Strongly Landlord-Friendly · R+12
- County
- — inherits STATE
- City
- — inherits STATE
ZIP-level market 70668
- Home prices YoY
- 3.1%
- Active inventory
- 50
- Price-to-rent
- 8.0×
Monthly cashflow live
- Estimated rent
- $1,200 medium interval (Pro) →
- Mortgage (P&I)
- −$603
- Tax from tax record
- −$39 /mo · $474/yr
- Insurance
- −$48
- Flood insurance flood zone
- −$66 /mo · $798/yr
- HOA
- −$0
- Vacancy / Maint / Mgmt
- −$252
- Net cashflow
- $191
Break-even live
Sensitivity live
| Price | -10% $256 | -5% $224 | +0% $191 | +5% $159 | +10% $126 |
|---|---|---|---|---|---|
| Rent | -10% $96 | -5% $144 | +0% $191 | +5% $238 | +10% $286 |
| Rate | -1.0pp $249 | -0.5pp $220 | base $191 | +0.5pp $161 | +1.0pp $131 |
UW: 25.0% down · 7.5% · 30yr · 1.5% tax · 5.0% vac · 8.0% maint · 8.0% mgmt
Financing live
Cash to close
- Down payment
- $28,750
- Closing costs
- $3,450
- Reserves months
- —
- Total cash needed
- —
Loan-product check · same deal, 3 products live
Conventional
25% down · 7.5% · 30yr
- Down + closing
- —
- Monthly P&I
- —
- Monthly cashflow
- —
- DSCR
- —
- Eligible?
- —
Personal DTI + credit; lowest rate.
DSCR
20% down · 8.5% · 30yr
- Down + closing
- —
- Monthly P&I
- —
- Monthly cashflow
- —
- DSCR
- —
- Eligible?
- —
No personal income docs; deal must DSCR.
Hard money
10% down · 12.0% · 12mo
- Down + closing
- —
- Monthly P&I
- —
- Monthly cashflow
- —
- DSCR
- —
- Eligible?
- —
Short-term bridge; refi at stabilization.
Rent comps 2 comps
| Address | Beds | Baths | Sqft | Rent | $/sqft | DOM | Units | Dist |
|---|---|---|---|---|---|---|---|---|
| 1908 Center St Vinton, LA | 3.0 | 2.0 | 1280 | $1,200 | $0.94 | 44d | 1 | 0.50mi |
| 1914 Center St Vinton, LA | 3.0 | 2.0 | 1280 | $1,200 | $0.94 | 44d | 1 | 0.54mi |
Listing history 18 events
-
2026-06-21days on market $114,999 Active 146 DOM
-
2026-06-19days on market $114,999 Active 144 DOM
-
2026-06-18days on market $114,999 Active 143 DOM
-
2026-06-17days on market $114,999 Active 142 DOM
-
2026-06-16days on market $114,999 Active 141 DOM
-
2026-06-15days on market $114,999 Active 140 DOM
-
2026-06-14days on market $114,999 Active 138 DOM
-
2026-06-13days on market $114,999 Active 137 DOM
-
2026-06-10days on market $114,999 Active 135 DOM
-
2026-06-09days on market $114,999 Active 134 DOM
-
2026-06-08days on market $114,999 Active 133 DOM
-
2026-06-07days on market $114,999 Active 132 DOM
-
2026-06-05days on market $114,999 Active 129 DOM
-
2026-06-02days on market $114,999 Active 127 DOM
-
2026-06-01days on market $114,999 Active 126 DOM
-
2026-05-31days on market $114,999 Active 125 DOM
-
2026-05-30days on market $114,999 Active 124 DOM
-
2026-01-26$114,999 Active 504-char remark
Show marketing remark (504 chars)
This well maintained duplex offers a turnkey investment with both units already occupied and producing income. Each side features comfortable living spaces designed to attract long term tenants. The property has a solid rental history, making it an ideal addition to any investor’s portfolio. With separate units, it provides flexibility and reduced vacancy risk. An excellent opportunity to own a stable income producing property in a desirable setting. * * All Measurements are more or Less * *
ⓘ Source: listings_history table (triggers on properties + properties_extension) + one-shot
backfill from property_details.listing_events for pre-trigger history.
Tax reassessment forecast LA · Resets to sale price
- Current annual tax
- $474 · $39/mo
- Projected year-2 tax
- $632 · $53/mo
- Expected delta
- +$159/yr (+$13/mo · 33.5%)
ⓘ Screening estimate from a state-policy table — verify with the county assessor before closing.
Climate risk First Street
- Flood 8/10 Severe FEMA zone X (shaded) · 99% chance over 30 yrs
- Wildfire 4/10 Moderate
- Heat 9/10 Extreme 7 d/yr ≥109°F today · 23 d/yr by 30 yrs out
- Wind 9/10 Extreme 99% chance of damaging wind over 30 yrs
- Air quality 2/10 Low 1 unhealthy d/yr today · 1 by 30 yrs out
Nearby sold comps map
Loading sold comps map…
Walkable amenities ~0.75 mi
Loading nearby amenities…
Taxation est. · year 1
- Rental income
- $14,400
- − Mortgage interest
- −$6,442
- − Property taxes
- −$474
- − Insurance
- −$1,372
- − Repairs & maintenance
- −$1,152
- − Management
- −$1,152
- − Depreciation
- −$3,345
- Taxable income
- $463
- Est. tax owed @ 24.0%
- −$111
- After-tax cash flow
- $2,182/yr
For passive investors: Depreciation is non-cash, so a rental often shows a tax loss while cash-flowing — sheltering income. Rental losses are passive: they offset passive income freely, and up to $25,000/yr can offset ordinary (W-2) income if you actively participate and your MAGI is under $100k (phasing out to $0 by $150k); unused losses carry forward. On sale, claimed depreciation is recaptured at up to 25%, and gains may owe capital-gains tax (a 1031 exchange can defer both). Figures are a year-1 estimate at your 24.0% rate — not tax advice; consult a CPA.
Schools (NCES district)
- District
- Calcasieu Parish
- NCES district ID
- 2200330
- Math proficiency
- 30% ▼ -39.00%
- Reading proficiency
- 44% ▼ -33.00%
- Median HH income
- $44,700
- Composite
- 31.45/100
- National rank
- #5979
- State rank
- #29 of 98 in LA
Livability — Vinton
- Score
- 64/100
- State rank
- #173
- US rank
- #14337
Category grades
Schools grade is shown separately in the Schools card above.
Census & demographics
- Census place
- Vinton, LA
- Population (ZIP)
- 6,347
Population outlook (Calcasieu County) Hauer SSP2
- Today (2025)
- 212,179 people
- By 2030
- 218,199 · +2.8%
- By 2040
- 228,486 · +7.7%
- By 2050
- 236,208 · +11.3%
- By 2075
- 251,696 · +18.6%
- By 2100
- 247,848 · +16.8%
Race, ethnicity, and origin ACS 2023
- Neighborhood character
- Predominantly White (79%)
- Race & ethnicity
- White 79% Hispanic / Latino 13% Black 6% Two or more races 2%
- Hispanic origin (detail)
- Mexican 10%
- Common ancestry
- Lithuanian 7% Portuguese 2% Iranian 2%
- Foreign-born
- 1% · Canada
- Languages at home
- 92% English-only · Spanish 8%
Political lean MEDSL · Calcasieu
- 2024 margin
- Solid R (+39.6) · D 29.5% · R 69.0% · Other 1.5%
- 2008→2024 swing
- -15.0pp toward R · 2008: -24.6pp · 2024: -39.6pp
- All cycles
- 2024: R+39.6 2020: R+35.2 2016: R+33.3 2012: R+28.7 2008: R+24.6
Not yet ingested
- Civics
- —
Market trends
- HPI YoY
- ▲ 2.26%
- Current HPI
- 74.8296
- Rent YoY
- —
- Metro
- —
- State GDP YoY
- ▲ 3.29%
- F500 in state
- 10
Industry mix (Fortune 500 HQ in LA)
| Industry | F500 HQs | Revenue |
|---|---|---|
| Telecommunications | 2 | $23B |
|
||
| Utilities | 1 | $12B |
|
||
| Wholesale / Distribution | 1 | $5B |
|
||
| Advertising | 1 | $2B |
|
||
Price history
1 event — show timeline
- 2026-01-26 Listed $114,999 SWLAR
Property tax history
-0.4%/yrLatest (2025): $474 · -2.1% YoY. Source: county tax records.
Cash-flow waterfall
monthlySold comps — $/sqft
last 12 mo · ≤1 miLoading sold comps…