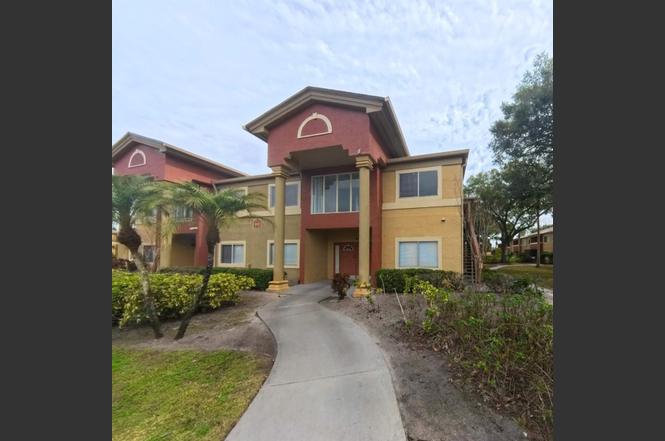
600 Kenwick Cir #202 · Casselberry, FL
Flood risk 1/10 · Minimal
- FEMA flood zone
- X (unshaded)
- Chance of flooding over 30 yrs
- 0.0%
- Est. flood insurance / yr
- $507 – $1,088
Fire risk 1/10 · Minimal
- Est. fire insurance / yr
- $947 – $1,759
Heat risk 8/10 · Major
- Hot days now (above 108°F)
- 7 days/yr
- Hot days in 30 yrs
- 22 days/yr
Wind risk 9/10 · Severe
- Chance of severe wind over 30 yrs
- 99.0%
Air-quality risk 2/10 · Minimal
- Unhealthy air days now
- 1 days/yr
- Unhealthy air days in 30 yrs
- 2 days/yr
Risk factors via First Street. Map © Google.
Why this score? — see what drove the D grade
The composite is a weighted blend of 9 inputs, each scored 0–100. Each bar is that input's sub-score; the figure is the points it added to the 100-point composite (weight × sub-score).
- Cash flow +9.9/30.0
- ARV discount +7.5/15.0
- 1% rule +6.5/10.0
- Schools +5.1/10.0
- Livability +3.7/5.0
- Rent growth +3.0/5.0
- DSCR +2.8/10.0
- Condition / age +2.5/5.0
- Appreciation +0.0/10.0
$151,997
🖨 Deal sheet 📄 Offer letter ✓ Due diligence
Listing remarks MLS
Short sale; listing price may not be sufficient to pay the total of all liens and costs of sale and the sale of property at full listing price may require the approval of sellers's lender(s). Remodeled condo in great community with swimming pool, tenniscourts, fitness center, and clubhouse. conveniently located near shopping centers, restaurants, SR 436, and 17-92. BANK APPROVED AT THIS PRICE !!CAN CLOSE IN 30 DAYS.
Key facts
- Open floor plan
- Clubhouse
- Car wash area
Tags
Neighborhood map
What this means for you Summary
Snapshot
- This is a 2-bed/2.0-bath condo listed at $152k.
Deal economics
- At list price, monthly cash flow is $-94 ($-1k/yr) — negative.
- To cash-flow at today's rent, offer at most $135k (11.0% below list).
- Meets the 1% rule at list price ($2k rent vs $152k).
- Recommended offer: $135k (11.0% below list) — sets the bar for cash-flow.
- Cap rate 5.5% vs local median 4.1% in Casselberry — top-decile yield for the area; either an underpriced asset or a hidden risk that comps aren't pricing in. Stress-test before assuming the spread holds.
Location & tenants
- Location reads 73/100 on livability (#314 in FL) — a middle-class / working-renter tenant base. Strengths: cost of living A+, housing A+, health & safety A-; Watch: crime C-, employment C-, amenities F.
- Seminole (suburban): math 57% / reading 61% proficiency, ranked #13 of 73 in FL (top 18%) — acceptable for families but not a draw, mixed tenant base, ~2y average lease.
- Zoned schools: Casselberry Elementary School (math 68% / reading 65%, grade B+, #473 of 2,144 statewide, top 23%, 766 students, 70% FRL); Lake Howell High School (math 36% / reading 49%, grade F, #264 of 667 statewide, top 41%, 2,205 students, 51% FRL) — zoned schools average 61% FRL vs 38% district-wide (22 pts higher); higher-poverty schools than district average — tighter screening recommended.
- Market conditions: Rents rising (+2.1%/yr); 186 active listings in the ZIP; 24 comparable units currently listed for rent nearby; rentals leasing fast (median 10d on market — plan ~1-2 weeks tenant-placement turnaround); 1,979 units permitted in Seminole County in 2024 (1,191 in 5+ unit buildings).
- This rent runs 30% of the median local income ($69k/yr) — at the standard rent-burdened threshold; future hikes will face affordability resistance.
Forward outlook
- Local home prices are declining (-3.0%/yr); year-one equity from $1k of loan paydown is wiped out by about $5k of value loss. Plan a longer hold.
- Seminole County population projected at +24% by 2050 — long-run rental-demand tailwind backs the buy-and-hold thesis.
Negotiation context
- It's been on market 77 days — a 6% lower offer ($143k) is reasonable based on typical stale-listing flexibility.
- 3 sale attempts since 16y ago with the ask held roughly flat each time — persistent listings suggest the price (not the market) is what's stuck; bring a comps-based counter.
- Current owner paid $44k; list at $152k implies a 249% gain — meaningful room to come down on a strong offer.
Risks & watch-outs
- Watch-outs: HOA is 24% of rent.
- Climate carrying-cost: severe wind risk, 99% chance of damaging wind over 30y; extreme-heat days projected 7→22/yr by 2055 (HVAC capex compounding) — expect insurance premiums to compound above CPI over the hold.
Questions for the listing agent
- What do current leases actually rent for vs. the listed asking? Can we see a recent rent roll and the last 12 months of T-12 income?
- It's been on market 77 days. Have you received any prior offers? Is the seller open to a 11% concession, seller financing, or rate buy-down credit?
- What does the HOA fee cover, when was the last increase, and are there any pending special assessments or reserve-fund shortfalls?
- Any open or pending special assessments — roof, HVAC, plumbing, elevator, façade? What's the per-unit balance and payoff schedule, and is the seller paying it off at close or rolling it to the buyer?
- Why hasn't it sold? Are there any deal-killer items the seller is aware of (foundation, flood, title, zoning, code violations)?
- Is there a deadline driving the sale (1031 exchange, divorce, estate, relocation)? That informs how much negotiation room exists.
- Schools are B-rated — typically a magnet for longer-tenancy family renters. What's the average tenant stay here, and is there a school-zone premium baked into asking?
- The area grade is low — what's the realistic commute time and amenity access for the typical tenant pool here? Any planned neighborhood developments (good or bad) we should know about?
- What's the average days-on-market for RENTAL listings here right now (not sales)? A rising rental-DOM trend means longer vacancies and softer asking-rent achievability than the comps imply.
- What's the recent tenant-quality profile in this submarket — average credit score on applications, eviction rate, late-payment / NSF rate, and stable-employment percentage? A property-management company in the area should have these aggregated.
- How much new apartment / multifamily construction is in the pipeline within 1–3 miles? Heavy new supply (>2% of stock underway) typically softens rents 12–24 months out; light construction supports rent growth.
Investment metrics
- 1% rule
- 1.15% ✓
- Cap rate
- 5.55%
- Cash-on-cash
- -2.66%
- DSCR
- 0.88
- GRM
- 7.3
CMA / ARV
No comps found within radius.
Projected returns pro-forma
-3.0% appreciation · 2.09% rent growth · sell at horizon
- IRR
- -21.9%
- Equity multiple
- 0.25×
- Total profit
- $-31,939
- Equity at exit
- $22,663
- IRR
- -18.7%
- Equity multiple
- 0.04×
- Total profit
- $-40,771
- Equity at exit
- $13,142
Cash invested: $42,559 (down + closing). Projections, not guarantees.
Landlord ↔ Tenant lean methodology
- Overall (STATE)
- 87 Strongly Landlord-Friendly
- State Florida
- 87 Strongly Landlord-Friendly · R+3
- County
- — inherits STATE
- City
- — inherits STATE
ZIP-level market 32707
- Rents YoY
- 2.1%
- Active inventory
- 186
- Price-to-rent
- 7.3×
Monthly cashflow live
- Estimated rent
- $1,744 high interval (Pro) →
- Mortgage (P&I)
- −$797
- Tax from tax record
- −$193 /mo · $2,317/yr
- Insurance
- −$63
- HOA
- −$419
- Vacancy / Maint / Mgmt
- −$366
- Net cashflow
- $-94
Break-even live
UW: 25.0% down · 7.5% · 30yr · 1.5% tax · 5.0% vac · 8.0% maint · 8.0% mgmt
Financing live
Cash to close
- Down payment
- $37,999
- Closing costs
- $4,560
- Reserves months
- —
- Total cash needed
- —
Loan-product check · same deal, 3 products live
Conventional
25% down · 7.5% · 30yr
- Down + closing
- —
- Monthly P&I
- —
- Monthly cashflow
- —
- DSCR
- —
- Eligible?
- —
Personal DTI + credit; lowest rate.
DSCR
20% down · 8.5% · 30yr
- Down + closing
- —
- Monthly P&I
- —
- Monthly cashflow
- —
- DSCR
- —
- Eligible?
- —
No personal income docs; deal must DSCR.
Hard money
10% down · 12.0% · 12mo
- Down + closing
- —
- Monthly P&I
- —
- Monthly cashflow
- —
- DSCR
- —
- Eligible?
- —
Short-term bridge; refi at stabilization.
Rent comps 24 comps
| Address | Beds | Baths | Sqft | Rent | $/sqft | DOM | Units | Dist |
|---|---|---|---|---|---|---|---|---|
| 610 Kenwick Cir #103 Casselberry, FL | 2.0 | 2.0 | 1126 | $1,600 | $1.42 | 16d | 1 | 0.03mi |
| 644 Kenwick Cir Casselberry, FL | 2.0 | 2.0 | 1126 | $1,575 | $1.40 | 16d | 1 | 0.06mi |
| 400 Sandpiper Ln Casselberry, FL | 1.0–3.0 | 1.0–2.0 | 937 | $1,605 | $1.71 | 3d | 11 | 0.31mi |
| 210 Welcome Way Fern Park, FL | 2.0 | 1.0–2.0 | 880 | $1,469 | $1.67 | 2d | 12 | 0.45mi |
| 310 Kentia Rd Casselberry, FL | 3.0 | 1.0 | 1034 | $1,800 | $1.74 | 14d | 1 | 0.52mi |
| 120 Waverly Dr Fern Park, FL | 3.0 | 2.0 | 1233 | $2,159 | $1.75 | 5d | 1 | 0.66mi |
| 2174 Sharp Ct Fern Park, FL | 1.0–2.0 | 1.0 | 664 | $1,379 | $2.08 | 2d | 20 | 0.75mi |
| 1000 Lake of the Woods Blvd Fern Park, FL | 2.0 | 1.0–2.0 | 945 | $1,525 | $1.61 | 24d | 2 | 0.83mi |
| 1000 Lake of the Woods Blvd Fern Park, FL | 1.0–2.0 | 1.0–2.0 | 886 | $1,600 | $1.80 | 5d | 3 | 0.83mi |
| 660 Jasmine Rd Casselberry, FL | 2.0 | 1.0 | 953 | $1,725 | $1.81 | 5d | 1 | 0.87mi |
| 2155 Fontebranda Loop Unit 150212 Casselberry, FL | 1.0 | 1.0 | 794 | $1,599 | $2.01 | 24d | 1 | 0.90mi |
| 2155 Fontebranda Loop Unit 180100 Casselberry, FL | 2.0 | 2.0 | 1020 | $1,799 | $1.76 | 24d | 1 | 0.90mi |
| 2401 Harleyford Pl Casselberry, FL | 3.0 | 2.5 | 1333 | $1,995 | $1.50 | 22d | 1 | 0.93mi |
| 1003 Sherrywood St Fern Park, FL | 2.0 | 2.0 | 1296 | $2,095 | $1.62 | 10d | 1 | 0.93mi |
| 512 El Dorado Way Casselberry, FL | 3.0 | 1.0 | 1094 | $1,895 | $1.73 | 5d | 1 | 1.01mi |
| 1227 Merritt St Altamonte Springs, FL | 3.0 | 2.0 | 1280 | $2,100 | $1.64 | 24d | 1 | 1.03mi |
| 617 E Helm Way Casselberry, FL | 3.0 | 1.0 | 1000 | $1,995 | $2.00 | 5d | 1 | 1.11mi |
| 202 Esplanade Way Unit Esplanade Way-202 Casselberry, FL | 1.0 | 1.0 | 722 | $1,200 | $1.66 | 24d | 1 | 1.12mi |
| 291 Ivey Rd Casselberry, FL | 3.0 | 2.0 | 1100 | $2,190 | $1.99 | 3d | 1 | 1.23mi |
| 400 Morrill Ter Casselberry, FL | 2.0 | 1.0 | 1000 | $1,550 | $1.55 | 5d | 1 | 1.39mi |
| 1166 Pointe Newport Ter Casselberry, FL | 1.0–3.0 | 1.0–2.0 | 961 | $1,768 | $1.84 | 5d | 16 | 1.39mi |
| 117 Georgetown Dr Unit C Casselberry, FL | 2.0 | 2.0 | 1095 | $1,550 | $1.42 | 24d | 1 | 1.41mi |
| 602 Desoto Dr Casselberry, FL | 3.0 | 2.0 | 1405 | $2,500 | $1.78 | 5d | 1 | 1.42mi |
| 112 Highland Dr Fern Park, FL | 3.0 | 1.0 | 1192 | $1,885 | $1.58 | 24d | 1 | 1.42mi |
HOA detail condo
- Monthly dues
- $419 · $5,028/yr
- Likely covers
- poolgym
- Assessments
- None detected in remarks — confirm with the listing agent.
Listing history 7 events
-
2026-04-09status Pending
-
2026-03-11price $151,997
-
2026-01-22$155,900 Active
-
2024-10-23historical
-
2024-08-22$195,000 Active
-
2011-10-19soldstatus $43,500 419-char remark
Show marketing remark (419 chars)
Short sale; listing price may not be sufficient to pay the total of all liens and costs of sale and the sale of property at full listing price may require the approval of sellers's lender(s). Remodeled condo in great community with swimming pool, tenniscourts, fitness center, and clubhouse. conveniently located near shopping centers, restaurants, SR 436, and 17-92. BANK APPROVED AT THIS PRICE !!CAN CLOSE IN 30 DAYS.
-
2010-08-03$45,999 419-char remark
Show marketing remark (419 chars)
Short sale; listing price may not be sufficient to pay the total of all liens and costs of sale and the sale of property at full listing price may require the approval of sellers's lender(s). Remodeled condo in great community with swimming pool, tenniscourts, fitness center, and clubhouse. conveniently located near shopping centers, restaurants, SR 436, and 17-92. BANK APPROVED AT THIS PRICE !!CAN CLOSE IN 30 DAYS.
ⓘ Source: listings_history table (triggers on properties + properties_extension) + one-shot
backfill from property_details.listing_events for pre-trigger history.
Tax reassessment forecast FL · Resets to sale price
- Current annual tax
- $2,317 · $193/mo
- Projected year-2 tax
- $2,317 · $193/mo
- Expected delta
- $0/yr ($0/mo · 0.0%)
ⓘ Screening estimate from a state-policy table — verify with the county assessor before closing.
Climate risk First Street
- Flood 1/10 Low FEMA zone X (unshaded) · 0% chance over 30 yrs
- Wildfire 1/10 Low
- Heat 8/10 Severe 7 d/yr ≥108°F today · 22 d/yr by 30 yrs out
- Wind 9/10 Extreme 99% chance of damaging wind over 30 yrs
- Air quality 2/10 Low 1 unhealthy d/yr today · 2 by 30 yrs out
Nearby sold comps map
Loading sold comps map…
Walkable amenities ~0.75 mi
Loading nearby amenities…
Taxation est. · year 1
- Rental income
- $20,933
- − Mortgage interest
- −$8,514
- − Property taxes
- −$2,317
- − Insurance
- −$760
- − Repairs & maintenance
- −$1,675
- − Management
- −$1,675
- − HOA
- −$5,028
- − Depreciation
- −$4,422
- Taxable loss
- −$3,457
- Est. tax savings @ 24.0%
- +$830
- After-tax cash flow
- $-303/yr
For passive investors: Depreciation is non-cash, so a rental often shows a tax loss while cash-flowing — sheltering income. Rental losses are passive: they offset passive income freely, and up to $25,000/yr can offset ordinary (W-2) income if you actively participate and your MAGI is under $100k (phasing out to $0 by $150k); unused losses carry forward. On sale, claimed depreciation is recaptured at up to 25%, and gains may owe capital-gains tax (a 1031 exchange can defer both). Figures are a year-1 estimate at your 24.0% rate — not tax advice; consult a CPA.
Schools (NCES district)
- District
- Seminole
- NCES district ID
- 1201710
- Math proficiency
- 57% ▼ -7.00%
- Reading proficiency
- 61% ▼ -1.00%
- Median HH income
- $58,478
- Composite
- 51.05/100
- National rank
- #1769
- State rank
- #13 of 73 in FL
Livability — Casselberry
- Score
- 73/100
- State rank
- #314
- US rank
- #5320
Category grades
Schools grade is shown separately in the Schools card above.
Census & demographics
- Census place
- Casselberry, FL
- County
- Seminole County · 436,154 people
- City population
- 45,584
- Metro
- Orlando-Kissimmee-Sanford, FL
- Population (ZIP)
- 39,493
- Household income
- $69,113
- Rent vs Own
- Severe rent burden
- 1482.0
Population outlook (Seminole County) Hauer SSP2
- Today (2025)
- 515,494 people
- By 2030
- 545,713 · +5.9%
- By 2040
- 598,068 · +16.0%
- By 2050
- 640,663 · +24.3%
- By 2075
- 724,461 · +40.5%
- By 2100
- 755,530 · +46.6%
Race, ethnicity, and origin ACS 2023
- Neighborhood character
- Diverse neighborhood (Simpson 0.61)
- Race & ethnicity
- White 56% Hispanic / Latino 27% Two or more races 14% Black 10% Asian 4%
- Hispanic origin (detail)
- Mexican 3% Puerto Rican 12% Cuban 4% Dominican 2%
- Common ancestry
- Hispanic 3% Romanian 2% Lithuanian 2%
- Foreign-born
- 15% · Canada, Jamaica, China
- Languages at home
- 76% English-only · Spanish 18% French/Haitian/Cajun 2% Other Indo-European 1%
Political lean MEDSL · Seminole
- 2024 margin
- Toss-up / Even · D 47.6% · R 51.1% · Other 1.3%
- 2008→2024 swing
- -0.8pp no change · 2008: -2.8pp · 2024: -3.5pp
- All cycles
- 2024: R+3.5 2020: D+2.8 2016: R+1.6 2012: R+6.5 2008: R+2.8
Not yet ingested
- Civics
- —
Market trends
- HPI YoY
- ▼ -251.90%
- Current HPI
- 342.1006
- Rent YoY
- ▲ 2.09%
- Metro
- Orlando-Kissimmee-Sanford, FL
- State GDP YoY
- ▲ 3.28%
- F500 in state
- 36
Industry mix (Fortune 500 HQ in FL)
| Industry | F500 HQs | Revenue |
|---|---|---|
| Industrial Technology | 2 | $29B |
|
||
| Insurance | 2 | $17B |
|
||
| Retail | 1 | $60B |
|
||
| Technology Distribution | 1 | $58B |
|
||
| Homebuilding | 1 | $35B |
|
||
| Technology Manufacturing | 1 | $35B |
|
||
Price history
+230.4% since first listed7 events — show timeline
- 2026-04-09 Pending — Stellar MLS as Distributed by MLS Grid
- 2026-03-11 Price Changed $151,997 Stellar MLS as Distributed by MLS Grid
- 2026-01-22 Listed $155,900 Stellar MLS as Distributed by MLS Grid
- 2024-10-23 Listing Removed — Stellar MLS as Distributed by MLS Grid
- 2024-08-22 Listed $195,000 Stellar MLS as Distributed by MLS Grid
- 2011-10-19 Sold (MLS) $43,500 Stellar MLS as Distributed by MLS Grid
- 2010-08-03 Listed $45,999 Stellar MLS as Distributed by MLS Grid
Property tax history
+10.6%/yrLatest (2025): $2,317 · +9.0% YoY. Source: county tax records.
Cash-flow waterfall
monthlySold comps — $/sqft
last 12 mo · ≤1 miLoading sold comps…