1606 College St · Lamar, MO
Flood risk No data
- FEMA flood zone
- —
- Chance of flooding over 30 yrs
- —
- Est. flood insurance / yr
- —
Fire risk No data
- Est. fire insurance / yr
- —
Heat risk No data
- Hot days now (above threshold)
- —
- Hot days in 30 yrs
- —
Wind risk No data
- Chance of severe wind over 30 yrs
- —
Air-quality risk No data
- Unhealthy air days now
- —
- Unhealthy air days in 30 yrs
- —
Risk factors via First Street. Map © Google.
Why this score? — see what drove the C- grade
The composite is a weighted blend of 9 inputs, each scored 0–100. Each bar is that input's sub-score; the figure is the points it added to the 100-point composite (weight × sub-score).
- Cash flow +18.0/30.0
- ARV discount +15.0/15.0
- DSCR +5.6/10.0
- 1% rule +4.8/10.0
- Livability +3.2/5.0
- Schools +3.1/10.0
- Rent growth +2.5/5.0
- Condition / age +2.2/5.0
- Appreciation +0.0/10.0
$124,900
🖨 Deal sheet 📄 Offer letter ✓ Due diligence
Listing remarks
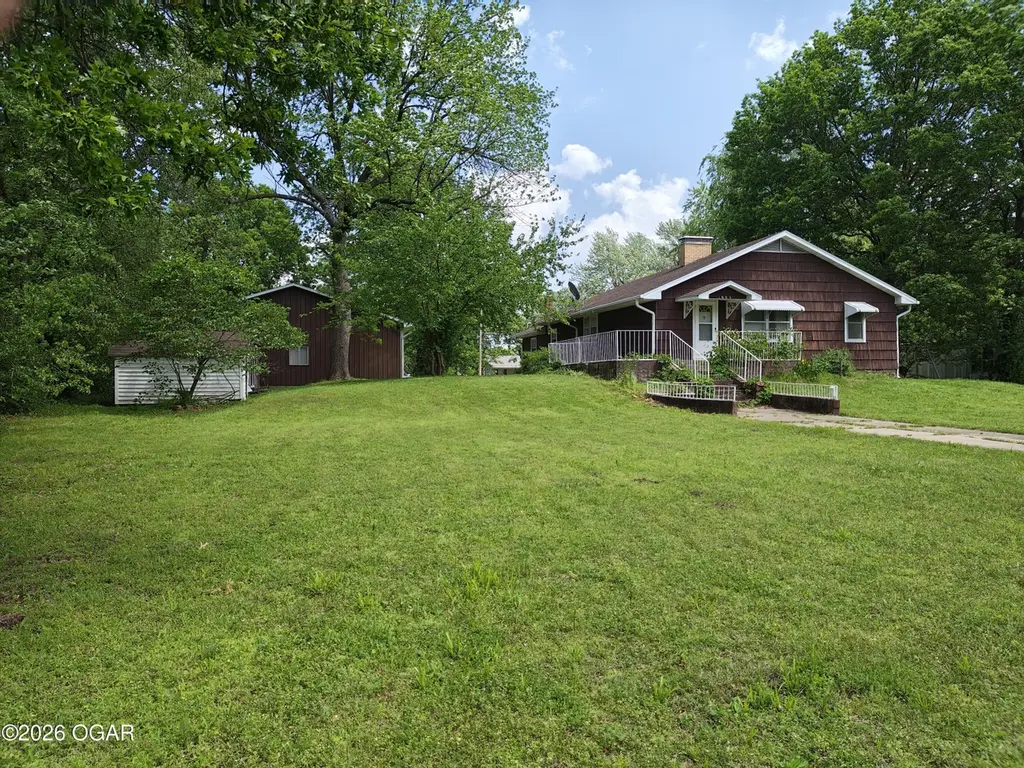
Bungalow situate on site of historic Lamar College boasts spacious kitchen (all appliances convey), two living areas, 3 bedrooms each displaying true hardwood flooring, and remodeled bath with low, step-in shower. Hi-efficiency central heat, central air. Unfinished basement. Open front porch covers over 450 sq ft and is a natural place to linger. There's a rear patio as well. Lot is one block deep with frontage and access on both College and Heagon streets . .. there's room for family, friends, in-laws, extras and all their cars on this lot. 34'x40' detached garage/shop has three overhead doors. Two lawn storage buildings will stay including one really nice 20'x 12' that can keep a lot of '
Key facts
- 0.74 acre lot
- 4 garage spots
- Built 1900
Property features AI
Exterior
- Parking: Attached/detached garage space for 4+ cars; 4 garage spaces
- Utilities: Public sewer
- Home design: Single-family residence; Residential property; Freestanding
- Construction: Shingle roof; Stone foundation; Built with mixed flooring materials
- Exterior features: Patio; Porch; Storage building; Workshop
Interior
- Kitchen: Gas range; Refrigerator; Dishwasher
- Flooring: Carpet; Concrete; Vinyl; Wood
- Bathrooms: 1 full bathroom
- Heating & cooling: Central heating; Forced air; Ceiling fans for cooling; Attic fan
- Interior features: Ceiling fans; Eat-in kitchen; Unfinished basement with sump pump; 9 total rooms
Neighborhood map
What this means for you Summary
Snapshot
- This is a 3-bed/1.0-bath single-family listed at $125k. Condition is rated fair.
Deal economics
- At list price, monthly cash flow is $108 ($1k/yr) — positive.
- The deal already cash-flows at list — no discount required.
- To meet the 1% rule (rent ≥ 1% of price), the offer needs to be $123k (1.6% below list).
- Recommended offer: $121k (3.0% below list) — sets the bar for market timing.
Location & tenants
- Location reads 65/100 on livability (#284 in MO) — a middle-class / working-renter tenant base. Strengths: cost of living A+, housing B; Watch: amenities F, commute F, employment F.
- Lamar R-I (town): math 37% / reading 37% proficiency, ranked #196 of 324 in MO (top 60%) — families likely to look elsewhere, expect single-tenant / working-renter base with shorter leases.
- Zoned schools: Lamar Elem. (math 40% / reading 35%, grade F, #607 of 1,115 statewide, top 55%, 268 students, 54% FRL); Lamar Middle (math 39% / reading 37%, grade F, #211 of 391 statewide, top 55%, 266 students, 53% FRL).
- Market conditions: 62 active listings in the ZIP; 6 units permitted in Barton County in 2024 (0 in 5+ unit buildings).
Forward outlook
- Local home prices are declining (-3.0%/yr); year-one equity from $864 of loan paydown is wiped out by about $4k of value loss. Plan a longer hold.
- Barton County population projected at -21% by 2050 — secular population decline; favor cash flow + early exit over multi-decade hold.
Negotiation context
- It's been on market 49 days — a 3% lower offer ($121k) is reasonable based on typical stale-listing flexibility.
Risks & watch-outs
- Watch-outs: built in 1900 — expect roof / HVAC / electrical / plumbing capex.
Questions for the listing agent
- It's been on market 49 days. Have you received any prior offers? Is the seller open to a 3% concession, seller financing, or rate buy-down credit?
- Have any recent inspections been done? Can we get a copy of the seller's disclosures and any deferred-maintenance estimates?
- Built in 1900 — when were the roof, HVAC, electrical panel, plumbing, and water heater last replaced?
- Is there a deadline driving the sale (1031 exchange, divorce, estate, relocation)? That informs how much negotiation room exists.
- Schools are D-rated, which usually means shorter tenancies and higher turnover. Who's the typical renter profile here, and what's been the actual vacancy rate?
- What's the average days-on-market for RENTAL listings here right now (not sales)? A rising rental-DOM trend means longer vacancies and softer asking-rent achievability than the comps imply.
- What's the recent tenant-quality profile in this submarket — average credit score on applications, eviction rate, late-payment / NSF rate, and stable-employment percentage? A property-management company in the area should have these aggregated.
- How much new for-sale + rental construction is in the pipeline within 1–3 miles? Heavy new supply typically softens prices + rents 12–24 months out; constrained supply supports both.
Investment metrics
- 1% rule
- 0.98% ✗
- Cap rate
- 7.33%
- Cash-on-cash
- 3.70%
- DSCR
- 1.16
- GRM
- 8.5
CMA / ARV
- ARV (median comp)
- $162,995
- List price
- $124,900
- Delta
- -23.37%
- Verdict
- UNDERPRICED
- Comps
- 15 within 1.0 mi
Show comp detail 4 sales within ~0.75 mi
| Address | Dist | Beds/Ba | Sqft | Sold | Price | $/sf | Match |
|---|---|---|---|---|---|---|---|
| 1807 Heagon St | 0.15mi | 2/1.5 (-1) | 1,625 (-6%) | 1mo | $134,900 | $83 | 75 |
| 1206 E 18th St | 0.33mi | 3/2.0 | 1,728 (0%) | 22mo | $229,990 | $133 | 63 |
| 1302 E 18th St | 0.42mi | 3/2.0 | 1,693 (-2%) | 23mo | $245,000 | $145 | 54 |
| 1700 Crestwood Dr | 0.51mi | 3/2.0 | 1,888 (+9%) | 21mo | $245,000 | $130 | 39 |
Match score weights: distance 35% · size 25% · config 20% · recency 20%. Top-matched comps best support the ARV.
Projected returns pro-forma
-3.0% appreciation · 3.0% rent growth · sell at horizon
- IRR
- -10.5%
- Equity multiple
- 0.62×
- Total profit
- $-13,357
- Equity at exit
- $18,623
- IRR
- -1.1%
- Equity multiple
- 0.92×
- Total profit
- $-2,717
- Equity at exit
- $10,799
Cash invested: $34,972 (down + closing). Projections, not guarantees.
Landlord ↔ Tenant lean methodology
- Overall (STATE)
- 81 Strongly Landlord-Friendly
- State Missouri
- 81 Strongly Landlord-Friendly · R+10
- County
- — inherits STATE
- City
- — inherits STATE
ZIP-level market 64759
- Home prices YoY
- -10.4%
- Active inventory
- 62
- Price-to-rent
- 8.5×
Monthly cashflow live
- Estimated rent
- $1,229 medium interval (Pro) →
- Mortgage (P&I)
- −$655
- Tax est. 1.5%
- −$156 /mo · $1,874/yr
- Insurance
- −$52
- HOA
- −$0
- Vacancy / Maint / Mgmt
- −$258
- Net cashflow
- $108
Break-even live
UW: 25.0% down · 7.5% · 30yr · 1.5% tax · 5.0% vac · 8.0% maint · 8.0% mgmt
Financing live
Cash to close
- Down payment
- $31,225
- Closing costs
- $3,747
- Reserves months
- —
- Total cash needed
- —
Loan-product check · same deal, 3 products live
Conventional
25% down · 7.5% · 30yr
- Down + closing
- —
- Monthly P&I
- —
- Monthly cashflow
- —
- DSCR
- —
- Eligible?
- —
Personal DTI + credit; lowest rate.
DSCR
20% down · 8.5% · 30yr
- Down + closing
- —
- Monthly P&I
- —
- Monthly cashflow
- —
- DSCR
- —
- Eligible?
- —
No personal income docs; deal must DSCR.
Hard money
10% down · 12.0% · 12mo
- Down + closing
- —
- Monthly P&I
- —
- Monthly cashflow
- —
- DSCR
- —
- Eligible?
- —
Short-term bridge; refi at stabilization.
Listing history 15 events
-
2026-06-18days on market $124,900 Active 49 DOM
-
2026-06-17days on market $124,900 Active 48 DOM
-
2026-06-16days on market $124,900 Active 47 DOM
-
2026-06-15days on market $124,900 Active 46 DOM
-
2026-06-13days on market $124,900 Active 44 DOM
-
2026-06-12days on market $124,900 Active 43 DOM
-
2026-06-09days on market $124,900 Active 40 DOM
-
2026-06-08days on market $124,900 Active 39 DOM
-
2026-06-07days on market $124,900 Active 38 DOM
-
2026-06-07days on market $124,900 Active 37 DOM
-
2026-06-04days on market $124,900 Active 34 DOM
-
2026-06-02days on market $124,900 Active 33 DOM
-
2026-06-01days on market $124,900 Active 32 DOM
-
2026-05-31days on market $124,900 Active 31 DOM
-
2026-04-28$124,900 Active 753-char remark
ⓘ Source: listings_history table (triggers on properties + properties_extension) + one-shot
backfill from property_details.listing_events for pre-trigger history.
Nearby sold comps map
Loading sold comps map…
Walkable amenities ~0.75 mi
Loading nearby amenities…
Taxation est. · year 1
- Rental income
- $14,748
- − Mortgage interest
- −$6,996
- − Property taxes
- −$1,874
- − Insurance
- −$624
- − Repairs & maintenance
- −$1,180
- − Management
- −$1,180
- − Depreciation
- −$3,633
- Taxable loss
- −$739
- Est. tax savings @ 24.0%
- +$177
- After-tax cash flow
- $1,471/yr
For passive investors: Depreciation is non-cash, so a rental often shows a tax loss while cash-flowing — sheltering income. Rental losses are passive: they offset passive income freely, and up to $25,000/yr can offset ordinary (W-2) income if you actively participate and your MAGI is under $100k (phasing out to $0 by $150k); unused losses carry forward. On sale, claimed depreciation is recaptured at up to 25%, and gains may owe capital-gains tax (a 1031 exchange can defer both). Figures are a year-1 estimate at your 24.0% rate — not tax advice; consult a CPA.
Condition & rehab AI · 13 photos
The home requires moderate renovations to improve its condition and increase its value. Key areas for improvement include the kitchen, flooring, and exterior. Landscaping and painting will also enhance the property's curb appeal and overall value.
Repairs flagged
- Moderate kitchen cabinets — dated and worn
- Major kitchen flooring — severely worn carpet
- Moderate exterior siding — visible wear
- Major landscaping — overgrown lawn and trees
Value-add opportunities
- Resale new kitchen cabinets — modernizing the kitchen
- Resale new flooring — improves aesthetics and functionality
- Both landscaping — enhances curb appeal and property value
Renovation cost estimate screening
| Repair item | Severity | Est. cost |
|---|---|---|
| kitchen cabinets · dated and worn | Moderate | $3,000–15,000 |
| kitchen flooring · severely worn carpet | Major | $15,000–50,000 |
| exterior siding · visible wear | Moderate | $3,000–15,000 |
| landscaping · overgrown lawn and trees | Major | $15,000–50,000 |
| Total estimated repair cost · 4 items | $36,000–130,000 |
Value-add ROI direction
- Resale new kitchen cabinets — modernizing the kitchen ↑
- Resale new flooring — improves aesthetics and functionality ↑
- Both landscaping — enhances curb appeal and property value ↑
ⓘ Cost ranges are severity-bucket heuristics (US national rule-of-thumb). Get contractor quotes + a written scope before underwriting a rehab budget.
Schools (NCES district)
- District
- Lamar R-I
- NCES district ID
- 2917850
- Math proficiency
- 37% ▼ -4.00%
- Reading proficiency
- 37% ▼ -4.00%
- Median HH income
- $40,598
- Composite
- 31.12/100
- National rank
- #6066
- State rank
- #196 of 324 in MO
Livability — Lamar
- Score
- 65/100
- State rank
- #284
- US rank
- #13227
Category grades
Schools grade is shown separately in the Schools card above.
Census & demographics
- Census place
- Lamar, MO
- Population (ZIP)
- 8,056
Population outlook (Barton County) Hauer SSP2
- Today (2025)
- 10,977 people
- By 2030
- 10,496 · -4.4%
- By 2040
- 9,537 · -13.1%
- By 2050
- 8,668 · -21.0%
- By 2075
- 7,557 · -31.2%
- By 2100
- 6,921 · -36.9%
Race, ethnicity, and origin ACS 2023
- Neighborhood character
- Predominantly White (93%)
- Race & ethnicity
- White 93% Two or more races 4% Hispanic / Latino 3%
- Common ancestry
- Italian 4% Slovak 2% Lithuanian 2%
- Foreign-born
- 0% · Canada, Guatemala
- Languages at home
- 95% English-only · German/W. Germanic 4% Spanish 1%
Political lean MEDSL · Barton
- 2024 margin
- Solid R (+72.2) · D 13.6% · R 85.8%
- 2008→2024 swing
- -22.4pp toward R · 2008: -49.8pp · 2024: -72.2pp
- All cycles
- 2024: R+72.2 2020: R+71.2 2016: R+70.2 2012: R+55.4 2008: R+49.8
Not yet ingested
- Civics
- —
Market trends
- HPI YoY
- ▼ -18.73%
- Current HPI
- 160.9202
- Rent YoY
- —
- Metro
- —
- State GDP YoY
- ▲ 1.84%
- F500 in state
- 20
Industry mix (Fortune 500 HQ in MO)
| Industry | F500 HQs | Revenue |
|---|---|---|
| Healthcare | 1 | $163B |
|
||
| Insurance | 1 | $21B |
|
||
| Industrial Technology | 1 | $17B |
|
||
| Retail | 1 | $16B |
|
||
| Industrial Distribution | 1 | $10B |
|
||
| Utilities | 1 | $9B |
|
||
Price history
1 event — show timeline
- 2026-04-28 Listed $124,900 OGAR
Cash-flow waterfall
monthlySold comps — $/sqft
last 12 mo · ≤1 miLoading sold comps…