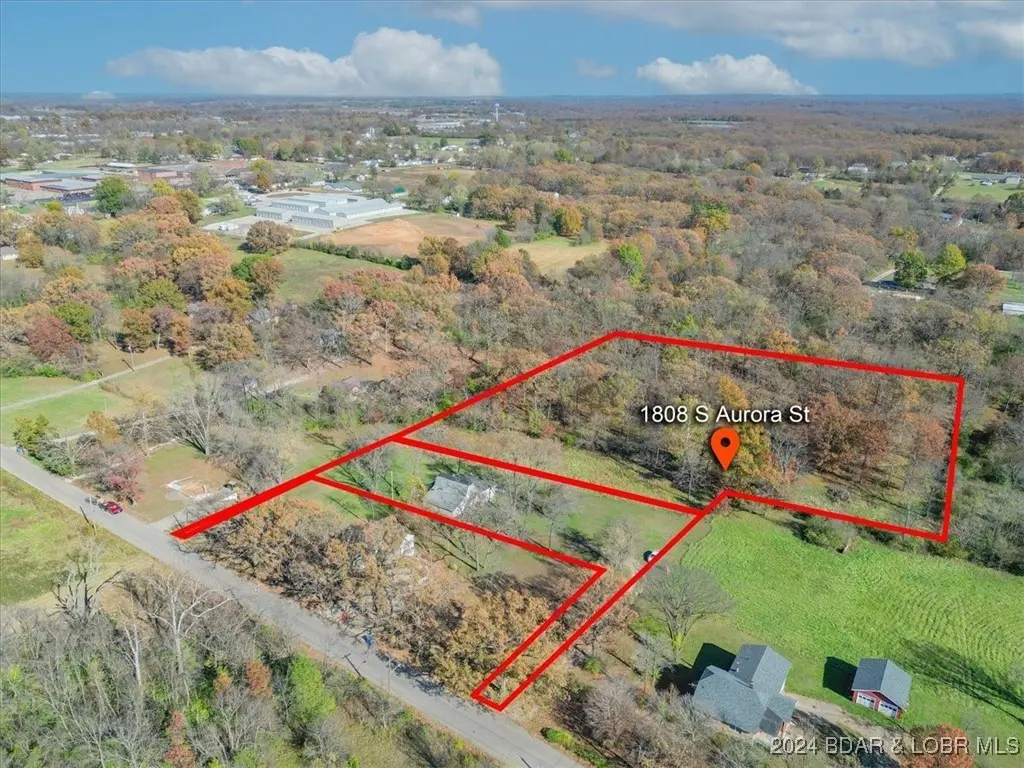
1808 Aurora St S · Eldon, MO
Flood risk 8/10 · Major
- FEMA flood zone
- X (unshaded)
- Chance of flooding over 30 yrs
- 0.99%
- Est. flood insurance / yr
- $473 – $860
Fire risk 4/10 · Minor
- Est. fire insurance / yr
- $1,054 – $1,958
Heat risk 4/10 · Minor
- Hot days now (above 108°F)
- 7 days/yr
- Hot days in 30 yrs
- 19 days/yr
Wind risk 2/10 · Minimal
- Chance of severe wind over 30 yrs
- —
Air-quality risk 1/10 · Minimal
- Unhealthy air days now
- 0 days/yr
- Unhealthy air days in 30 yrs
- 0 days/yr
Risk factors via First Street. Map © Google.
Why this score? — see what drove the C- grade
The composite is a weighted blend of 9 inputs, each scored 0–100. Each bar is that input's sub-score; the figure is the points it added to the 100-point composite (weight × sub-score).
- ARV discount +15.0/15.0
- Cash flow +10.5/30.0
- Appreciation +10.0/10.0
- Schools +4.1/10.0
- Livability +3.3/5.0
- DSCR +3.0/10.0
- Rent growth +2.5/5.0
- Condition / age +2.5/5.0
- 1% rule +1.9/10.0
$145,000
🖨 Deal sheet (PDF) 📄 Offer letter ✓ Due diligence
Listing remarks
INVESTOR, HOMESTEADER & HOBBY FARMER ALERT in the Eldon School District! 4.48, private & fenced acres with diamond in the rough single family home that had been converted from a barn is available for the first time in over 30 years. Home & . 480 acres in Eldon City Limits with city sewer & water. 4 fenced acres out of city limits with lean to barn for your livestock of choice to get respite from weather. Easements for city water & sewer follow the driveway & wet weather creek through acreage & would be ideal to annex into City Limits for developers. Home is being sold AS IS but used as a lucrative rental in years past. A little bit of elbow grease
Key facts
- Lean to barn
- Wet weather creek
- Private fenced acres
Tags
Property features AI
Finance
- Other: Approximately 4.48-acre lot (irregular shape) with sloped, gently sloping, wooded and open areas; city lot with road maintenance agreement; asphalt/gravel/paved access; Additional structures include workshop and shed(s); Possible uses listed include residential, commercial, development, farm, industrial, multi-family, and other
Exterior
- Parking: Open parking; No garage; Gravel parking; Workshop in garage area; 1 garage space (workshop present)
- Utilities: Public water; Public sewer
- Home design: Single family detached residence; Two levels; Fixer condition
- Construction: Masonite exterior; Block and slab foundation; Built on two levels
- Exterior features: Storage; Other exterior features; Cross-fenced lot
Interior
- Kitchen: Cooktop; Dishwasher; Oven; Range; Refrigerator
- Bathrooms: 1 full bathroom; 1 half bathroom
- Heating & cooling: Propane heating; Radiant heating; Central air conditioning; Ceiling fans
- Interior features: Ceiling fans
Neighborhood map
What this means for you Summary
Snapshot
- This is a 2-bed/1.5-bath other listed at $145k.
Deal economics
- At list price, monthly cash flow is $-131 ($-2k/yr) — negative.
- To cash-flow at today's rent, offer at most $122k (15.9% below list).
- To meet the 1% rule (rent ≥ 1% of price), the offer needs to be $99k (31.4% below list).
- Recommended offer: $99k (31.4% below list) — sets the bar for 1% rule.
Location & tenants
- Location reads 66/100 on livability (#249 in MO) — a middle-class / working-renter tenant base. Strengths: cost of living A+, housing A+, crime B+; Watch: employment D, amenities F, commute F.
- Eldon R-I (town): math 46% / reading 54% proficiency, ranked #52 of 324 in MO (top 16%) — acceptable for families but not a draw, mixed tenant base, ~2y average lease.
- Zoned schools: South Elem. (math 42% / reading 42%, grade F, #481 of 1,115 statewide, top 46%, 566 students, 50% FRL); Eldon Middle (math 45% / reading 56%, grade C, #64 of 391 statewide, top 17%, 423 students, 49% FRL); Eldon High (math 37% / reading 62%, grade D, #124 of 521 statewide, top 28%, 584 students, 40% FRL).
- Market conditions: 106 active listings in the ZIP; 88 units permitted in Miller County in 2024 (31 in 5+ unit buildings).
Forward outlook
- In year one you build about $16k of equity ($1k loan paydown + $14k appreciation (10.0% local appreciation)).
- Miller County population projected to shrink 8% by 2050 — rents likely to lag national; underwrite the cash flow, not the appreciation.
- By year 3, paydown + projected appreciation supports a ~$39k cash-out refi (75% LTV) — recoverable capital for the next deal without selling this one.
Negotiation context
- It's been on market 16 days — a 2% lower offer ($143k) is reasonable based on typical stale-listing flexibility.
Risks & watch-outs
- Watch-outs: flood insurance adds $56/mo.
- Climate carrying-cost: severe flood risk — expect insurance premiums to compound above CPI over the hold.
Questions for the listing agent
- What do current leases actually rent for vs. the listed asking? Can we see a recent rent roll and the last 12 months of T-12 income?
- Built in 1975 — when were the roof, HVAC, electrical panel, plumbing, and water heater last replaced?
- What's the actual annual flood-insurance premium (NFIP or private), and is the property in a SFHA with mandatory coverage?
- Is there a deadline driving the sale (1031 exchange, divorce, estate, relocation)? That informs how much negotiation room exists.
- What's the average days-on-market for RENTAL listings here right now (not sales)? A rising rental-DOM trend means longer vacancies and softer asking-rent achievability than the comps imply.
- What's the recent tenant-quality profile in this submarket — average credit score on applications, eviction rate, late-payment / NSF rate, and stable-employment percentage? A property-management company in the area should have these aggregated.
- How much new for-sale + rental construction is in the pipeline within 1–3 miles? Heavy new supply typically softens prices + rents 12–24 months out; constrained supply supports both.
Investment metrics
- 1% rule
- 0.69% ✗
- Cap rate
- 5.67%
- Cash-on-cash
- -2.23%
- DSCR
- 0.90
- GRM
- 12.1
CMA / ARV
- ARV (median comp)
- $192,368
- List price
- $145,000
- Delta
- -24.62%
- Verdict
- UNDERPRICED
- Comps
- 5 within 2.0 mi
Projected returns pro-forma
10.0% appreciation · 3.0% rent growth · sell at horizon
- IRR
- 21.5%
- Equity multiple
- 2.74×
- Total profit
- $70,597
- Equity at exit
- $130,627
- IRR
- 19.4%
- Equity multiple
- 6.28×
- Total profit
- $214,378
- Equity at exit
- $281,703
Cash invested: $40,600 (down + closing). Projections, not guarantees.
Landlord ↔ Tenant lean methodology
- Overall (STATE)
- 81 Strongly Landlord-Friendly
- State Missouri
- 81 Strongly Landlord-Friendly · R+10
- County
- — inherits STATE
- City
- — inherits STATE
ZIP-level market 65026
- Home prices YoY
- 5.3%
- Active inventory
- 106
- Price-to-rent
- 12.1×
Monthly cashflow live
- Estimated rent
- $995 medium interval (Pro) →
- Mortgage (P&I)
- −$760
- Tax from tax record
- −$40 /mo · $486/yr
- Insurance
- −$60
- Flood insurance flood zone
- −$56 /mo · $666/yr
- HOA
- −$0
- Vacancy / Maint / Mgmt
- −$209
- Net cashflow
- $-131
Break-even live
Sensitivity live
| Price | -10% $-49 | -5% $-90 | +0% $-131 | +5% $-172 | +10% $-213 |
|---|---|---|---|---|---|
| Rent | -10% $-209 | -5% $-170 | +0% $-131 | +5% $-92 | +10% $-52 |
| Rate | -1.0pp $-58 | -0.5pp $-94 | base $-131 | +0.5pp $-168 | +1.0pp $-207 |
UW: 25.0% down · 7.5% · 30yr · 1.5% tax · 5.0% vac · 8.0% maint · 8.0% mgmt
Financing live
Cash to close
- Down payment
- $36,250
- Closing costs
- $4,350
- Reserves months
- —
- Total cash needed
- —
Loan-product check · same deal, 3 products live
Conventional
25% down · 7.5% · 30yr
- Down + closing
- —
- Monthly P&I
- —
- Monthly cashflow
- —
- DSCR
- —
- Eligible?
- —
Personal DTI + credit; lowest rate.
DSCR
20% down · 8.5% · 30yr
- Down + closing
- —
- Monthly P&I
- —
- Monthly cashflow
- —
- DSCR
- —
- Eligible?
- —
No personal income docs; deal must DSCR.
Hard money
10% down · 12.0% · 12mo
- Down + closing
- —
- Monthly P&I
- —
- Monthly cashflow
- —
- DSCR
- —
- Eligible?
- —
Short-term bridge; refi at stabilization.
Listing history 20 events
-
2026-06-21days on market $145,000 Active 16 DOM
-
2026-06-21days on market $145,000 Active 15 DOM
-
2026-06-18days on market $145,000 Active 13 DOM
-
2026-06-17days on market $145,000 Active 12 DOM
-
2026-06-16days on market $145,000 Active 11 DOM
-
2026-06-15days on market $145,000 Active 10 DOM
-
2026-06-13days on market $145,000 Active 8 DOM
-
2026-06-12days on market $145,000 Active 7 DOM
-
2026-06-09days on market $145,000 Active 4 DOM
-
2026-06-08days on market $145,000 Active 3 DOM
-
2026-06-07days on market $145,000 Active 2 DOM
-
2026-06-07days on market $145,000 Active 1 DOM
-
2026-06-01days on market $145,000 Active 526 DOM
-
2026-05-31days on market $145,000 Active 525 DOM
-
2025-11-07price $150,000 1113-char remark
-
2025-11-06status Active 1113-char remark
-
2025-11-04historical 1113-char remark
-
2025-06-03price $185,000 1113-char remark
-
2025-04-09price $195,000 1113-char remark
-
2024-12-20$200,000 Active 1113-char remark
ⓘ Source: listings_history table (triggers on properties + properties_extension) + one-shot
backfill from property_details.listing_events for pre-trigger history.
Tax reassessment forecast MO · Resets to sale price
- Current annual tax
- $486 · $40/mo
- Projected year-2 tax
- $1,406 · $117/mo
- Expected delta
- +$921/yr (+$77/mo · 189.5%)
ⓘ Screening estimate from a state-policy table — verify with the county assessor before closing.
Climate risk First Street
- Flood 8/10 Severe FEMA zone X (unshaded) · 99% chance over 30 yrs
- Wildfire 4/10 Moderate
- Heat 4/10 Moderate 7 d/yr ≥108°F today · 19 d/yr by 30 yrs out
- Wind 2/10 Low
- Air quality 1/10 Low 0 unhealthy d/yr today · 0 by 30 yrs out
Nearby sold comps map
Loading sold comps map…
Walkable amenities ~0.75 mi
Loading nearby amenities…
Taxation est. · year 1
- Rental income
- $11,939
- − Mortgage interest
- −$8,122
- − Property taxes
- −$486
- − Insurance
- −$1,392
- − Repairs & maintenance
- −$955
- − Management
- −$955
- − Depreciation
- −$4,218
- Taxable loss
- −$4,189
- Est. tax savings @ 24.0%
- +$1,005
- After-tax cash flow
- $-565/yr
For passive investors: Depreciation is non-cash, so a rental often shows a tax loss while cash-flowing — sheltering income. Rental losses are passive: they offset passive income freely, and up to $25,000/yr can offset ordinary (W-2) income if you actively participate and your MAGI is under $100k (phasing out to $0 by $150k); unused losses carry forward. On sale, claimed depreciation is recaptured at up to 25%, and gains may owe capital-gains tax (a 1031 exchange can defer both). Figures are a year-1 estimate at your 24.0% rate — not tax advice; consult a CPA.
Schools (NCES district)
- District
- Eldon R-I
- NCES district ID
- 2911340
- Math proficiency
- 46% ▼ -2.00%
- Reading proficiency
- 54% ▼ -2.00%
- Median HH income
- $34,415
- Composite
- 41.27/100
- National rank
- #3521
- State rank
- #52 of 324 in MO
Livability — Eldon
- Score
- 66/100
- State rank
- #249
- US rank
- #12203
Category grades
Schools grade is shown separately in the Schools card above.
Census & demographics
- Population (ZIP)
- 11,648
Population outlook (Miller County) Hauer SSP2
- Today (2025)
- 25,396 people
- By 2030
- 25,344 · -0.2%
- By 2040
- 24,740 · -2.6%
- By 2050
- 23,415 · -7.8%
- By 2075
- 19,426 · -23.5%
- By 2100
- 13,742 · -45.9%
Race, ethnicity, and origin ACS 2023
- Neighborhood character
- Predominantly White (94%)
- Race & ethnicity
- White 94% Two or more races 2% Hispanic / Latino 2%
- Common ancestry
- Slovak 4% Italian 2% Romanian 1%
- Foreign-born
- 1% · China, Canada
- Languages at home
- 95% English-only · Spanish 2% French/Haitian/Cajun 2%
Political lean MEDSL · Miller
- 2024 margin
- Solid R (+67.3) · D 15.9% · R 83.2%
- 2008→2024 swing
- -30.5pp toward R · 2008: -36.8pp · 2024: -67.3pp
- All cycles
- 2024: R+67.3 2020: R+65.7 2016: R+66.0 2012: R+49.4 2008: R+36.8
Not yet ingested
- Civics
- —
Market trends
- HPI YoY
- ▲ 20.13%
- Current HPI
- 400.83
- Rent YoY
- —
- Metro
- —
- State GDP YoY
- ▲ 1.84%
- F500 in state
- 20
Industry mix (Fortune 500 HQ in MO)
| Industry | F500 HQs | Revenue |
|---|---|---|
| Healthcare | 1 | $163B |
|
||
| Insurance | 1 | $21B |
|
||
| Industrial Technology | 1 | $17B |
|
||
| Retail | 1 | $16B |
|
||
| Industrial Distribution | 1 | $10B |
|
||
| Utilities | 1 | $9B |
|
||
Price history
-25.6% since first listed5 events — show timeline
- 2026-06-05 Listed $145,000 LOBR
- 2026-05-22 Price Changed $145,000 LOBR
- 2025-11-07 Price Changed $150,000 LOBR
- 2025-06-03 Price Changed $185,000 LOBR
- 2025-04-09 Price Changed $195,000 LOBR
Property tax history
+3.5%/yrLatest (2025): $486 · +9.5% YoY. Source: county tax records.
Cash-flow waterfall
monthlySold comps — $/sqft
last 12 mo · ≤1 miLoading sold comps…