 🏗️ New Construction
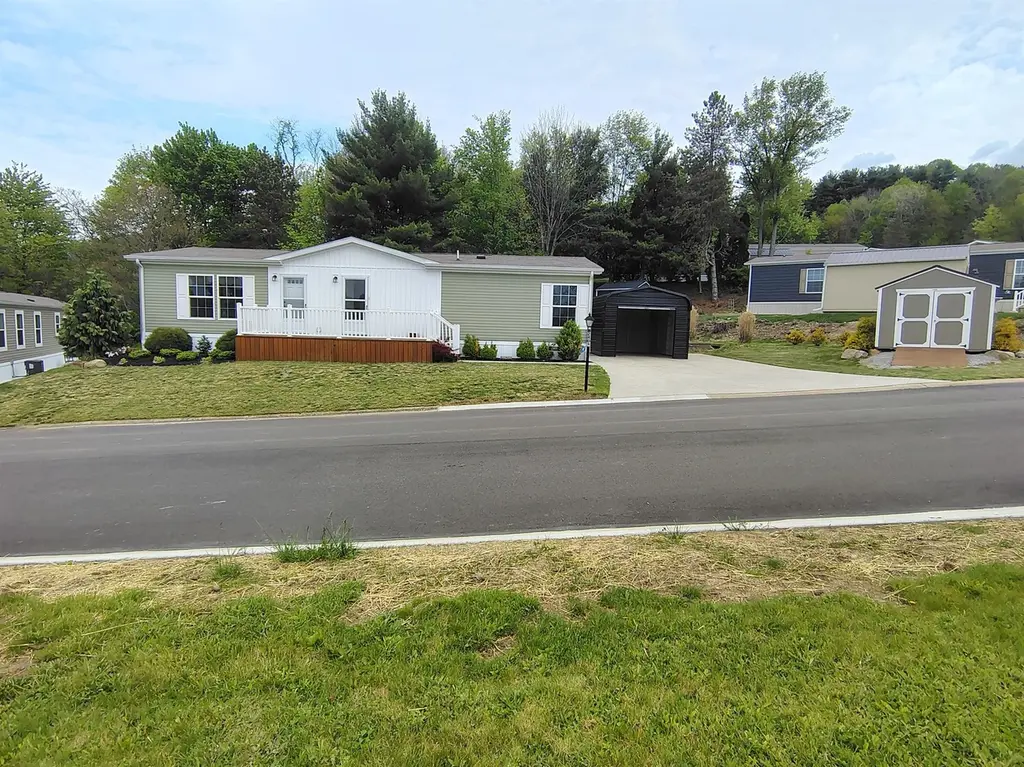
Skyline 32 Fohl Village Plan · North Industry, OH
Flood risk No data
- FEMA flood zone
- —
- Chance of flooding over 30 yrs
- —
- Est. flood insurance / yr
- —
Fire risk No data
- Est. fire insurance / yr
- —
Heat risk No data
- Hot days now (above threshold)
- —
- Hot days in 30 yrs
- —
Wind risk No data
- Chance of severe wind over 30 yrs
- —
Air-quality risk No data
- Unhealthy air days now
- —
- Unhealthy air days in 30 yrs
- —
Risk factors via First Street. Map © Google.
Why this score? — see what drove the D grade
The composite is a weighted blend of 9 inputs, each scored 0–100. Each bar is that input's sub-score; the figure is the points it added to the 100-point composite (weight × sub-score).
- Cash flow +14.8/30.0
- ARV discount +7.5/15.0
- DSCR +4.5/10.0
- Schools +4.5/10.0
- 1% rule +4.1/10.0
- Condition / age +4.0/5.0
- Rent growth +2.5/5.0
- Livability +2.5/5.0
- Appreciation +0.0/10.0
$149,900
🖨 Deal sheet (PDF) 📄 Offer letter ✓ Due diligence
Listing remarks
Take the tour! This lovely 2021 Skyline 3-bed, 2-bath double wide home at Fohl Village is fully equipped with an open-concept living room, a beautiful open kitchen with wood cbinets, a full kitchen appliance package, a kitchen island, a hot water heater, included washer and dryer, a deck, a storage shed, and a garage. This home is loccated on a beautiful front facing lot. Community amenities include the clubhouse, swimming pool, and playground.
Key facts
- Deck
- Kitchen island
- Open kitchen
Tags
Property features AI
Finance
- Financial info: List price $149,900
Exterior
- Utilities: Electric heating; Central air conditioning
- Home design: Plan: Skyline 32 Fohl Village; Inventory type: Plan; Active status
- Construction: Living area: 1417
- Exterior features: Shake roof
Interior
- Bedrooms: 3 bedrooms
- Bathrooms: 2 full bathrooms
- Heating & cooling: Electric heating; Central air conditioning
- Interior features: 2 total bathrooms
Neighborhood map
What this means for you Summary
Snapshot
- This is a 3-bed/2.0-bath manufactured listed at $150k. Condition is rated good.
Deal economics
- At list price, monthly cash flow is $41 ($489/yr) — positive.
- The deal already cash-flows at list — no discount required.
- To meet the 1% rule (rent ≥ 1% of price), the offer needs to be $136k (9.1% below list).
- Recommended offer: $136k (9.1% below list) — sets the bar for 1% rule.
Location & tenants
- Location reads: area grade D — affects rentability + tenant quality, not the cash-flow math above.
- Canton Local (suburban): math 54% / reading 52% proficiency, ranked #401 of 656 in OH (top 61%) — acceptable for families but not a draw, mixed tenant base, ~2y average lease.
- Zoned schools: Faircrest Memorial Elementary School (math 65% / reading 56%, grade B-, #657 of 1,584 statewide, top 42%, 765 students, 0% FRL); Canton South Middle School (math 56% / reading 51%, grade C+, #362 of 654 statewide, top 57%, 391 students, 0% FRL); Canton South High School (math 32% / reading 52%, grade F, #497 of 781 statewide, top 66%, 815 students, 41% FRL) — zoned schools average 14% FRL vs 50% district-wide (36 pts lower); this property's tenant base skews higher-income than the district average.
- Market conditions: 91 active listings in the ZIP; 528 units permitted in Stark County in 2024 (84 in 5+ unit buildings).
Forward outlook
- Local home prices are declining (-3.0%/yr); year-one equity from $1k of loan paydown is wiped out by about $4k of value loss. Plan a longer hold.
- Stark County population projected to shrink 8% by 2050 — rents likely to lag national; underwrite the cash flow, not the appreciation.
Negotiation context
- It's been on market 22 days — a 2% lower offer ($148k) is reasonable based on typical stale-listing flexibility.
Questions for the listing agent
- Is there a deadline driving the sale (1031 exchange, divorce, estate, relocation)? That informs how much negotiation room exists.
- The area grade is low — what's the realistic commute time and amenity access for the typical tenant pool here? Any planned neighborhood developments (good or bad) we should know about?
- What's the average days-on-market for RENTAL listings here right now (not sales)? A rising rental-DOM trend means longer vacancies and softer asking-rent achievability than the comps imply.
- What's the recent tenant-quality profile in this submarket — average credit score on applications, eviction rate, late-payment / NSF rate, and stable-employment percentage? A property-management company in the area should have these aggregated.
- How much new for-sale + rental construction is in the pipeline within 1–3 miles? Heavy new supply typically softens prices + rents 12–24 months out; constrained supply supports both.
Investment metrics
- 1% rule
- 0.91% ✗
- Cap rate
- 6.62%
- Cash-on-cash
- 1.16%
- DSCR
- 1.05
- GRM
- 9.2
CMA / ARV
No comps found within radius.
Projected returns pro-forma
-3.0% appreciation · 3.0% rent growth · sell at horizon
- IRR
- -14.4%
- Equity multiple
- 0.48×
- Total profit
- $-21,676
- Equity at exit
- $22,351
- IRR
- -5.7%
- Equity multiple
- 0.63×
- Total profit
- $-15,451
- Equity at exit
- $12,961
Cash invested: $41,972 (down + closing). Projections, not guarantees.
Landlord ↔ Tenant lean methodology
- Overall (STATE)
- 73 Landlord-Friendly
- State Ohio
- 73 Landlord-Friendly · R+6
- County
- — inherits STATE
- City
- — inherits STATE
ZIP-level market 44706
- Active inventory
- 91
- Price-to-rent
- 9.2×
Monthly cashflow live
- Estimated rent
- $1,363 medium interval (Pro) →
- Mortgage (P&I)
- −$786
- Tax est. 1.5%
- −$187 /mo · $2,248/yr
- Insurance
- −$62
- HOA
- −$0
- Vacancy / Maint / Mgmt
- −$286
- Net cashflow
- $41
Break-even live
Sensitivity live
| Price | -10% $144 | -5% $93 | +0% $41 | +5% $-11 | +10% $-63 |
|---|---|---|---|---|---|
| Rent | -10% $-67 | -5% $-13 | +0% $41 | +5% $95 | +10% $148 |
| Rate | -1.0pp $116 | -0.5pp $79 | base $41 | +0.5pp $2 | +1.0pp $-38 |
UW: 25.0% down · 7.5% · 30yr · 1.5% tax · 5.0% vac · 8.0% maint · 8.0% mgmt
Financing live
Cash to close
- Down payment
- $37,475
- Closing costs
- $4,497
- Reserves months
- —
- Total cash needed
- —
Loan-product check · same deal, 3 products live
Conventional
25% down · 7.5% · 30yr
- Down + closing
- —
- Monthly P&I
- —
- Monthly cashflow
- —
- DSCR
- —
- Eligible?
- —
Personal DTI + credit; lowest rate.
DSCR
20% down · 8.5% · 30yr
- Down + closing
- —
- Monthly P&I
- —
- Monthly cashflow
- —
- DSCR
- —
- Eligible?
- —
No personal income docs; deal must DSCR.
Hard money
10% down · 12.0% · 12mo
- Down + closing
- —
- Monthly P&I
- —
- Monthly cashflow
- —
- DSCR
- —
- Eligible?
- —
Short-term bridge; refi at stabilization.
Listing history 14 events
-
2026-06-22days on market $149,900 Active 22 DOM
-
2026-06-18days on market $149,900 Active 19 DOM
-
2026-06-17days on market $149,900 Active 18 DOM
-
2026-06-16days on market $149,900 Active 17 DOM
-
2026-06-15days on market $149,900 Active 16 DOM
-
2026-06-14days on market $149,900 Active 14 DOM
-
2026-06-13days on market $149,900 Active 13 DOM
-
2026-06-10days on market $149,900 Active 11 DOM
-
2026-06-09days on market $149,900 Active 10 DOM
-
2026-06-08days on market $149,900 Active 9 DOM
-
2026-06-07days on market $149,900 Active 8 DOM
-
2026-06-03days on market $149,900 Active 4 DOM
-
2026-06-03remarks 448-char remark
-
2026-06-03$149,900 Active 3 DOM
ⓘ Source: listings_history table (triggers on properties + properties_extension) + one-shot
backfill from property_details.listing_events for pre-trigger history.
Nearby sold comps map
Loading sold comps map…
Walkable amenities ~0.75 mi
Loading nearby amenities…
Taxation est. · year 1
- Rental income
- $16,354
- − Mortgage interest
- −$8,397
- − Property taxes
- −$2,248
- − Insurance
- −$750
- − Repairs & maintenance
- −$1,308
- − Management
- −$1,308
- − Depreciation
- −$4,361
- Taxable loss
- −$2,018
- Est. tax savings @ 24.0%
- +$484
- After-tax cash flow
- $973/yr
For passive investors: Depreciation is non-cash, so a rental often shows a tax loss while cash-flowing — sheltering income. Rental losses are passive: they offset passive income freely, and up to $25,000/yr can offset ordinary (W-2) income if you actively participate and your MAGI is under $100k (phasing out to $0 by $150k); unused losses carry forward. On sale, claimed depreciation is recaptured at up to 25%, and gains may owe capital-gains tax (a 1031 exchange can defer both). Figures are a year-1 estimate at your 24.0% rate — not tax advice; consult a CPA.
Condition & rehab AI · 12 photos
This 2021 Skyline 3-bedroom, 2-bath double-wide home is in excellent condition with a good condition score of 80. It features a modern kitchen, good exterior, and neutral paint. The home is located on a beautiful front-facing lot with community amenities. The highest-ROI updates would be painting the exterior siding and updating the flooring in the bathrooms.
Value-add opportunities
- Resale paint exterior siding — enhances curb appeal and value
- Both update flooring in bathrooms — improves aesthetics and functionality
- Both install smart home features — attracts tech-savvy buyers and renters
Renovation cost estimate screening
Value-add ROI direction
- Resale paint exterior siding — enhances curb appeal and value ↑
- Both update flooring in bathrooms — improves aesthetics and functionality ↑
- Both install smart home features — attracts tech-savvy buyers and renters ↑
ⓘ Cost ranges are severity-bucket heuristics (US national rule-of-thumb). Get contractor quotes + a written scope before underwriting a rehab budget.
Schools (NCES district)
- District
- Canton Local
- NCES district ID
- 3904983
- Math proficiency
- 54% ▼ -12.00%
- Reading proficiency
- 52% ▼ -11.00%
- Median HH income
- $46,980
- Composite
- 45.0/100
- National rank
- #2699
- State rank
- #401 of 656 in OH
Livability — North Industry
No livability data for this city. (Only ~50 U.S. cities are tracked.)
Census & demographics
- County
- Stark County · 272,865 people
- Metro
- Canton-Massillon, OH
- Population (ZIP)
- 16,496
- Household income
- $58,228
- Rent vs Own
- Severe rent burden
- 502.0
Population outlook (Stark County) Hauer SSP2
- Today (2025)
- 373,708 people
- By 2030
- 371,245 · -0.7%
- By 2040
- 361,331 · -3.3%
- By 2050
- 345,290 · -7.6%
- By 2075
- 302,669 · -19.0%
- By 2100
- 238,870 · -36.1%
Race, ethnicity, and origin ACS 2023
- Neighborhood character
- Predominantly White (84%)
- Race & ethnicity
- White 84% Black 8% Two or more races 6% Hispanic / Latino 3%
- Common ancestry
- Romanian 4% Italian 3% Lithuanian 2%
- Foreign-born
- 1% · Canada
- Languages at home
- 98% English-only · Spanish 2%
Political lean MEDSL · Stark
- 2024 margin
- Strong R (+21.9) · D 38.6% · R 60.5%
- 2008→2024 swing
- -27.4pp toward R · 2008: 5.5pp · 2024: -21.9pp
- All cycles
- 2024: R+21.9 2020: R+18.5 2016: R+17.4 2012: R+0.4 2008: D+5.5
Not yet ingested
- Civics
- —
Market trends
- HPI YoY
- ▼ -156.35%
- Current HPI
- 239.851
- Rent YoY
- —
- Metro
- Canton-Massillon, OH
- State GDP YoY
- ▲ 1.98%
- F500 in state
- 48
Industry mix (Fortune 500 HQ in OH)
| Industry | F500 HQs | Revenue |
|---|---|---|
| Insurance | 3 | $145B |
|
||
| Industrial Machinery | 3 | $49B |
|
||
| Financial Services | 3 | $24B |
|
||
| Consumer Goods | 2 | $93B |
|
||
| Aerospace / Defense | 2 | $47B |
|
||
| Utilities | 2 | $33B |
|
||
Cash-flow waterfall
monthlySold comps — $/sqft
last 12 mo · ≤1 miLoading sold comps…