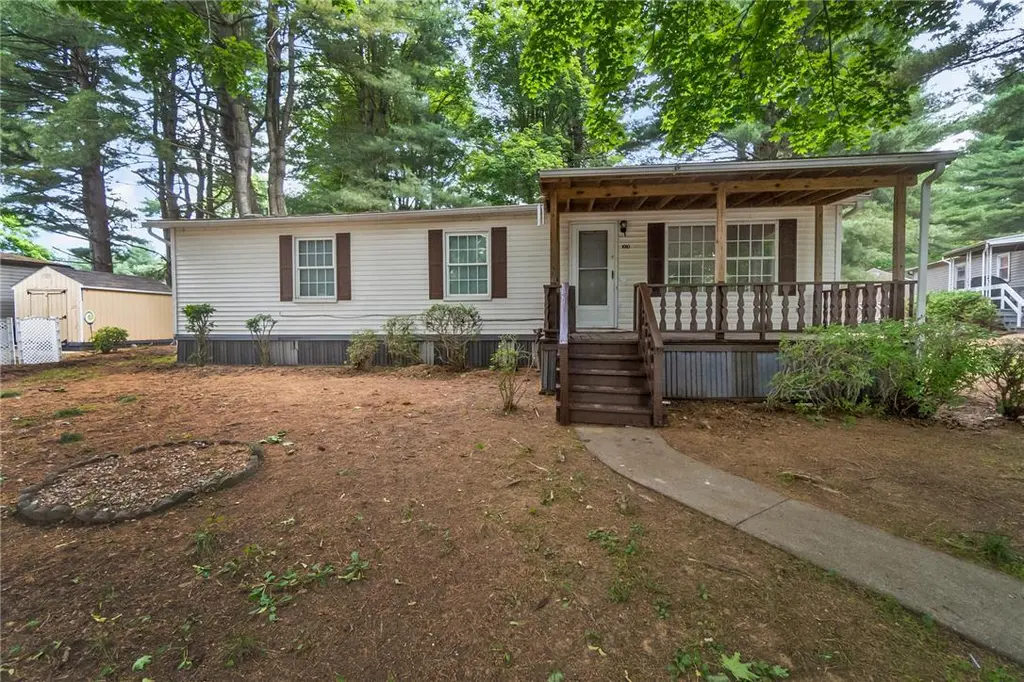
1010 Spruce Ln · Upper Macungie, PA
Flood risk 8/10 · Major
- FEMA flood zone
- X (unshaded)
- Chance of flooding over 30 yrs
- 0.99%
- Est. flood insurance / yr
- $507 – $1,088
Fire risk 1/10 · Minimal
- Est. fire insurance / yr
- $511 – $949
Heat risk 4/10 · Minor
- Hot days now (above 100°F)
- 7 days/yr
- Hot days in 30 yrs
- 15 days/yr
Wind risk 4/10 · Minor
- Chance of severe wind over 30 yrs
- 17.0%
Air-quality risk 3/10 · Minor
- Unhealthy air days now
- 2 days/yr
- Unhealthy air days in 30 yrs
- 3 days/yr
Risk factors via First Street. Map © Google.
Why this score? — see what drove the B- grade
The composite is a weighted blend of 9 inputs, each scored 0–100. Each bar is that input's sub-score; the figure is the points it added to the 100-point composite (weight × sub-score).
- Cash flow +27.6/30.0
- 1% rule +10.0/10.0
- DSCR +9.7/10.0
- Schools +5.7/10.0
- Appreciation +4.6/10.0
- Rent growth +3.0/5.0
- Livability +2.5/5.0
- Condition / age +2.5/5.0
- ARV discount +2.0/15.0
$73,500
🖨 Deal sheet 📄 Offer letter ✓ Due diligence
Listing remarks
Discover unparalleled ease of living in this completely move-in ready residence, ideally situated within the highly sought-after Parkland School District. This charming home, located in the amenity-rich community of Green Acres, offers a fresh and bright atmosphere where all the hard work has already been completed for you. A welcoming covered front porch invites residents and guests alike, nestled amongst mature trees, providing a tranquil retreat from the everyday. The spacious living area features warm wood paneling, soft carpeting, and an airy ambiance enhanced by sloped ceilings and two skylights that flood the space with natural light. Adjacent to the living area, a dedicated dining s
Key facts
- 0.64 acre lot
- 2 garage spots
- Built 1987
Property features AI
Finance
- HOA & community: Association fee approximately $1,042.02 monthly
Exterior
- Parking: 2-car garage; Off-street parking; Parking pad; On-street parking
- Utilities: Community/Co-op water; Community/Co-op sewer; Electric water heater
- Home design: Single-story; Vinyl siding; Asphalt/fiberglass roof; Approximately 1,056 above-grade finished area
- Construction: Built with vinyl siding; Asphalt and fiberglass roofing
- Exterior features: Mobile home on property; Zoned RMH
Interior
- Kitchen: Electric cooktop; Electric oven
- Bathrooms: 2 full bathrooms
- Heating & cooling: Electric heating; Central air conditioning
- Interior features: Dining area
- Laundry & utility: Washer hookup; Dryer hookup; Electric dryer hookup; Electric water heater
Neighborhood map
What this means for you Summary
Snapshot
- This is a 3-bed/2.0-bath manufactured listed at $74k.
Deal economics
- At list price, monthly cash flow is $154 ($2k/yr) — positive.
- The deal already cash-flows at list — no discount required.
- Meets the 1% rule at list price ($2k rent vs $74k).
Location & tenants
- Location reads: area grade B — affects rentability + tenant quality, not the cash-flow math above.
- Parkland SD (suburban): math 59% / reading 70% proficiency, ranked #40 of 539 in PA (top 7%) — acceptable for families but not a draw, mixed tenant base, ~2y average lease; only 15% free/reduced lunch — higher-income household profile.
- Market conditions: Rents rising (+1.9%/yr); 123 active listings in the ZIP; 11 comparable units currently listed for rent nearby; rentals at typical pace (median 14d on market — plan ~3-4 weeks tenant-placement turnaround); high-income renter base; 765 units permitted in Lehigh County in 2024 (286 in 5+ unit buildings).
Forward outlook
- Local home prices are declining (-0.7%/yr); year-one equity from $508 of loan paydown is wiped out by about $528 of value loss. Plan a longer hold.
- Lehigh County population projected at +21% by 2050 — long-run rental-demand tailwind backs the buy-and-hold thesis.
- At projected returns (-0.7% appreciation + 1.9% rent growth), your $21k cash investment doubles in ~10 years — after that, you're playing with house money.
Negotiation context
- Only 6 days on market — expect competitive offers; lowballing is unlikely to land.
Risks & watch-outs
- Watch-outs: flood insurance adds $66/mo; HOA is 47% of rent.
- Climate carrying-cost: severe flood risk — expect insurance premiums to compound above CPI over the hold.
Questions for the listing agent
- What's the actual annual flood-insurance premium (NFIP or private), and is the property in a SFHA with mandatory coverage?
- What does the HOA fee cover, when was the last increase, and are there any pending special assessments or reserve-fund shortfalls?
- Is there a deadline driving the sale (1031 exchange, divorce, estate, relocation)? That informs how much negotiation room exists.
- What's the average days-on-market for RENTAL listings here right now (not sales)? A rising rental-DOM trend means longer vacancies and softer asking-rent achievability than the comps imply.
- What's the recent tenant-quality profile in this submarket — average credit score on applications, eviction rate, late-payment / NSF rate, and stable-employment percentage? A property-management company in the area should have these aggregated.
- How much new for-sale + rental construction is in the pipeline within 1–3 miles? Heavy new supply typically softens prices + rents 12–24 months out; constrained supply supports both.
Investment metrics
- 1% rule
- 3.05% ✓
- Cap rate
- 9.89%
- Cash-on-cash
- 12.84%
- DSCR
- 1.57
- GRM
- 2.7
CMA / ARV
- ARV (on-the-fly)
- $65,472
- Comps found
- 12
Show comp detail 12 sales within ~0.75 mi
| Address | Dist | Beds/Ba | Sqft | Sold | Price | $/sf | Match |
|---|---|---|---|---|---|---|---|
| 1016 Spruce Ln | 0.00mi | 3/2.0 | 1,056 (0%) | 1mo | $59,000 | $56 | 99 |
| 8754 Breinig Run Cir | 0.16mi | 3/2.0 | 1,031 (-2%) | 3mo | $80,000 | $78 | 86 |
| 1007 Redwood Dr | 0.23mi | 3/2.0 | 1,056 (0%) | 8mo | $58,000 | $55 | 82 |
| 8722 Evergreen Cir | 0.05mi | 2/2.0 (-1) | 1,080 (+2%) | 9mo | $57,000 | $53 | 81 |
| 8726 Breinig Run Cir | 0.25mi | 3/2.0 | 1,152 (+9%) | 5mo | $77,000 | $67 | 69 |
| 8792 Turkey Ridge Rd | 0.23mi | 2/2.0 (-1) | 960 (-9%) | 1mo | $70,000 | $73 | 69 |
| 8711 Breinig Run Cir | 0.31mi | 2/2.0 (-1) | 1,056 (0%) | 15mo | $46,500 | $44 | 68 |
| 8902 Breinig Run Cir | 0.15mi | 2/2.0 (-1) | 1,152 (+9%) | 6mo | $75,000 | $65 | 68 |
| 8820 Breinig Run Cir | 0.11mi | 3/1.0 | 924 (-12%) | 3mo | $25,000 | $27 | 68 |
| 8719 Turkey Ridge Rd | 0.40mi | 3/2.0 | 1,120 (+6%) | 6mo | $69,000 | $62 | 66 |
| 8711 Turkey Ridge Rd | 0.34mi | 2/2.0 (-1) | 1,056 (0%) | 19mo | $74,000 | $70 | 64 |
| 8914 Breinig Run Cir | 0.14mi | 3/2.0 | 1,200 (+14%) | 13mo | $53,000 | $44 | 60 |
Match score weights: distance 35% · size 25% · config 20% · recency 20%. Top-matched comps best support the ARV.
Projected returns pro-forma
-0.72% appreciation · 1.92% rent growth · sell at horizon
- IRR
- 3.8%
- Equity multiple
- 1.17×
- Total profit
- $3,507
- Equity at exit
- $18,741
- IRR
- 8.2%
- Equity multiple
- 1.77×
- Total profit
- $15,867
- Equity at exit
- $20,545
Cash invested: $20,580 (down + closing). Projections, not guarantees.
Landlord ↔ Tenant lean methodology
- Overall (STATE)
- 62 Landlord-Friendly
- State Pennsylvania
- 62 Landlord-Friendly · EVEN
- County
- — inherits STATE
- City
- — inherits STATE
ZIP-level market 18031
- Home prices YoY
- -0.3%
- Rents YoY
- 1.9%
- Active inventory
- 123
- Price-to-rent
- 2.7×
Monthly cashflow live
- Estimated rent
- $2,241 high interval (Pro) →
- Mortgage (P&I)
- −$385
- Tax est. 1.5%
- −$92 /mo · $1,102/yr
- Insurance
- −$31
- Flood insurance flood zone
- −$66 /mo · $798/yr
- HOA
- −$1,042
- Vacancy / Maint / Mgmt
- −$471
- Net cashflow
- $154
Break-even live
UW: 25.0% down · 7.5% · 30yr · 1.5% tax · 5.0% vac · 8.0% maint · 8.0% mgmt
Financing live
Cash to close
- Down payment
- $18,375
- Closing costs
- $2,205
- Reserves months
- —
- Total cash needed
- —
Loan-product check · same deal, 3 products live
Conventional
25% down · 7.5% · 30yr
- Down + closing
- —
- Monthly P&I
- —
- Monthly cashflow
- —
- DSCR
- —
- Eligible?
- —
Personal DTI + credit; lowest rate.
DSCR
20% down · 8.5% · 30yr
- Down + closing
- —
- Monthly P&I
- —
- Monthly cashflow
- —
- DSCR
- —
- Eligible?
- —
No personal income docs; deal must DSCR.
Hard money
10% down · 12.0% · 12mo
- Down + closing
- —
- Monthly P&I
- —
- Monthly cashflow
- —
- DSCR
- —
- Eligible?
- —
Short-term bridge; refi at stabilization.
Rent comps 11 comps
| Address | Beds | Baths | Sqft | Rent | $/sqft | DOM | Units | Dist |
|---|---|---|---|---|---|---|---|---|
| 8749 Breinig Run Cir Breinigsville, PA | 2.0 | 2.0 | 1029 | $1,695 | $1.65 | 2d | 1 | 0.17mi |
| 1208 Martin Rd Breinigsville, PA | 3.0 | 2.5 | 1500 | $2,450 | $1.63 | 43d | 1 | 0.70mi |
| 1145 Martin Rd Breinigsville, PA | 3.0 | 2.5 | 1500 | $2,500 | $1.67 | 2d | 1 | 0.73mi |
| 1273 Martin Rd Breinigsville, PA | 3.0 | 2.5 | 1500 | $2,550 | $1.70 | 43d | 1 | 0.76mi |
| 1175 Susan Cir Breinigsville, PA | 3.0 | 2.5 | 1500 | $2,600 | $1.73 | 43d | 1 | 0.76mi |
| 1177 Susan Cir Breinigsville, PA | 3.0 | 2.5 | 1500 | $2,500 | $1.67 | 43d | 1 | 0.76mi |
| 8328 Fair Way Breinigsville, PA | 3.0 | 2.5 | 1500 | $2,600 | $1.73 | 23d | 1 | 0.82mi |
| 8395 Saylor Ct Breinigsville, PA | 3.0 | 1.5 | 1056 | $2,100 | $1.99 | 14d | 1 | 0.99mi |
| 1447 Artisan Ct Breinigsville, PA | 2.0 | 1.5 | 1056 | $2,150 | $2.04 | 14d | 1 | 1.00mi |
| 1055 Cetronia Rd Breinigsville, PA | 1.0–2.0 | 1.0–2.0 | 1094 | $2,355 | $2.15 | 2d | 8 | 1.13mi |
| 9751 Newtown Rd Unit B Breinigsville, PA | 2.0 | 1.0 | 1288 | $2,300 | $1.79 | 2d | 1 | 1.20mi |
HOA detail
- Monthly dues
- $1,042 · $12,504/yr
Listing history 7 events
-
2026-06-18days on market $73,500 Active 6 DOM
-
2026-06-17days on market $73,500 Active 5 DOM
-
2026-06-16remarks 699-char remark
-
2026-06-16days on market $73,500 Active 4 DOM
-
2026-06-15days on market $73,500 Active 3 DOM
-
2026-06-13remarks 311-char remark
-
2026-06-13$73,500 Active 1 DOM
ⓘ Source: listings_history table (triggers on properties + properties_extension) + one-shot
backfill from property_details.listing_events for pre-trigger history.
Climate risk First Street
- Flood 8/10 Severe FEMA zone X (unshaded) · 99% chance over 30 yrs
- Wildfire 1/10 Low
- Heat 4/10 Moderate 7 d/yr ≥100°F today · 15 d/yr by 30 yrs out
- Wind 4/10 Moderate 17% chance of damaging wind over 30 yrs
- Air quality 3/10 Moderate 2 unhealthy d/yr today · 3 by 30 yrs out
Nearby sold comps map
Loading sold comps map…
Walkable amenities ~0.75 mi
Loading nearby amenities…
Taxation est. · year 1
- Rental income
- $26,889
- − Mortgage interest
- −$4,117
- − Property taxes
- −$1,102
- − Insurance
- −$1,165
- − Repairs & maintenance
- −$2,151
- − Management
- −$2,151
- − HOA
- −$12,504
- − Depreciation
- −$2,138
- Taxable income
- $1,560
- Est. tax owed @ 24.0%
- −$374
- After-tax cash flow
- $1,471/yr
For passive investors: Depreciation is non-cash, so a rental often shows a tax loss while cash-flowing — sheltering income. Rental losses are passive: they offset passive income freely, and up to $25,000/yr can offset ordinary (W-2) income if you actively participate and your MAGI is under $100k (phasing out to $0 by $150k); unused losses carry forward. On sale, claimed depreciation is recaptured at up to 25%, and gains may owe capital-gains tax (a 1031 exchange can defer both). Figures are a year-1 estimate at your 24.0% rate — not tax advice; consult a CPA.
Schools (NCES district)
- District
- Parkland SD
- NCES district ID
- 4218510
- Math proficiency
- 59% ▼ -11.00%
- Reading proficiency
- 70% ▼ -12.00%
- Median HH income
- $77,976
- Composite
- 57.44/100
- National rank
- #1074
- State rank
- #40 of 539 in PA
Livability — Upper Macungie
No livability data for this city. (Only ~50 U.S. cities are tracked.)
Census & demographics
- Census place
- Breinigsville, PA
- County
- Lehigh County · 333,019 people
- Metro
- Allentown-Bethlehem-Easton, PA-NJ
- Population (ZIP)
- 11,570
- Household income
- $113,625
- Rent vs Own
- Severe rent burden
- 52.0
Population outlook (Lehigh County) Hauer SSP2
- Today (2025)
- 392,957 people
- By 2030
- 408,319 · +3.9%
- By 2040
- 440,007 · +12.0%
- By 2050
- 475,940 · +21.1%
- By 2075
- 590,448 · +50.3%
- By 2100
- 690,314 · +75.7%
Race, ethnicity, and origin ACS 2023
- Neighborhood character
- Diverse neighborhood (Simpson 0.58)
- Race & ethnicity
- White 61% Hispanic / Latino 19% Two or more races 17% Asian 12% Black 5%
- Hispanic origin (detail)
- Mexican 6% Puerto Rican 7% Dominican 3%
- Common ancestry
- Polish 4% Lithuanian 3% Scandinavian 3%
- Foreign-born
- 19% · Canada, United Kingdom, China
- Languages at home
- 76% English-only · Spanish 10% Other Indo-European 8% Other Asian/Pacific 2%
Political lean MEDSL · Lehigh
- 2024 margin
- Toss-up / Even · D 50.7% · R 48.0% · Other 1.2%
- 2008→2024 swing
- -12.9pp toward R · 2008: 15.6pp · 2024: 2.7pp
- All cycles
- 2024: D+2.7 2020: D+7.6 2016: D+4.4 2012: D+7.5 2008: D+15.6
Not yet ingested
- Civics
- —
Market trends
- HPI YoY
- ▼ -0.72%
- Current HPI
- 267.8218
- Rent YoY
- ▲ 1.92%
- Metro
- Allentown-Bethlehem-Easton, PA-NJ
- State GDP YoY
- ▲ 1.68%
- F500 in state
- 34
Industry mix (Fortune 500 HQ in PA)
| Industry | F500 HQs | Revenue |
|---|---|---|
| Healthcare | 2 | $309B |
|
||
| Insurance | 2 | $27B |
|
||
| Telecommunications / Media | 1 | $124B |
|
||
| Industrial Distribution | 1 | $22B |
|
||
| Financial Services | 1 | $20B |
|
||
| Chemicals / Materials | 1 | $18B |
|
||
Price history
1 event — show timeline
- 2026-06-12 Listed $73,500 GLVRMLS
Cash-flow waterfall
monthlySold comps — $/sqft
last 12 mo · ≤1 miLoading sold comps…