 Multi-family
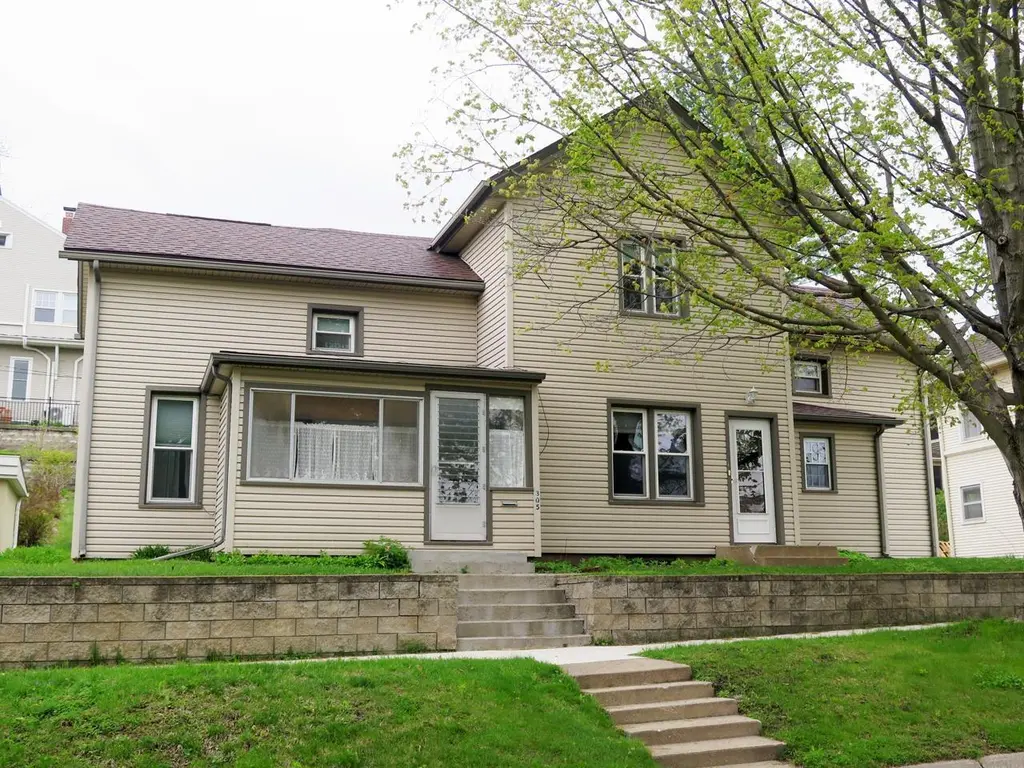
305 S Mill St · Decorah, IA
Flood risk 1/10 · Minimal
- FEMA flood zone
- —
- Chance of flooding over 30 yrs
- 0.0%
- Est. flood insurance / yr
- —
Fire risk 1/10 · Minimal
- Est. fire insurance / yr
- $902 – $1,676
Heat risk 2/10 · Minimal
- Hot days now (above 100°F)
- 7 days/yr
- Hot days in 30 yrs
- 15 days/yr
Wind risk 2/10 · Minimal
- Chance of severe wind over 30 yrs
- —
Air-quality risk 1/10 · Minimal
- Unhealthy air days now
- 0 days/yr
- Unhealthy air days in 30 yrs
- 0 days/yr
Risk factors via First Street. Map © Google.
Why this score? — see what drove the B+ grade
The composite is a weighted blend of 9 inputs, each scored 0–100. Each bar is that input's sub-score; the figure is the points it added to the 100-point composite (weight × sub-score).
- Cash flow +28.6/30.0
- ARV discount +15.0/15.0
- DSCR +10.0/10.0
- 1% rule +8.0/10.0
- Schools +7.0/10.0
- Livability +4.2/5.0
- Rent growth +2.5/5.0
- Condition / age +2.5/5.0
- Appreciation +0.0/10.0
$189,900
🖨 Deal sheet 📄 Offer letter ✓ Due diligence
Multi-family units
County records classify this as Multi-Family (2-4 Unit). Listing-text estimate: 1 unit. estimate disagrees with records
Listing remarks
4 bedroom 2 bath home only 2 1/2 blocks from downtown and Phelp's park. With the updated kitchen, replacement windows, vinyl siding, hardwood floors, 2 car garage and over 1600 sf of finished space this home is ready for new owners. Looking for a rental this home could easily be put back into a duplex! CALL TODAY!
Key facts
- Finished space
- Updated kitchen
- Vinyl siding
Tags
Property features AI
Exterior
- Parking: Detached carport; Carport for 2 vehicles
- Utilities: Public water; Public sewer
- Home design: Single‑family residence; Residential property
- Construction: Vinyl siding; Asphalt roof
- Exterior features: Enclosed patio/porch; Gravel road access
Interior
- Kitchen: Free‑standing range; Refrigerator
- Bathrooms: One full bathroom; One three-quarter bathroom
- Heating & cooling: Forced air heating (natural gas); Central air conditioning; Ceiling fan(s)
- Interior features: Ceiling fan(s)
- Laundry & utility: Gas water heater; Water softener
Neighborhood map
What this means for you Summary
Snapshot
- This is a 3-bed/2.5-bath multifamily listed at $190k.
Deal economics
- At list price, monthly cash flow is $627 ($8k/yr) — positive.
- The deal already cash-flows at list — no discount required.
- Meets the 1% rule at list price ($2k rent vs $190k).
- Recommended offer: $184k (3.0% below list) — sets the bar for market timing.
- Cap rate 10.3% vs local median 3.4% in Decorah — top-decile yield for the area; either an underpriced asset or a hidden risk that comps aren't pricing in. Stress-test before assuming the spread holds.
Location & tenants
- Location reads 85/100 on livability (#16 in IA, #499 nationally) — a professional / high-income tenant draw. Strengths: crime A+, cost of living A+, housing A+; Watch: amenities F, commute F.
- Decorah Community School District (town): math 80% / reading 84% proficiency, ranked #21 of 289 in IA (top 7%) — strong family-tenant draw, lease renewals of 3-5y typical; only 18% free/reduced lunch — higher-income household profile.
- Zoned schools: Decorah Middle School (math 77% / reading 83%, grade A+, #32 of 246 statewide, top 13%, 461 students, 26% FRL); Decorah High School (math 85% / reading 92%, grade A, #3 of 336 statewide, top 1%, 576 students, 22% FRL).
- Market conditions: 75 active listings in the ZIP; 2 comparable units currently listed for rent nearby; 49 units permitted in Winneshiek County in 2024 (0 in 5+ unit buildings).
- This rent runs 40% of the median local income ($73k/yr) — at the standard rent-burdened threshold; future hikes will face affordability resistance.
Forward outlook
- Local home prices are declining (-3.0%/yr); year-one equity from $1k of loan paydown is wiped out by about $6k of value loss. Plan a longer hold.
- Winneshiek County population projected at -15% by 2050 — secular population decline; favor cash flow + early exit over multi-decade hold.
- At projected returns (-3.0% appreciation + 3.0% rent growth), your $53k cash investment doubles in ~9 years — after that, you're playing with house money.
Negotiation context
- It's been on market 44 days — a 3% lower offer ($184k) is reasonable based on typical stale-listing flexibility.
Risks & watch-outs
- Watch-outs: built in 1900 — expect roof / HVAC / electrical / plumbing capex.
Questions for the listing agent
- It's been on market 44 days. Have you received any prior offers? Is the seller open to a 3% concession, seller financing, or rate buy-down credit?
- Built in 1900 — when were the roof, HVAC, electrical panel, plumbing, and water heater last replaced?
- Is there a deadline driving the sale (1031 exchange, divorce, estate, relocation)? That informs how much negotiation room exists.
- Schools are A-rated — typically a magnet for longer-tenancy family renters. What's the average tenant stay here, and is there a school-zone premium baked into asking?
- What's the average days-on-market for RENTAL listings here right now (not sales)? A rising rental-DOM trend means longer vacancies and softer asking-rent achievability than the comps imply.
- What's the recent tenant-quality profile in this submarket — average credit score on applications, eviction rate, late-payment / NSF rate, and stable-employment percentage? A property-management company in the area should have these aggregated.
- How much new apartment / multifamily construction is in the pipeline within 1–3 miles? Heavy new supply (>2% of stock underway) typically softens rents 12–24 months out; light construction supports rent growth.
Investment metrics
- 1% rule
- 1.30% ✓
- Cap rate
- 10.26%
- Cash-on-cash
- 14.16%
- DSCR
- 1.63
- GRM
- 6.4
CMA / ARV
- ARV (median comp)
- $268,338
- List price
- $189,900
- Delta
- -29.23%
- Verdict
- UNDERPRICED
- Comps
- 20 within 1.0 mi
Projected returns pro-forma
-3.0% appreciation · 3.0% rent growth · sell at horizon
- IRR
- 4.5%
- Equity multiple
- 1.17×
- Total profit
- $9,223
- Equity at exit
- $28,315
- IRR
- 14.0%
- Equity multiple
- 2.12×
- Total profit
- $59,650
- Equity at exit
- $16,419
Cash invested: $53,172 (down + closing). Projections, not guarantees.
Landlord ↔ Tenant lean methodology
- Overall (STATE)
- 83 Strongly Landlord-Friendly
- State Iowa
- 83 Strongly Landlord-Friendly · R+6
- County
- — inherits STATE
- City
- — inherits STATE
ZIP-level market 52101
- Home prices YoY
- -26.7%
- Active inventory
- 75
- Price-to-rent
- 12.8×
Monthly cashflow live
- Estimated rent
- $2,467 medium interval (Pro) →
- Mortgage (P&I)
- −$996
- Tax from tax record
- −$247 /mo · $2,960/yr
- Insurance
- −$79
- HOA
- −$0
- Vacancy / Maint / Mgmt
- −$518
- Net cashflow
- $627
Break-even live
2-unit breakdown (identical units grouped — click to expand)
| Units | Beds | Baths | Est. rent |
|---|---|---|---|
| 2× units | 2 | 1 | $2,466 |
| #1 | 2 | 1 | $1,233 |
| #2 | 2 | 1 | $1,233 |
| Total (2 units) | $2,467 | ||
UW: 25.0% down · 7.5% · 30yr · 1.5% tax · 5.0% vac · 8.0% maint · 8.0% mgmt
Financing live
Cash to close
- Down payment
- $47,475
- Closing costs
- $5,697
- Reserves months
- —
- Total cash needed
- —
Loan-product check · same deal, 3 products live
Conventional
25% down · 7.5% · 30yr
- Down + closing
- —
- Monthly P&I
- —
- Monthly cashflow
- —
- DSCR
- —
- Eligible?
- —
Personal DTI + credit; lowest rate.
DSCR
20% down · 8.5% · 30yr
- Down + closing
- —
- Monthly P&I
- —
- Monthly cashflow
- —
- DSCR
- —
- Eligible?
- —
No personal income docs; deal must DSCR.
Hard money
10% down · 12.0% · 12mo
- Down + closing
- —
- Monthly P&I
- —
- Monthly cashflow
- —
- DSCR
- —
- Eligible?
- —
Short-term bridge; refi at stabilization.
Rent comps 2 comps
| Address | Beds | Baths | Sqft | Rent | $/sqft | DOM | Units | Dist |
|---|---|---|---|---|---|---|---|---|
| 510 W Main St Decorah, IA | 3.0 | 2.0 | 1482 | $2,200 | $1.48 | 23d | 1 | 0.10mi |
| 405 Washington St Decorah, IA | 4.0 | 1.5 | 1279 | $1,800 | $1.41 | 3d | 1 | 0.30mi |
Listing history 16 events
-
2026-06-18price $189,900 Active 44 DOM
-
2026-06-18days on market $199,900 Active 44 DOM
-
2026-06-17days on market $199,900 Active 43 DOM
-
2026-06-16days on market $199,900 Active 42 DOM
-
2026-06-15days on market $199,900 Active 41 DOM
-
2026-06-14days on market $199,900 Active 39 DOM
-
2026-06-10days on market $199,900 Active 36 DOM
-
2026-06-09days on market $199,900 Active 35 DOM
-
2026-06-08days on market $199,900 Active 34 DOM
-
2026-06-07days on market $199,900 Active 33 DOM
-
2026-06-03days on market $199,900 Active 29 DOM
-
2026-06-02days on market $199,900 Active 28 DOM
-
2026-06-01days on market $199,900 Active 27 DOM
-
2026-05-31days on market $199,900 Active 26 DOM
-
2026-05-31days on market $199,900 Active 25 DOM
-
2026-05-05$199,900 Active 315-char remark
ⓘ Source: listings_history table (triggers on properties + properties_extension) + one-shot
backfill from property_details.listing_events for pre-trigger history.
Tax reassessment forecast IA · Partial reset (capped growth)
- Current annual tax
- $2,960 · $247/mo
- Projected year-2 tax
- $2,971 · $248/mo
- Expected delta
- +$11/yr (+$1/mo · 0.4%)
ⓘ Screening estimate from a state-policy table — verify with the county assessor before closing.
Climate risk First Street
- Flood 1/10 Low 0% chance over 30 yrs
- Wildfire 1/10 Low
- Heat 2/10 Low 7 d/yr ≥100°F today · 15 d/yr by 30 yrs out
- Wind 2/10 Low
- Air quality 1/10 Low 0 unhealthy d/yr today · 0 by 30 yrs out
Nearby sold comps map
Loading sold comps map…
Walkable amenities ~0.75 mi
Loading nearby amenities…
Taxation est. · year 1
- Rental income
- $29,604
- − Mortgage interest
- −$10,637
- − Property taxes
- −$2,960
- − Insurance
- −$950
- − Repairs & maintenance
- −$2,368
- − Management
- −$2,368
- − Depreciation
- −$5,524
- Taxable income
- $4,796
- Est. tax owed @ 24.0%
- −$1,151
- After-tax cash flow
- $6,376/yr
For passive investors: Depreciation is non-cash, so a rental often shows a tax loss while cash-flowing — sheltering income. Rental losses are passive: they offset passive income freely, and up to $25,000/yr can offset ordinary (W-2) income if you actively participate and your MAGI is under $100k (phasing out to $0 by $150k); unused losses carry forward. On sale, claimed depreciation is recaptured at up to 25%, and gains may owe capital-gains tax (a 1031 exchange can defer both). Figures are a year-1 estimate at your 24.0% rate — not tax advice; consult a CPA.
Schools (NCES district)
- District
- Decorah Community School District
- NCES district ID
- 1908730
- Math proficiency
- 80% ▼ -4.00%
- Reading proficiency
- 84% ▬ 0.00%
- Median HH income
- $54,304
- Composite
- 69.72/100
- National rank
- #294
- State rank
- #21 of 289 in IA
Livability — Decorah
- Score
- 85/100
- State rank
- #16
- US rank
- #499
Category grades
Schools grade is shown separately in the Schools card above.
Census & demographics
- Census place
- Decorah, IA
- County
- Winneshiek County · 12,706 people
- City population
- 12,706
- Metro
- nan
- Population (ZIP)
- 12,706
- Household income
- $73,484
- Rent vs Own
- Severe rent burden
- 207.0
Population outlook (Winneshiek County) Hauer SSP2
- Today (2025)
- 20,379 people
- By 2030
- 19,937 · -2.2%
- By 2040
- 18,697 · -8.3%
- By 2050
- 17,392 · -14.7%
- By 2075
- 14,921 · -26.8%
- By 2100
- 12,836 · -37.0%
Race, ethnicity, and origin ACS 2023
- Neighborhood character
- Predominantly White (95%)
- Race & ethnicity
- White 95% Two or more races 2% Hispanic / Latino 2%
- Common ancestry
- Portuguese 25% Iranian 1% Lithuanian 1%
- Foreign-born
- 3% · Canada
- Languages at home
- 96% English-only · Spanish 1% Other Asian/Pacific 1%
Political lean MEDSL · Winneshiek
- 2024 margin
- Lean R (+9.3) · D 44.6% · R 53.9% · Other 1.5%
- 2008→2024 swing
- -31.9pp toward R · 2008: 22.7pp · 2024: -9.3pp
- All cycles
- 2024: R+9.3 2020: R+5.1 2016: R+0.8 2012: D+14.8 2008: D+22.7
Not yet ingested
- Civics
- —
Market trends
- HPI YoY
- ▼ -69.20%
- Current HPI
- 189.63
- Rent YoY
- —
- Metro
- nan
- State GDP YoY
- ▲ 2.48%
- F500 in state
- 4
Industry mix (Fortune 500 HQ in IA)
| Industry | F500 HQs | Revenue |
|---|---|---|
| Financial Services | 1 | $16B |
|
||
| Retail / Convenience | 1 | $15B |
|
||
Price history
-5.0% since first listed2 events — show timeline
- 2026-06-18 Price Changed $189,900 NEIRBR as distributed by MLS GRID
- 2026-05-05 Listed $199,900 NEIRBR as distributed by MLS GRID
Property tax history
+5.7%/yrLatest (2025): $2,960 · +4.4% YoY. Source: county tax records.
Cash-flow waterfall
monthlySold comps — $/sqft
last 12 mo · ≤1 miLoading sold comps…