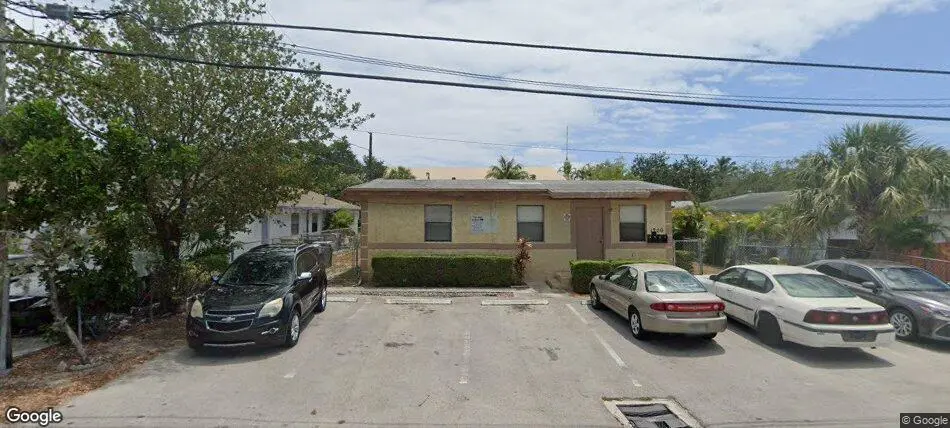
831 NW 17th Ter Unit 1-4 · Pompano Beach, FL
Flood risk 6/10 · Moderate
- FEMA flood zone
- X (shaded)
- Chance of flooding over 30 yrs
- 0.98%
- Est. flood insurance / yr
- $507 – $1,088
Fire risk 1/10 · Minimal
- Est. fire insurance / yr
- $947 – $1,759
Heat risk 9/10 · Severe
- Hot days now (above 107°F)
- 7 days/yr
- Hot days in 30 yrs
- 24 days/yr
Wind risk 10/10 · Severe
- Chance of severe wind over 30 yrs
- 99.0%
Air-quality risk 2/10 · Minimal
- Unhealthy air days now
- 1 days/yr
- Unhealthy air days in 30 yrs
- 2 days/yr
Risk factors via First Street. Map © Google.
Why this score? — see what drove the F grade
The composite is a weighted blend of 9 inputs, each scored 0–100. Each bar is that input's sub-score; the figure is the points it added to the 100-point composite (weight × sub-score).
- ARV discount +7.5/15.0
- Schools +4.1/10.0
- Livability +3.7/5.0
- Cash flow +3.4/30.0
- Appreciation +3.4/10.0
- Condition / age +2.5/5.0
- Rent growth +2.4/5.0
- 1% rule +0.0/10.0
- DSCR +0.0/10.0
$689,000
🖨 Deal sheet 📄 Offer letter ✓ Due diligence
Listing remarks
ALL UNITS ARE LEASED VIEWIN MUST BE DONE DURING INSPECTION
Key facts
- 4,500 sq ft lot
- Built 1959
- Listed 20 days
Property features AI
Finance
- Financial info: Two total units on the parcel; Tenants pay electricity and water; Pets allowed with no restrictions; Part of a 4-unit community
Exterior
- Utilities: Public water; Public sewer; Cable available; Electricity available; Phone connected; Separate electric meter for each unit (4); Separate gas meter for each unit (4)
- Home design: Quadruplex; Single-story building; Owner-reported building area 1,440
- Construction: Concrete block (no stucco) construction; Built as part of a 4-unit community
- Exterior features: Shingle roof; Not waterfront
Interior
- Flooring: Carpet; Ceramic tile
- Heating & cooling: Central heating; Central air conditioning
- Interior features: Carpet and ceramic tile flooring
Neighborhood map
What this means for you Summary
Snapshot
- This is a condo listed at $689k.
Deal economics
- At list price, monthly cash flow is $-2k ($-25k/yr) — negative.
- To cash-flow at today's rent, offer at most $318k (53.8% below list).
- To meet the 1% rule (rent ≥ 1% of price), the offer needs to be $285k (58.7% below list).
- Recommended offer: $285k (58.7% below list) — sets the bar for 1% rule.
Location & tenants
- Location reads 74/100 on livability (#284 in FL, #4,541 nationally) — a middle-class / working-renter tenant base. Strengths: commute A+, housing A+, cost of living B+; Watch: employment D+, amenities F.
- Broward (suburban): math 42% / reading 53% proficiency, ranked #46 of 73 in FL (top 63%) — families likely to look elsewhere, expect single-tenant / working-renter base with shorter leases.
- Zoned schools: Robert C. Markham Elementary (math 15% / reading 23%, grade F, #2,111 of 2,144 statewide, top 99%, 580 students, 75% FRL); Crystal Lake Middle School (math 24% / reading 38%, grade F, #462 of 571 statewide, top 81%, 1,055 students, 74% FRL); Blanche Ely High School (math 7% / reading 29%, grade F, #570 of 667 statewide, top 86%, 1,906 students, 75% FRL) — zoned schools average 75% FRL vs 51% district-wide (23 pts higher); higher-poverty schools than district average — tighter screening recommended.
- Zoned-school proficiency averages 23% at this address vs 48% district-wide (-25 pts) — the specific schools serving this property underperform the Broward average; the district grade overstates school quality for this exact location.
- Market conditions: Rents soft (-0.3%/yr); 438 active listings in the ZIP; 40 comparable units currently listed for rent nearby; rentals at typical pace (median 25d on market — plan ~3-4 weeks tenant-placement turnaround); 2,111 units permitted in Broward County in 2024 (1,265 in 5+ unit buildings).
- At $2,847/mo this rent would consume 57% of the median local household income ($60k/yr) (locally 1670% of renters already pay >50% of income on rent) — very limited rent-growth headroom before tenants either downsize or default.
Forward outlook
- Local home prices are declining (-3.0%/yr); year-one equity from $5k of loan paydown is wiped out by about $21k of value loss. Plan a longer hold.
- Broward County population projected at +34% by 2050 — long-run rental-demand tailwind backs the buy-and-hold thesis.
Negotiation context
- It's been on market 20 days — a 2% lower offer ($679k) is reasonable based on typical stale-listing flexibility.
- Current owner paid $15k; list at $689k implies a 4493% gain — meaningful room to come down on a strong offer.
Risks & watch-outs
- Watch-outs: built in 1959 — expect roof / HVAC / electrical / plumbing capex.
- Climate carrying-cost: major flood risk; severe wind risk, 99% chance of damaging wind over 30y; extreme-heat days projected 7→24/yr by 2055 (HVAC capex compounding) — expect insurance premiums to compound above CPI over the hold.
Questions for the listing agent
- What do current leases actually rent for vs. the listed asking? Can we see a recent rent roll and the last 12 months of T-12 income?
- Built in 1959 — when were the roof, HVAC, electrical panel, plumbing, and water heater last replaced?
- Any open or pending special assessments — roof, HVAC, plumbing, elevator, façade? What's the per-unit balance and payoff schedule, and is the seller paying it off at close or rolling it to the buyer?
- Is there a deadline driving the sale (1031 exchange, divorce, estate, relocation)? That informs how much negotiation room exists.
- Schools are D-rated, which usually means shorter tenancies and higher turnover. Who's the typical renter profile here, and what's been the actual vacancy rate?
- The area grade is low — what's the realistic commute time and amenity access for the typical tenant pool here? Any planned neighborhood developments (good or bad) we should know about?
- What's the average days-on-market for RENTAL listings here right now (not sales)? A rising rental-DOM trend means longer vacancies and softer asking-rent achievability than the comps imply.
- What's the recent tenant-quality profile in this submarket — average credit score on applications, eviction rate, late-payment / NSF rate, and stable-employment percentage? A property-management company in the area should have these aggregated.
- How much new apartment / multifamily construction is in the pipeline within 1–3 miles? Heavy new supply (>2% of stock underway) typically softens rents 12–24 months out; light construction supports rent growth.
Investment metrics
- 1% rule
- 0.41% ✗
- Cap rate
- 2.64%
- Cash-on-cash
- -13.06%
- DSCR
- 0.42
- GRM
- 20.2
CMA / ARV
No comps found within radius.
Projected returns pro-forma
-3.0% appreciation · 0.0% rent growth · sell at horizon
- IRR
- -43.5%
- Equity multiple
- -0.32×
- Total profit
- $-253,962
- Equity at exit
- $102,732
- IRR
- -94.1%
- Equity multiple
- -1.21×
- Total profit
- $-426,484
- Equity at exit
- $59,572
Cash invested: $192,920 (down + closing). Projections, not guarantees.
Landlord ↔ Tenant lean methodology
- Overall (STATE)
- 87 Strongly Landlord-Friendly
- State Florida
- 87 Strongly Landlord-Friendly · R+3
- County
- — inherits STATE
- City
- — inherits STATE
ZIP-level market 33069
- Home prices YoY
- -1.1%
- Rents YoY
- -0.3%
- Active inventory
- 438
- Price-to-rent
- 20.2×
Monthly cashflow live
- Estimated rent
- $2,847 high interval (Pro) →
- Mortgage (P&I)
- −$3,613
- Tax from tax record
- −$449 /mo · $5,389/yr
- Insurance
- −$287
- HOA
- −$0
- Vacancy / Maint / Mgmt
- −$598
- Net cashflow
- $-2,100
Break-even live
UW: 25.0% down · 7.5% · 30yr · 1.5% tax · 5.0% vac · 8.0% maint · 8.0% mgmt
Financing live
Cash to close
- Down payment
- $172,250
- Closing costs
- $20,670
- Reserves months
- —
- Total cash needed
- —
Loan-product check · same deal, 3 products live
Conventional
25% down · 7.5% · 30yr
- Down + closing
- —
- Monthly P&I
- —
- Monthly cashflow
- —
- DSCR
- —
- Eligible?
- —
Personal DTI + credit; lowest rate.
DSCR
20% down · 8.5% · 30yr
- Down + closing
- —
- Monthly P&I
- —
- Monthly cashflow
- —
- DSCR
- —
- Eligible?
- —
No personal income docs; deal must DSCR.
Hard money
10% down · 12.0% · 12mo
- Down + closing
- —
- Monthly P&I
- —
- Monthly cashflow
- —
- DSCR
- —
- Eligible?
- —
Short-term bridge; refi at stabilization.
Rent comps 40 comps
| Address | Beds | Baths | Sqft | Rent | $/sqft | DOM | Units | Dist |
|---|---|---|---|---|---|---|---|---|
| 1880 NW 8th St Pompano Beach, FL | 3.0 | 2.0 | 1539 | $3,400 | $2.21 | 21d | 1 | 0.14mi |
| 1880 NW 8th St Unit 1880 Pompano Beach, FL | 3.0 | 2.0 | 1539 | $3,400 | $2.21 | 5d | 1 | 0.14mi |
| 990 Powerline Rd Pompano Beach, FL | 1.0–2.0 | 1.0–2.0 | 833 | $2,388 | $2.87 | 2d | 14 | 0.28mi |
| 2143 NW 4th St Unit 2 Pompano Beach, FL | 3.0 | 2.5 | 1415 | $3,200 | $2.26 | 24d | 1 | 0.48mi |
| 2321 NW 6th St Pompano Beach, FL | 3.0 | 2.0 | 1404 | $3,300 | $2.35 | 24d | 1 | 0.50mi |
| 480 NW 27th Ave Pompano Beach, FL | 2.0 | 2.5 | 1260 | $2,800 | $2.22 | 24d | 1 | 0.81mi |
| 939 NW 3rd St Unit 939 Pompano Beach, FL | 3.0 | 2.5 | 1597 | $3,300 | $2.07 | 24d | 1 | 0.82mi |
| 2713 NW 6th St Pompano Beach, FL | 3.0 | 2.0 | 1283 | $3,250 | $2.53 | 24d | 1 | 0.83mi |
| 2713 NW 6th St Pompano Beach, FL | 3.0 | 2.0 | 1283 | $3,250 | $2.53 | 8d | 1 | 0.83mi |
| 1305 NW 27th Ave Pompano Beach, FL | 3.0 | 2.5 | 1348 | $2,999 | $2.22 | 24d | 1 | 0.84mi |
| 1313 NW 27th Ave Pompano Beach, FL | 3.0 | 2.5 | 1348 | $3,200 | $2.37 | 24d | 1 | 0.84mi |
| 920 NW 8th Ave Unit 3 Pompano Beach, FL | 2.0 | 1.5 | 1150 | $1,900 | $1.65 | 11d | 1 | 0.85mi |
| 2900 NW 8th St Pompano Beach, FL | 3.0 | 2.0 | 1144 | $2,600 | $2.27 | 24d | 1 | 0.94mi |
| 2720 NW 2nd St Pompano Beach, FL | 3.0 | 2.0 | 1210 | $2,700 | $2.23 | 24d | 1 | 0.95mi |
| 610 NW 7th Ave Pompano Beach, FL | 1.0–2.0 | 1.0 | 725 | $1,800 | $2.48 | 24d | 3 | 1.00mi |
| 635 NW 30th Ave Pompano Beach, FL | 3.0 | 2.5 | 1348 | $2,999 | $2.22 | 3d | 1 | 1.05mi |
| 841 NW 5th Ave Unit 1 Pompano Beach, FL | 2.0 | 1.0 | 1000 | $1,500 | $1.50 | 24d | 1 | 1.06mi |
| 774 NW 16th Pl Pompano Beach, FL | 3.0 | 2.0 | 1446 | $3,000 | $2.07 | 24d | 1 | 1.09mi |
| 355 NW 30th Ave Unit 0601 Pompano Beach, FL | 3.0 | 2.5 | 1348 | $3,275 | $2.43 | 24d | 1 | 1.10mi |
| 355 NW 30th Ter Pompano Beach, FL | 3.0 | 3.0 | 1355 | $3,275 | $2.42 | 11d | 1 | 1.10mi |
| 305 NW 30th Ave Unit 305 Pompano Beach, FL | 3.0 | 2.5 | 1348 | $2,999 | $2.22 | 24d | 1 | 1.11mi |
| 20 NW 7th Ave #6 Pompano Beach, FL | 3.0 | 1.5 | 1088 | $2,150 | $1.98 | 15d | 1 | 1.12mi |
| 650 NW 30th Ave Pompano Beach, FL | 3.0 | 2.5 | 1428 | $3,087 | $2.16 | 2d | 7 | 1.13mi |
| 360 NW 8th St Unit 8 Pompano Beach, FL | 2.0 | 1.0 | 875 | $1,900 | $2.17 | 24d | 1 | 1.14mi |
| 2829 N Course Dr #104 Pompano Beach, FL | 2.0 | 2.0 | 1020 | $1,950 | $1.91 | 21d | 1 | 1.15mi |
| 880 NW 3rd Way Unit 880 Pompano Beach, FL | 3.0 | 2.5 | 1597 | $3,600 | $2.25 | 24d | 1 | 1.16mi |
| 880 NW 3rd Way Unit 880 Pompano Beach, FL | 3.0 | 2.5 | 1597 | $3,600 | $2.25 | 8d | 1 | 1.16mi |
| 844 NW 3rd Way Unit 844 Pompano Beach, FL | 3.0 | 2.5 | 1621 | $3,500 | $2.16 | 24d | 1 | 1.16mi |
| 844 NW 3rd Way Unit 844 Pompano Beach, FL | 3.0 | 2.5 | 1621 | $3,500 | $2.16 | 10d | 1 | 1.16mi |
| 374 NW 31st Ave Pompano Beach, FL | 3.0 | 1.0 | 1066 | $2,600 | $2.44 | 24d | 1 | 1.22mi |
| 816 NW 3rd Ter Unit 818 Pompano Beach, FL | 3.0 | 2.5 | 1597 | $3,350 | $2.10 | 5d | 1 | 1.23mi |
| 816 NW 3rd Ter Unit 818 Pompano Beach, FL | 3.0 | 2.5 | 1597 | $3,350 | $2.10 | 24d | 1 | 1.23mi |
| 2801 N Course Dr Pompano Beach, FL | 1.0–2.0 | 1.0–2.0 | 991 | $2,325 | $2.35 | 24d | 12 | 1.24mi |
| 2803 N Course Dr #203 Pompano Beach, FL | 2.0 | 2.0 | 1120 | $2,100 | $1.88 | 21d | 1 | 1.27mi |
| 2803 N Course Dr #203 Pompano Beach, FL | 2.0 | 2.0 | 1120 | $2,050 | $1.83 | 4d | 1 | 1.27mi |
| 704 NW 3rd Ave Pompano Beach, FL | 3.0 | 1.0 | 1156 | $2,600 | $2.25 | 24d | 1 | 1.27mi |
| 2900 N Course Dr #208 Pompano Beach, FL | 3.0 | 2.5 | 1620 | $2,695 | $1.66 | 19d | 1 | 1.29mi |
| 2900 N Course Dr #107 Pompano Beach, FL | 2.0 | 2.0 | 1216 | $2,150 | $1.77 | 15d | 1 | 1.29mi |
| 2500 SW 7th St Pompano Beach, FL | 3.0 | 1.0–3.0 | 1216 | $4,097 | $3.37 | 3d | 45 | 1.34mi |
| 2751 N Palm Aire Dr #402 Pompano Beach, FL | 2.0 | 2.0 | 1064 | $2,300 | $2.16 | 24d | 1 | 1.35mi |
HOA detail condo
- Monthly dues
- $0 · $0/yr
- Assessments
- None detected in remarks — confirm with the listing agent.
Listing history 13 events
-
2026-06-18days on market $689,000 Active 20 DOM
-
2026-06-17days on market $689,000 Active 19 DOM
-
2026-06-16days on market $689,000 Active 18 DOM
-
2026-06-15days on market $689,000 Active 17 DOM
-
2026-06-13days on market $689,000 Active 15 DOM
-
2026-06-09days on market $689,000 Active 11 DOM
-
2026-06-08days on market $689,000 Active 10 DOM
-
2026-06-07days on market $689,000 Active 9 DOM
-
2026-06-04days on market $689,000 Active 6 DOM
-
2026-06-03days on market $689,000 Active 5 DOM
-
2026-06-02days on market $689,000 Active 4 DOM
-
2026-06-01days on market $689,000 Active 3 DOM
-
2026-05-31days on market $689,000 Active 2 DOM
ⓘ Source: listings_history table (triggers on properties + properties_extension) + one-shot
backfill from property_details.listing_events for pre-trigger history.
Tax reassessment forecast FL · Resets to sale price
- Current annual tax
- $5,389 · $449/mo
- Projected year-2 tax
- $5,719 · $477/mo
- Expected delta
- +$329/yr (+$27/mo · 6.1%)
ⓘ Screening estimate from a state-policy table — verify with the county assessor before closing.
Climate risk First Street
- Flood 6/10 Major FEMA zone X (shaded) · 98% chance over 30 yrs
- Wildfire 1/10 Low
- Heat 9/10 Extreme 7 d/yr ≥107°F today · 24 d/yr by 30 yrs out
- Wind 10/10 Extreme 99% chance of damaging wind over 30 yrs
- Air quality 2/10 Low 1 unhealthy d/yr today · 2 by 30 yrs out
Nearby sold comps map
Loading sold comps map…
Walkable amenities ~0.75 mi
Loading nearby amenities…
Taxation est. · year 1
- Rental income
- $34,166
- − Mortgage interest
- −$38,595
- − Property taxes
- −$5,389
- − Insurance
- −$3,445
- − Repairs & maintenance
- −$2,733
- − Management
- −$2,733
- − Depreciation
- −$20,044
- Taxable loss
- −$38,774
- Est. tax savings @ 24.0%
- +$9,306
- After-tax cash flow
- $-15,896/yr
For passive investors: Depreciation is non-cash, so a rental often shows a tax loss while cash-flowing — sheltering income. Rental losses are passive: they offset passive income freely, and up to $25,000/yr can offset ordinary (W-2) income if you actively participate and your MAGI is under $100k (phasing out to $0 by $150k); unused losses carry forward. On sale, claimed depreciation is recaptured at up to 25%, and gains may owe capital-gains tax (a 1031 exchange can defer both). Figures are a year-1 estimate at your 24.0% rate — not tax advice; consult a CPA.
Schools (NCES district)
- District
- Broward
- NCES district ID
- 1200180
- Math proficiency
- 42% ▼ -18.00%
- Reading proficiency
- 53% ▼ -5.00%
- Median HH income
- $52,139
- Composite
- 40.88/100
- National rank
- #3621
- State rank
- #46 of 73 in FL
Livability — Pompano Beach
- Score
- 74/100
- State rank
- #284
- US rank
- #4541
Category grades
Schools grade is shown separately in the Schools card above.
Census & demographics
- Census place
- Pompano Beach, FL
- County
- Broward County · 1,963,430 people
- City population
- 155,861
- Metro
- Miami-Fort Lauderdale-Pompano Beach, FL
- Population (ZIP)
- 29,145
- Household income
- $59,683
- Rent vs Own
- Severe rent burden
- 1670.0
Population outlook (Broward County) Hauer SSP2
- Today (2025)
- 2,207,033 people
- By 2030
- 2,360,704 · +7.0%
- By 2040
- 2,661,208 · +20.6%
- By 2050
- 2,946,698 · +33.5%
- By 2075
- 3,602,273 · +63.2%
- By 2100
- 3,970,984 · +79.9%
Race, ethnicity, and origin ACS 2023
- Neighborhood character
- Highly diverse neighborhood (Simpson 0.72)
- Race & ethnicity
- Black 33% White 32% Hispanic / Latino 26% Two or more races 21% Asian 3%
- Hispanic origin (detail)
- Mexican 5% Puerto Rican 3% Cuban 3% Dominican 2%
- Common ancestry
- Hispanic 9% Estonian 2% Romanian 2%
- Foreign-born
- 33% · Canada, Jamaica
- Languages at home
- 61% English-only · Spanish 23% French/Haitian/Cajun 9% Other Indo-European 5%
Political lean MEDSL · Broward
- 2024 margin
- D (+17.0) · D 58.0% · R 41.0%
- 2008→2024 swing
- -17.8pp toward R · 2008: 34.7pp · 2024: 17.0pp
- All cycles
- 2024: D+17.0 2020: D+29.8 2016: D+35.0 2012: D+34.9 2008: D+34.7
Not yet ingested
- Civics
- —
Market trends
- HPI YoY
- ▼ -3.16%
- Current HPI
- 297.1774
- Rent YoY
- ▼ -0.29%
- Metro
- Miami-Fort Lauderdale-Pompano Beach, FL
- State GDP YoY
- ▲ 3.28%
- F500 in state
- 36
Industry mix (Fortune 500 HQ in FL)
| Industry | F500 HQs | Revenue |
|---|---|---|
| Industrial Technology | 2 | $29B |
|
||
| Insurance | 2 | $17B |
|
||
| Retail | 1 | $60B |
|
||
| Technology Distribution | 1 | $58B |
|
||
| Homebuilding | 1 | $35B |
|
||
| Technology Manufacturing | 1 | $35B |
|
||
Price history
+4493.3% since first listed2 events — show timeline
- 2026-05-29 Listed $689,000 Beaches MLS
- 1983-05-01 Sold (Public Records) $15,000 Public Records
Property tax history
+10.6%/yrLatest (2025): $5,389 · +8.5% YoY. Source: county tax records.
Cash-flow waterfall
monthlySold comps — $/sqft
last 12 mo · ≤1 miLoading sold comps…