16 N Star Vale Drive Dr Unit 136A · Star Valley, AZ
Flood risk 1/10 · Minimal
- FEMA flood zone
- D
- Chance of flooding over 30 yrs
- 0.0%
- Est. flood insurance / yr
- $544 – $1,084
Fire risk 9/10 · Severe
- Est. fire insurance / yr
- $610 – $1,132
Heat risk 4/10 · Minor
- Hot days now (above 97°F)
- 8 days/yr
- Hot days in 30 yrs
- 21 days/yr
Wind risk 1/10 · Minimal
- Chance of severe wind over 30 yrs
- —
Air-quality risk 1/10 · Minimal
- Unhealthy air days now
- 0 days/yr
- Unhealthy air days in 30 yrs
- 0 days/yr
Risk factors via First Street. Map © Google.
Why this score? — see what drove the C grade
The composite is a weighted blend of 9 inputs, each scored 0–100. Each bar is that input's sub-score; the figure is the points it added to the 100-point composite (weight × sub-score).
- Cash flow +25.9/30.0
- DSCR +8.7/10.0
- 1% rule +6.9/10.0
- ARV discount +5.0/15.0
- Condition / age +4.0/5.0
- Rent growth +2.5/5.0
- Schools +2.2/10.0
- Livability +2.2/5.0
- Appreciation +0.0/10.0
$130,000
🖨 Deal sheet (PDF) 📄 Offer letter ✓ Due diligence
Listing remarks MLS
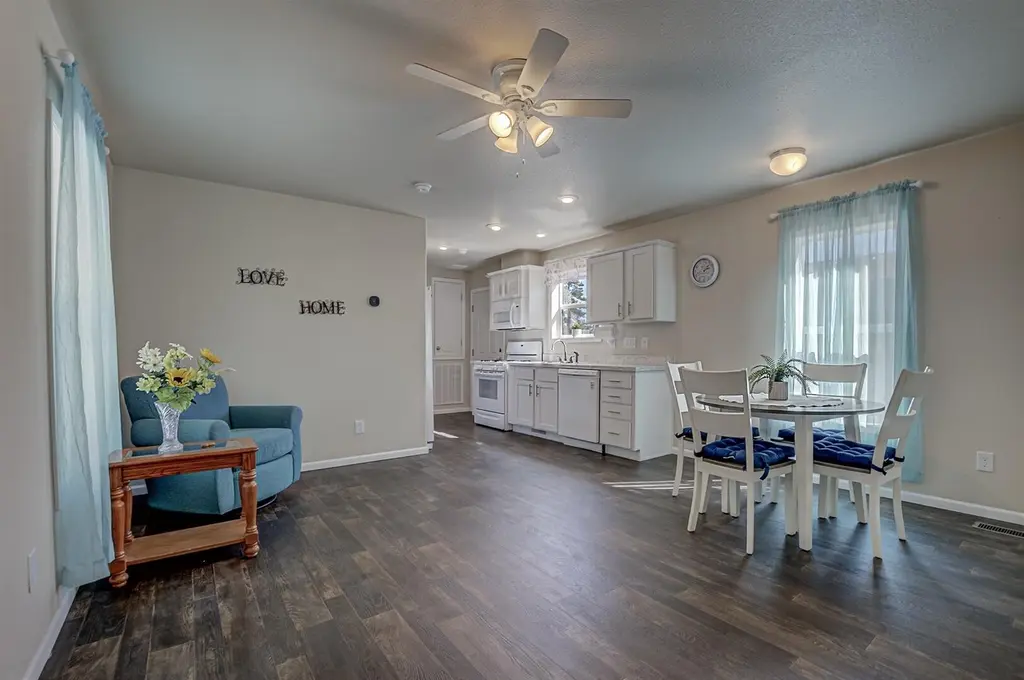
Charming 2-bedroom, 2-bath manufactured home built in 2022, offering 800 sq. ft. of comfortable living space. This well-maintained home is exceptionally clean and truly move-in ready. Highlights include a custom carport, a ramped sidewalk to the front entrance for easy step-free access, and a convenient storage room. A must-see opportunity!
Key facts
- Storage room
- Custom carport
- Ramped sidewalk
Tags
Neighborhood map
What this means for you Summary
Snapshot
- This is a 2-bed/2.0-bath manufactured listed at $130k. Condition is rated good.
Deal economics
- At list price, monthly cash flow is $321 ($4k/yr) — positive.
- The deal already cash-flows at list — no discount required.
- Meets the 1% rule at list price ($2k rent vs $130k).
- Recommended offer: $118k (9.0% below list) — sets the bar for market timing.
- Cap rate 9.3% vs local median 3.8% in Star Valley — top-decile yield for the area; either an underpriced asset or a hidden risk that comps aren't pricing in. Stress-test before assuming the spread holds.
Location & tenants
- Location reads 44/100 on livability (#380 in AZ) — a working-class tenant base; expect higher turnover. Strengths: cost of living A+, crime A; Watch: schools F, amenities F, commute F.
- Payson Unified District (4209) (town): math 20% / reading 32% proficiency, ranked #138 of 249 in AZ (top 55%) — low school quality limits family demand, transient renter base, plan for 1-2y turnover.
- Market conditions: 706 active listings in the ZIP; 217 units permitted in Gila County in 2024 (0 in 5+ unit buildings).
Forward outlook
- Local home prices are declining (-3.0%/yr); year-one equity from $899 of loan paydown is wiped out by about $4k of value loss. Plan a longer hold.
- Gila County population projected at -18% by 2050 — secular population decline; favor cash flow + early exit over multi-decade hold.
Negotiation context
- It's been on market 95 days — a 9% lower offer ($118k) is reasonable based on typical stale-listing flexibility.
Risks & watch-outs
- Climate carrying-cost: severe wildfire risk — expect insurance premiums to compound above CPI over the hold.
Questions for the listing agent
- It's been on market 95 days. Have you received any prior offers? Is the seller open to a 9% concession, seller financing, or rate buy-down credit?
- Why hasn't it sold? Are there any deal-killer items the seller is aware of (foundation, flood, title, zoning, code violations)?
- Is there a deadline driving the sale (1031 exchange, divorce, estate, relocation)? That informs how much negotiation room exists.
- Schools are F-rated, which usually means shorter tenancies and higher turnover. Who's the typical renter profile here, and what's been the actual vacancy rate?
- What's the average days-on-market for RENTAL listings here right now (not sales)? A rising rental-DOM trend means longer vacancies and softer asking-rent achievability than the comps imply.
- What's the recent tenant-quality profile in this submarket — average credit score on applications, eviction rate, late-payment / NSF rate, and stable-employment percentage? A property-management company in the area should have these aggregated.
- How much new for-sale + rental construction is in the pipeline within 1–3 miles? Heavy new supply typically softens prices + rents 12–24 months out; constrained supply supports both.
Investment metrics
- 1% rule
- 1.19% ✓
- Cap rate
- 9.26%
- Cash-on-cash
- 10.60%
- DSCR
- 1.47
- GRM
- 7.0
CMA / ARV
- ARV (median comp)
- $123,241
- List price
- $130,000
- Delta
- 9.54%
- Verdict
- FAIR
- Comps
- 20 within 1.0 mi
Show comp detail 6 sales within ~0.75 mi
| Address | Dist | Beds/Ba | Sqft | Sold | Price | $/sf | Match |
|---|---|---|---|---|---|---|---|
| 16 N Star Vale Drive Dr #44 | 0.24mi | 2/1.5 | 784 (-2%) | 16mo | $88,400 | $113 | 70 |
| 16 N Star Vale Dr Unit 141B | 0.24mi | 2/2.0 | 896 (+12%) | 8mo | $135,000 | $151 | 62 |
| 16 N Star Vale Rd Unit 114B | 0.24mi | 2/2.0 | 720 (-10%) | 13mo | $115,000 | $160 | 61 |
| 190 N Cornerstone Way #47 | 0.58mi | 2/2.0 | 840 (+5%) | 24mo | $35,000 | $42 | 45 |
| 3680 W State Hwy 260 Hwy Unit C29 | 0.22mi | 1/1.0 (-1) | 685 (-14%) | 15mo | $54,500 | $80 | 44 |
| 190 N Cornerstone Way #42 | 0.58mi | 2/1.0 | 720 (-10%) | 14mo | $105,000 | $146 | 41 |
Match score weights: distance 35% · size 25% · config 20% · recency 20%. Top-matched comps best support the ARV.
Projected returns pro-forma
-3.0% appreciation · 3.0% rent growth · sell at horizon
- IRR
- -0.4%
- Equity multiple
- 0.98×
- Total profit
- $-570
- Equity at exit
- $19,383
- IRR
- 9.3%
- Equity multiple
- 1.71×
- Total profit
- $25,960
- Equity at exit
- $11,240
Cash invested: $36,400 (down + closing). Projections, not guarantees.
Landlord ↔ Tenant lean methodology
- Overall (STATE)
- 87 Strongly Landlord-Friendly
- State Arizona
- 87 Strongly Landlord-Friendly · R+3
- County
- — inherits STATE
- City
- — inherits STATE
ZIP-level market 85541
- Home prices YoY
- -6.6%
- Active inventory
- 706
- Price-to-rent
- 7.0×
Monthly cashflow live
- Estimated rent
- $1,544 medium interval (Pro) →
- Mortgage (P&I)
- −$682
- Tax est. 1.5%
- −$162 /mo · $1,950/yr
- Insurance
- −$54
- HOA
- −$0
- Vacancy / Maint / Mgmt
- −$324
- Net cashflow
- $321
Break-even live
Sensitivity live
| Price | -10% $411 | -5% $366 | +0% $321 | +5% $277 | +10% $232 |
|---|---|---|---|---|---|
| Rent | -10% $199 | -5% $260 | +0% $321 | +5% $382 | +10% $443 |
| Rate | -1.0pp $387 | -0.5pp $355 | base $321 | +0.5pp $288 | +1.0pp $253 |
UW: 25.0% down · 7.5% · 30yr · 1.5% tax · 5.0% vac · 8.0% maint · 8.0% mgmt
Financing live
Cash to close
- Down payment
- $32,500
- Closing costs
- $3,900
- Reserves months
- —
- Total cash needed
- —
Loan-product check · same deal, 3 products live
Conventional
25% down · 7.5% · 30yr
- Down + closing
- —
- Monthly P&I
- —
- Monthly cashflow
- —
- DSCR
- —
- Eligible?
- —
Personal DTI + credit; lowest rate.
DSCR
20% down · 8.5% · 30yr
- Down + closing
- —
- Monthly P&I
- —
- Monthly cashflow
- —
- DSCR
- —
- Eligible?
- —
No personal income docs; deal must DSCR.
Hard money
10% down · 12.0% · 12mo
- Down + closing
- —
- Monthly P&I
- —
- Monthly cashflow
- —
- DSCR
- —
- Eligible?
- —
Short-term bridge; refi at stabilization.
Listing history 18 events
-
2026-06-21pricestatus $130,000 Pending 95 DOM
-
2026-06-19days on market $135,000 Active 95 DOM
-
2026-06-18days on market $135,000 Active 94 DOM
-
2026-06-17days on market $135,000 Active 93 DOM
-
2026-06-16days on market $135,000 Active 92 DOM
-
2026-06-15days on market $135,000 Active 91 DOM
-
2026-06-14days on market $135,000 Active 89 DOM
-
2026-06-12days on market $135,000 Active 88 DOM
-
2026-06-09days on market $135,000 Active 85 DOM
-
2026-06-08days on market $135,000 Active 84 DOM
-
2026-06-07days on market $135,000 Active 83 DOM
-
2026-06-03days on market $135,000 Active 79 DOM
-
2026-06-02days on market $135,000 Active 78 DOM
-
2026-06-01days on market $135,000 Active 77 DOM
-
2026-05-31pricedays on market $135,000 Active 76 DOM
-
2026-05-31days on market $140,000 Active 75 DOM
-
2026-04-23price $140,000 342-char remark
Show marketing remark (342 chars)
Charming 2-bedroom, 2-bath manufactured home built in 2022, offering 800 sq. ft. of comfortable living space. This well-maintained home is exceptionally clean and truly move-in ready. Highlights include a custom carport, a ramped sidewalk to the front entrance for easy step-free access, and a convenient storage room. A must-see opportunity!
-
2026-03-16$145,000 Active 342-char remark
Show marketing remark (342 chars)
Charming 2-bedroom, 2-bath manufactured home built in 2022, offering 800 sq. ft. of comfortable living space. This well-maintained home is exceptionally clean and truly move-in ready. Highlights include a custom carport, a ramped sidewalk to the front entrance for easy step-free access, and a convenient storage room. A must-see opportunity!
ⓘ Source: listings_history table (triggers on properties + properties_extension) + one-shot
backfill from property_details.listing_events for pre-trigger history.
Climate risk First Street
- Flood 1/10 Low FEMA zone D · 0% chance over 30 yrs
- Wildfire 9/10 Extreme
- Heat 4/10 Moderate 8 d/yr ≥97°F today · 21 d/yr by 30 yrs out
- Wind 1/10 Low
- Air quality 1/10 Low 0 unhealthy d/yr today · 0 by 30 yrs out
Nearby sold comps map
Loading sold comps map…
Walkable amenities ~0.75 mi
Loading nearby amenities…
Taxation est. · year 1
- Rental income
- $18,529
- − Mortgage interest
- −$7,282
- − Property taxes
- −$1,950
- − Insurance
- −$650
- − Repairs & maintenance
- −$1,482
- − Management
- −$1,482
- − Depreciation
- −$3,782
- Taxable income
- $1,901
- Est. tax owed @ 24.0%
- −$456
- After-tax cash flow
- $3,401/yr
For passive investors: Depreciation is non-cash, so a rental often shows a tax loss while cash-flowing — sheltering income. Rental losses are passive: they offset passive income freely, and up to $25,000/yr can offset ordinary (W-2) income if you actively participate and your MAGI is under $100k (phasing out to $0 by $150k); unused losses carry forward. On sale, claimed depreciation is recaptured at up to 25%, and gains may owe capital-gains tax (a 1031 exchange can defer both). Figures are a year-1 estimate at your 24.0% rate — not tax advice; consult a CPA.
Condition & rehab AI · 12 photos
This charming 2-bedroom, 2-bath manufactured home is exceptionally clean and move-in ready. It offers 800 sq. ft. of comfortable living space and is well-maintained with good condition in all areas.
Value-add opportunities
- Both Paint interior walls — Fresh paint enhances curb appeal and interior aesthetics
- Both Replace window treatments — New curtains can improve the home's curb appeal and interior aesthetics
- Both Replace flooring — New flooring can improve the home's curb appeal and interior aesthetics
- Both Replace countertops — New countertops can improve the home's curb appeal and interior aesthetics
- Both Replace appliances — New appliances can improve the home's curb appeal and interior aesthetics
Renovation cost estimate screening
Value-add ROI direction
- Both Paint interior walls — Fresh paint enhances curb appeal and interior aesthetics ↑
- Both Replace window treatments — New curtains can improve the home's curb appeal and interior aesthetics ↑
- Both Replace flooring — New flooring can improve the home's curb appeal and interior aesthetics ↑
- Both Replace countertops — New countertops can improve the home's curb appeal and interior aesthetics ↑
- Both Replace appliances — New appliances can improve the home's curb appeal and interior aesthetics ↑
ⓘ Cost ranges are severity-bucket heuristics (US national rule-of-thumb). Get contractor quotes + a written scope before underwriting a rehab budget.
Schools (NCES district)
- District
- Payson Unified District (4209)
- NCES district ID
- 0406070
- Math proficiency
- 20% ▼ -21.00%
- Reading proficiency
- 32% ▼ -16.00%
- Median HH income
- $41,440
- Composite
- 22.03/100
- National rank
- #8200
- State rank
- #138 of 249 in AZ
Livability — Star Valley
- Score
- 44/100
- State rank
- #380
- US rank
- #26699
Category grades
Schools grade is shown separately in the Schools card above.
Census & demographics
- Census place
- Star Valley, AZ
- County
- Gila County · 23,382 people
- Metro
- Payson, AZ
- Population (ZIP)
- 23,382
- Household income
- $66,383
- Rent vs Own
- Severe rent burden
- 523.0
Population outlook (Gila County) Hauer SSP2
- Today (2025)
- 50,229 people
- By 2030
- 48,202 · -4.0%
- By 2040
- 44,101 · -12.2%
- By 2050
- 41,041 · -18.3%
- By 2075
- 37,536 · -25.3%
- By 2100
- 32,485 · -35.3%
Race, ethnicity, and origin ACS 2023
- Neighborhood character
- Predominantly White (84%)
- Race & ethnicity
- White 84% Hispanic / Latino 11% Two or more races 8% Native American 1%
- Hispanic origin (detail)
- Mexican 9%
- Common ancestry
- Portuguese 3% Lithuanian 2% Iranian 2%
- Foreign-born
- 3% · Canada
- Languages at home
- 93% English-only · Spanish 5% German/W. Germanic 1%
Political lean MEDSL · Gila
- 2024 margin
- Solid R (+37.6) · D 30.8% · R 68.4%
- 2008→2024 swing
- -9.8pp toward R · 2008: -27.8pp · 2024: -37.6pp
- All cycles
- 2024: R+37.6 2020: R+34.1 2016: R+32.4 2012: R+26.4 2008: R+27.8
Not yet ingested
- Civics
- —
Market trends
- HPI YoY
- ▼ -29.47%
- Current HPI
- 416.4005
- Rent YoY
- —
- Metro
- Payson, AZ
- State GDP YoY
- ▲ 4.54%
- F500 in state
- 20
Industry mix (Fortune 500 HQ in AZ)
| Industry | F500 HQs | Revenue |
|---|---|---|
| Technology | 2 | $13B |
|
||
| Mining / Metals | 1 | $23B |
|
||
| Environmental Services | 1 | $16B |
|
||
| Metals / Steel | 1 | $14B |
|
||
| Technology Distribution | 1 | $9B |
|
||
| Homebuilding | 1 | $8B |
|
||
Price history
-3.4% since first listed2 events — show timeline
- 2026-04-23 Price Changed $140,000 CAAR
- 2026-03-16 Listed $145,000 CAAR
Cash-flow waterfall
monthlySold comps — $/sqft
last 12 mo · ≤1 miLoading sold comps…