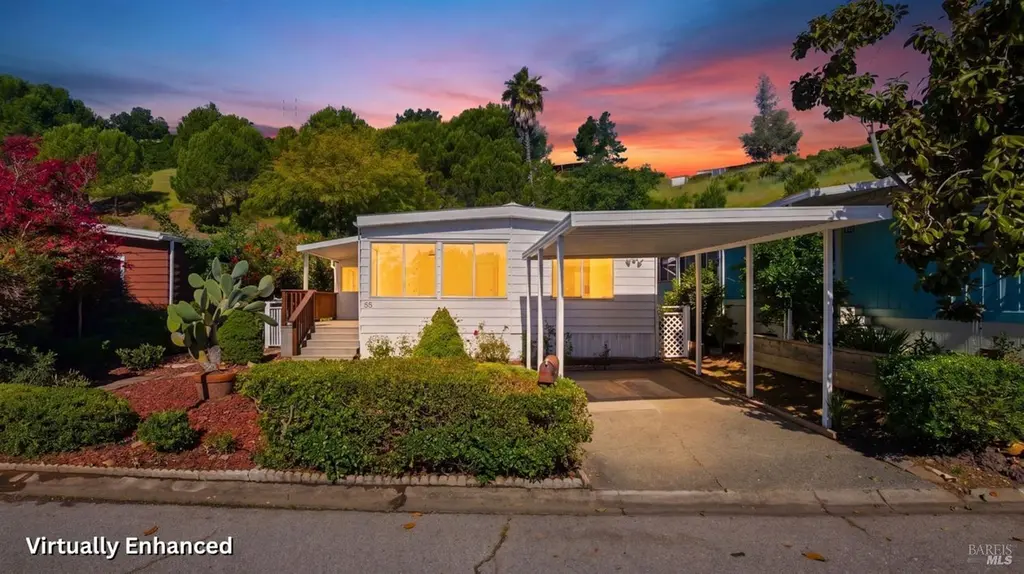
55 Marin Valley Dr · Novato, CA
Flood risk 1/10 · Minimal
- FEMA flood zone
- X (unshaded)
- Chance of flooding over 30 yrs
- 0.0%
- Est. flood insurance / yr
- $507 – $1,088
Fire risk 5/10 · Moderate
- Est. fire insurance / yr
- $659 – $1,223
Heat risk 3/10 · Minor
- Hot days now (above 88°F)
- 7 days/yr
- Hot days in 30 yrs
- 16 days/yr
Wind risk 1/10 · Minimal
- Chance of severe wind over 30 yrs
- —
Air-quality risk 8/10 · Major
- Unhealthy air days now
- 15 days/yr
- Unhealthy air days in 30 yrs
- 15 days/yr
Risk factors via First Street. Map © Google.
Why this score? — see what drove the B grade
The composite is a weighted blend of 9 inputs, each scored 0–100. Each bar is that input's sub-score; the figure is the points it added to the 100-point composite (weight × sub-score).
- Cash flow +27.6/30.0
- ARV discount +14.8/15.0
- DSCR +9.7/10.0
- 1% rule +7.5/10.0
- Schools +4.1/10.0
- Livability +3.6/5.0
- Rent growth +2.8/5.0
- Condition / age +2.5/5.0
- Appreciation +0.0/10.0
$289,000
🖨 Deal sheet 📄 Offer letter ✓ Due diligence
Listing remarks
Located in Marin's coveted 55+ community, 55 Marin Valley Drive is a bright and spacious 2-bedroom, 2-bath home offering comfort, light, and opportunity. Freshly painted inside and out, the home features new wide-plank flooring and updated light fixtures throughout, creating a fresh, modern feel. Generous windows fill the space with natural light, enhancing the open layout and easy flow. The home offers a wonderful blank canvas for a buyer to personalize and make their own. The community itself is a true highlight, with a welcoming clubhouse featuring a saltwater swimming pool, spa, fitness room, and a wide variety of social activities. Walking paths wind through the neighborhood, with natu
Key facts
- Fitness room
- Walking paths
- 2 parking spots
Tags
Property features AI
Finance
- Financial info: Monthly land lease: $702
- HOA & community: No association; Senior community
Exterior
- Parking: Covered parking for 2 vehicles
- Utilities: Public sewer
- Home design: Manufactured in park, double wide
- Construction: Ventura make; KIT manufacturer; Aluminum skirting
- Exterior features: Located in Marin Valley Mobile Country Club (senior community); Land lease in park
Interior
- Bedrooms: 2 bedrooms
- Bathrooms: 2 full bathrooms
- Heating & cooling: Central heating; No built-in cooling
- Interior features: Original and updated/remodeled condition; Tub with shower over
- Laundry & utility: Washer and dryer included
Neighborhood map
What this means for you Summary
Snapshot
- This is a 2-bed/2.0-bath manufactured listed at $289k.
Deal economics
- At list price, monthly cash flow is $860 ($10k/yr) — positive.
- The deal already cash-flows at list — no discount required.
- Meets the 1% rule at list price ($4k rent vs $289k).
- Recommended offer: $280k (3.0% below list) — sets the bar for market timing.
- Cap rate 9.9% vs local median 2.4% in Novato — top-decile yield for the area; either an underpriced asset or a hidden risk that comps aren't pricing in. Stress-test before assuming the spread holds.
Location & tenants
- Location reads 71/100 on livability (#211 in CA) — a middle-class / working-renter tenant base. Strengths: commute A+, employment A+; Watch: amenities D, cost of living F, health & safety F.
- Novato Unified (suburban): math 38% / reading 50% proficiency, ranked #160 of 517 in CA (top 31%) — families likely to look elsewhere, expect single-tenant / working-renter base with shorter leases.
- Market conditions: Rents rising (+1.1%/yr); 75 active listings in the ZIP; 9 comparable units currently listed for rent nearby; rentals leasing fast (median 6d on market — plan ~1-2 weeks tenant-placement turnaround); high-income renter base; 149 units permitted in Marin County in 2024 (5 in 5+ unit buildings).
- This rent runs 36% of the median local income ($121k/yr) — at the standard rent-burdened threshold; future hikes will face affordability resistance.
Forward outlook
- Local home prices are declining (-3.0%/yr); year-one equity from $2k of loan paydown is wiped out by about $9k of value loss. Plan a longer hold.
- Marin County population projected at +9% by 2050 — modest demand growth; plan on rents tracking national, not racing it.
Negotiation context
- It's been on market 56 days — a 3% lower offer ($280k) is reasonable based on typical stale-listing flexibility.
- 2 sale attempts with the ask held roughly flat each time — persistent listings suggest the price (not the market) is what's stuck; bring a comps-based counter.
Risks & watch-outs
- Climate carrying-cost: moderate wildfire risk — expect insurance premiums to compound above CPI over the hold.
Questions for the listing agent
- It's been on market 56 days. Have you received any prior offers? Is the seller open to a 3% concession, seller financing, or rate buy-down credit?
- Built in 1972 — when were the roof, HVAC, electrical panel, plumbing, and water heater last replaced?
- Is there a deadline driving the sale (1031 exchange, divorce, estate, relocation)? That informs how much negotiation room exists.
- What's the average days-on-market for RENTAL listings here right now (not sales)? A rising rental-DOM trend means longer vacancies and softer asking-rent achievability than the comps imply.
- What's the recent tenant-quality profile in this submarket — average credit score on applications, eviction rate, late-payment / NSF rate, and stable-employment percentage? A property-management company in the area should have these aggregated.
- How much new for-sale + rental construction is in the pipeline within 1–3 miles? Heavy new supply typically softens prices + rents 12–24 months out; constrained supply supports both.
Investment metrics
- 1% rule
- 1.25% ✓
- Cap rate
- 9.86%
- Cash-on-cash
- 12.75%
- DSCR
- 1.57
- GRM
- 6.7
CMA / ARV
- ARV (median comp)
- $344,823
- List price
- $289,000
- Delta
- -16.19%
- Verdict
- UNDERPRICED
- Comps
- 7 within 1.0 mi
Show comp detail 12 sales within ~0.75 mi
| Address | Dist | Beds/Ba | Sqft | Sold | Price | $/sf | Match |
|---|---|---|---|---|---|---|---|
| 9 Fallen Leaf Way | 0.13mi | 2/2.0 | 1,344 (-2%) | 0mo | $419,000 | $312 | 91 |
| 10 Fallen Leaf Dr | 0.14mi | 2/2.0 | 1,440 (+5%) | 1mo | $275,000 | $191 | 84 |
| 15 Scenic Dr | 0.21mi | 2/2.0 | 1,440 (+5%) | 3mo | $325,000 | $226 | 79 |
| 28 Marin Valley Dr | 0.13mi | 2/2.0 | 1,440 (+5%) | 14mo | $390,000 | $271 | 73 |
| 133 Panorama Dr | 0.09mi | 2/2.0 | 1,440 (+5%) | 17mo | $326,000 | $226 | 73 |
| 125 Sunrise Ln | 0.07mi | 2/2.0 | 1,440 (+5%) | 18mo | $264,500 | $184 | 73 |
| 22 Marin Valley Dr | 0.17mi | 1/2.0 (-1) | 1,440 (+5%) | 10mo | $355,000 | $247 | 70 |
| 60 Club View Dr | 0.20mi | 2/2.0 | 1,440 (+5%) | 16mo | $165,000 | $115 | 68 |
| 177 Marin Valley Dr | 0.24mi | 2/2.0 | 1,536 (+12%) | 1mo | $466,000 | $303 | 67 |
| 59 Club View Dr | 0.19mi | 2/2.0 | 1,248 (-9%) | 11mo | $279,000 | $224 | 67 |
| 16 Marin Valley Dr | 0.20mi | 2/2.0 | 1,200 (-12%) | 9mo | $350,000 | $292 | 63 |
| 18 Fallen Leaf Way | 0.17mi | 3/2.0 (+1) | 1,200 (-12%) | 14mo | $390,000 | $325 | 55 |
Match score weights: distance 35% · size 25% · config 20% · recency 20%. Top-matched comps best support the ARV.
Projected returns pro-forma
-3.0% appreciation · 1.06% rent growth · sell at horizon
- IRR
- 0.4%
- Equity multiple
- 1.01×
- Total profit
- $1,062
- Equity at exit
- $43,091
- IRR
- 7.9%
- Equity multiple
- 1.55×
- Total profit
- $44,330
- Equity at exit
- $24,987
Cash invested: $80,920 (down + closing). Projections, not guarantees.
Landlord ↔ Tenant lean methodology
- Overall (STATE)
- 18 Strongly Tenant-Friendly
- State California
- 18 Strongly Tenant-Friendly · D+13
- County
- — inherits STATE
- City
- — inherits STATE
ZIP-level market 94949
- Rents YoY
- 1.1%
- Active inventory
- 75
- Price-to-rent
- 6.7×
Monthly cashflow live
- Estimated rent
- $3,617 high interval (Pro) →
- Mortgage (P&I)
- −$1,516
- Tax est. 1.5%
- −$361 /mo · $4,335/yr
- Insurance
- −$120
- HOA
- −$0
- Vacancy / Maint / Mgmt
- −$759
- Net cashflow
- $860
Break-even live
UW: 25.0% down · 7.5% · 30yr · 1.5% tax · 5.0% vac · 8.0% maint · 8.0% mgmt
Financing live
Cash to close
- Down payment
- $72,250
- Closing costs
- $8,670
- Reserves months
- —
- Total cash needed
- —
Loan-product check · same deal, 3 products live
Conventional
25% down · 7.5% · 30yr
- Down + closing
- —
- Monthly P&I
- —
- Monthly cashflow
- —
- DSCR
- —
- Eligible?
- —
Personal DTI + credit; lowest rate.
DSCR
20% down · 8.5% · 30yr
- Down + closing
- —
- Monthly P&I
- —
- Monthly cashflow
- —
- DSCR
- —
- Eligible?
- —
No personal income docs; deal must DSCR.
Hard money
10% down · 12.0% · 12mo
- Down + closing
- —
- Monthly P&I
- —
- Monthly cashflow
- —
- DSCR
- —
- Eligible?
- —
Short-term bridge; refi at stabilization.
Rent comps 9 comps
| Address | Beds | Baths | Sqft | Rent | $/sqft | DOM | Units | Dist |
|---|---|---|---|---|---|---|---|---|
| 102 Redhawk Rd Novato, CA | 3.0 | 2.5 | 1731 | $3,950 | $2.28 | 2d | 1 | 0.81mi |
| 130 Pelican Ln Novato, CA | 2.0 | 2.5 | 1674 | $3,925 | $2.34 | 44d | 1 | 0.81mi |
| 75 Gann Way Novato, CA | 3.0 | 2.5 | 1822 | $5,000 | $2.74 | 15d | 1 | 1.20mi |
| 235 Posada del Sol Novato, CA | 2.0 | 2.0 | 1200 | $3,225 | $2.69 | 2d | 1 | 1.23mi |
| 98 Gann Way Novato, CA | 2.0 | 2.5 | 1428 | $3,950 | $2.77 | 44d | 1 | 1.24mi |
| 158 Roundtree Blvd San Rafael, CA | 3.0 | 2.0 | 1165 | $3,900 | $3.35 | 24d | 1 | 1.28mi |
| 200 Posada del Sol Novato, CA | 2.0 | 1.0–1.5 | 1125 | $2,738 | $2.43 | 2d | 1 | 1.30mi |
| 67 Roundtree Blvd San Rafael, CA | 2.0 | 1.5 | 949 | $3,300 | $3.48 | 5d | 1 | 1.37mi |
| 20 North Ave San Rafael, CA | 1.0–2.0 | 1.0 | 796 | $3,625 | $4.55 | 2d | 3 | 1.39mi |
Listing history 17 events
-
2026-06-18days on market $289,000 Active 56 DOM
-
2026-06-17days on market $289,000 Active 55 DOM
-
2026-06-16days on market $289,000 Active 54 DOM
-
2026-06-15days on market $289,000 Active 53 DOM
-
2026-06-13days on market $289,000 Active 51 DOM
-
2026-06-13days on market $289,000 Active 50 DOM
-
2026-06-09days on market $289,000 Active 47 DOM
-
2026-06-08days on market $289,000 Active 46 DOM
-
2026-06-07days on market $289,000 Active 45 DOM
-
2026-06-04days on market $289,000 Active 42 DOM
-
2026-06-03days on market $289,000 Active 41 DOM
-
2026-06-02days on market $289,000 Active 40 DOM
-
2026-06-01days on market $289,000 Active 39 DOM
-
2026-05-31days on market $289,000 Active 38 DOM
-
2026-04-23$289,000 Active 794-char remark
-
2026-04-21$289,000 Active
-
2009-06-01price $160,000
ⓘ Source: listings_history table (triggers on properties + properties_extension) + one-shot
backfill from property_details.listing_events for pre-trigger history.
Climate risk First Street
- Flood 1/10 Low FEMA zone X (unshaded) · 0% chance over 30 yrs
- Wildfire 5/10 Major
- Heat 3/10 Moderate 7 d/yr ≥88°F today · 16 d/yr by 30 yrs out
- Wind 1/10 Low
- Air quality 8/10 Severe 15 unhealthy d/yr today · 15 by 30 yrs out
Nearby sold comps map
Loading sold comps map…
Walkable amenities ~0.75 mi
Loading nearby amenities…
Taxation est. · year 1
- Rental income
- $43,398
- − Mortgage interest
- −$16,188
- − Property taxes
- −$4,335
- − Insurance
- −$1,445
- − Repairs & maintenance
- −$3,472
- − Management
- −$3,472
- − Depreciation
- −$8,407
- Taxable income
- $6,079
- Est. tax owed @ 24.0%
- −$1,459
- After-tax cash flow
- $8,859/yr
For passive investors: Depreciation is non-cash, so a rental often shows a tax loss while cash-flowing — sheltering income. Rental losses are passive: they offset passive income freely, and up to $25,000/yr can offset ordinary (W-2) income if you actively participate and your MAGI is under $100k (phasing out to $0 by $150k); unused losses carry forward. On sale, claimed depreciation is recaptured at up to 25%, and gains may owe capital-gains tax (a 1031 exchange can defer both). Figures are a year-1 estimate at your 24.0% rate — not tax advice; consult a CPA.
Schools (NCES district)
- District
- Novato Unified
- NCES district ID
- 0627720
- Math proficiency
- 38% ▼ -11.00%
- Reading proficiency
- 50% ▼ -5.00%
- Median HH income
- $84,396
- Composite
- 41.06/100
- National rank
- #3576
- State rank
- #160 of 517 in CA
Livability — Novato
- Score
- 71/100
- State rank
- #211
- US rank
- #6675
Category grades
Schools grade is shown separately in the Schools card above.
Census & demographics
- Census place
- Novato, CA
- County
- Marin County · 243,328 people
- City population
- 59,522
- Metro
- San Francisco-Oakland-Berkeley, CA
- Population (ZIP)
- 17,787
- Household income
- $120,758
- Rent vs Own
- Severe rent burden
- 776.0
Population outlook (Marin County) Hauer SSP2
- Today (2025)
- 276,379 people
- By 2030
- 282,942 · +2.4%
- By 2040
- 292,937 · +6.0%
- By 2050
- 300,449 · +8.7%
- By 2075
- 316,946 · +14.7%
- By 2100
- 303,948 · +10.0%
Race, ethnicity, and origin ACS 2023
- Neighborhood character
- Diverse neighborhood (Simpson 0.61)
- Race & ethnicity
- White 56% Hispanic / Latino 26% Two or more races 16% Asian 7% Black 2% Native American 2%
- Hispanic origin (detail)
- Mexican 12%
- Common ancestry
- Slovak 3% Lithuanian 3% Scotch-Irish 2%
- Foreign-born
- 25% · Canada, China, Vietnam
- Languages at home
- 70% English-only · Spanish 18% Other Indo-European 5% Tagalog/Filipino 2%
Political lean MEDSL · Marin
- 2024 margin
- Solid D (+63.9) · D 80.6% · R 16.7% · Other 2.7%
- 2008→2024 swing
- +6.2pp toward D · 2008: 57.7pp · 2024: 63.9pp
- All cycles
- 2024: D+63.9 2020: D+66.5 2016: D+62.9 2012: D+50.5 2008: D+57.7
Not yet ingested
- Civics
- —
Market trends
- HPI YoY
- ▼ -670.06%
- Current HPI
- 299.6555
- Rent YoY
- ▲ 1.06%
- Metro
- San Francisco-Oakland-Berkeley, CA
- State GDP YoY
- ▲ 3.21%
- F500 in state
- 116
Industry mix (Fortune 500 HQ in CA)
| Industry | F500 HQs | Revenue |
|---|---|---|
| Technology | 27 | $1,492B |
|
||
| Financial Services | 3 | $174B |
|
||
| Retail | 3 | $44B |
|
||
| Insurance | 3 | $26B |
|
||
| Media / Entertainment | 2 | $115B |
|
||
| Pharmaceuticals / Biotech | 2 | $62B |
|
||
Price history
+80.6% since first listed3 events — show timeline
- 2026-04-23 Listed $289,000 BAREIS
- 2026-04-21 Listed $289,000 BAREIS
- 2009-06-01 Price Changed $160,000 BAREIS
Cash-flow waterfall
monthlySold comps — $/sqft
last 12 mo · ≤1 miLoading sold comps…