2780 E 2nd St · Silver Springs, NV
Flood risk 1/10 · Minimal
- FEMA flood zone
- X (unshaded)
- Chance of flooding over 30 yrs
- 0.0%
- Est. flood insurance / yr
- $507 – $1,088
Fire risk 3/10 · Minor
- Est. fire insurance / yr
- $490 – $910
Heat risk 6/10 · Moderate
- Hot days now (above 96°F)
- 7 days/yr
- Hot days in 30 yrs
- 20 days/yr
Wind risk 1/10 · Minimal
- Chance of severe wind over 30 yrs
- —
Air-quality risk 8/10 · Major
- Unhealthy air days now
- 17 days/yr
- Unhealthy air days in 30 yrs
- 17 days/yr
Risk factors via First Street. Map © Google.
Why this score? — see what drove the D grade
The composite is a weighted blend of 9 inputs, each scored 0–100. Each bar is that input's sub-score; the figure is the points it added to the 100-point composite (weight × sub-score).
- Cash flow +10.2/30.0
- Appreciation +8.2/10.0
- ARV discount +7.5/15.0
- Livability +3.2/5.0
- 1% rule +3.0/10.0
- DSCR +2.9/10.0
- Rent growth +2.5/5.0
- Condition / age +2.5/5.0
- Schools +2.4/10.0
$209,000
🖨 Deal sheet (PDF) 📄 Offer letter ✓ Due diligence
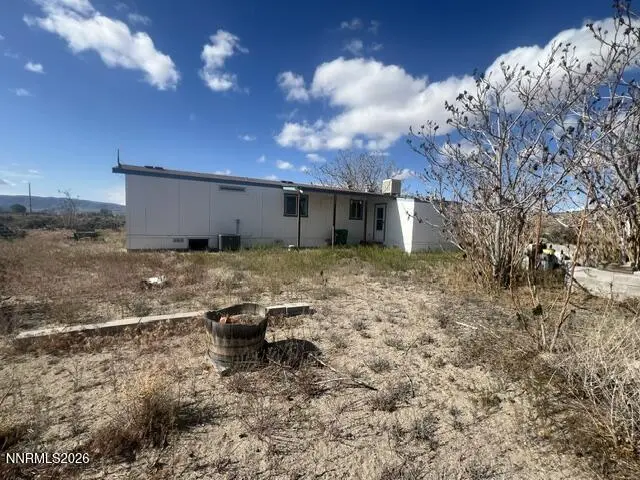
Listing remarks
Enjoy wide-open space and endless potential with this 13+ acre property consisting of three separate parcels in Silver Springs. The property features a 924 sq. ft. single-wide manufactured home and is already equipped with well, septic, power, and a installed backup generator for added peace of mind. Improvements include a horse corral, storage container, and a concrete pad ideal for RV parking or future use. With generous acreage and existing infrastructure, this property offers a unique opportunity for rural living, recreation, or future development. Sale is cash only and as-is. Seller has never occupied the property and has limited knowledge. Close of escrow to be 60 days from offer acce
Key facts
- 13.86 acre lot
- Built 1990
- Listed 44 days
Property features AI
Finance
- Other: Zoning: Rr3t
- HOA & community: Subdivision: Putnam Ph 2; Not a senior community
Exterior
- Parking: No designated parking
- Utilities: Private well water; Septic tank sewer; Electricity connected
- Home design: Manufactured home; One story
- Construction: Wood siding; Composition/shingle roof; Crawl space foundation with brick/mortar and full perimeter
- Exterior features: Full fencing; Corral(s); Shed(s) and storage; Level lot; Desert, mountain and valley views; Private-maintained road access (public frontage)
Interior
- Kitchen: Gas range; Refrigerator
- Flooring: Carpet; Laminate
- Bathrooms: 2 full bathrooms
- Heating & cooling: Forced air heating; Central air conditioning
- Interior features: Entrance foyer; Wood-burning fireplace (1)
- Laundry & utility: Washer hookup; Electric dryer hookup; Laundry located in hall
Neighborhood map
What this means for you Summary
Snapshot
- This is a 2-bed/2.0-bath manufactured listed at $209k.
Deal economics
- At list price, monthly cash flow is $-118 ($-1k/yr) — negative.
- To cash-flow at today's rent, offer at most $192k (8.2% below list).
- To meet the 1% rule (rent ≥ 1% of price), the offer needs to be $168k (19.7% below list).
- Recommended offer: $168k (19.7% below list) — sets the bar for 1% rule.
- Cap rate 5.6% vs local median 3.7% in Silver Springs — top-decile yield for the area; either an underpriced asset or a hidden risk that comps aren't pricing in. Stress-test before assuming the spread holds.
Location & tenants
- Location reads 65/100 on livability (#42 in NV) — a middle-class / working-renter tenant base. Strengths: cost of living A+, housing A+, health & safety A-; Watch: amenities F, commute F, employment D-.
- Lyon County School District (town): math 21% / reading 35% proficiency, ranked #14 of 17 in NV (top 82%) — low school quality limits family demand, transient renter base, plan for 1-2y turnover.
- Zoned schools: Silver Stage Middle School (math 18% / reading 33%, grade F, #62 of 109 statewide, top 58%, 329 students, 100% FRL); Silver Stage High School (math 17% / reading 42%, grade F, #67 of 131 statewide, top 53%, 333 students, 100% FRL) — zoned schools average 100% FRL vs 42% district-wide (58 pts higher); higher-poverty schools than district average — tighter screening recommended.
- Market conditions: 247 active listings in the ZIP; 297 units permitted in Lyon County in 2024 (80 in 5+ unit buildings).
Forward outlook
- In year one you build about $15k of equity ($1k loan paydown + $13k appreciation (6.4% local appreciation)).
- Lyon County population projected at -20% by 2050 — secular population decline; favor cash flow + early exit over multi-decade hold.
- By year 3, paydown + projected appreciation supports a ~$37k cash-out refi (75% LTV) — recoverable capital for the next deal without selling this one.
Negotiation context
- It's been on market 44 days — a 3% lower offer ($203k) is reasonable based on typical stale-listing flexibility.
- 2 sale attempts since 2y ago with the ask held roughly flat each time — persistent listings suggest the price (not the market) is what's stuck; bring a comps-based counter.
Risks & watch-outs
- Climate carrying-cost: extreme-heat days projected 7→20/yr by 2055 (HVAC capex compounding) — expect insurance premiums to compound above CPI over the hold.
Questions for the listing agent
- What do current leases actually rent for vs. the listed asking? Can we see a recent rent roll and the last 12 months of T-12 income?
- It's been on market 44 days. Have you received any prior offers? Is the seller open to a 20% concession, seller financing, or rate buy-down credit?
- Is there a deadline driving the sale (1031 exchange, divorce, estate, relocation)? That informs how much negotiation room exists.
- Schools are F-rated, which usually means shorter tenancies and higher turnover. Who's the typical renter profile here, and what's been the actual vacancy rate?
- The area grade is low — what's the realistic commute time and amenity access for the typical tenant pool here? Any planned neighborhood developments (good or bad) we should know about?
- What's the average days-on-market for RENTAL listings here right now (not sales)? A rising rental-DOM trend means longer vacancies and softer asking-rent achievability than the comps imply.
- What's the recent tenant-quality profile in this submarket — average credit score on applications, eviction rate, late-payment / NSF rate, and stable-employment percentage? A property-management company in the area should have these aggregated.
- How much new for-sale + rental construction is in the pipeline within 1–3 miles? Heavy new supply typically softens prices + rents 12–24 months out; constrained supply supports both.
Investment metrics
- 1% rule
- 0.80% ✗
- Cap rate
- 5.61%
- Cash-on-cash
- -2.43%
- DSCR
- 0.89
- GRM
- 10.4
CMA / ARV
No comps found within radius.
Projected returns pro-forma
6.36% appreciation · 3.0% rent growth · sell at horizon
- IRR
- 14.3%
- Equity multiple
- 1.98×
- Total profit
- $57,332
- Equity at exit
- $136,182
- IRR
- 14.5%
- Equity multiple
- 3.96×
- Total profit
- $173,499
- Equity at exit
- $251,209
Cash invested: $58,520 (down + closing). Projections, not guarantees.
Landlord ↔ Tenant lean methodology
- Overall (STATE)
- 71 Landlord-Friendly
- State Nevada
- 71 Landlord-Friendly · R+1
- County
- — inherits STATE
- City
- — inherits STATE
ZIP-level market 89429
- Home prices YoY
- 2.4%
- Active inventory
- 247
- Price-to-rent
- 10.4×
Monthly cashflow live
- Estimated rent
- $1,678 medium interval (Pro) →
- Mortgage (P&I)
- −$1,096
- Tax est. 1.5%
- −$261 /mo · $3,135/yr
- Insurance
- −$87
- HOA
- −$0
- Vacancy / Maint / Mgmt
- −$352
- Net cashflow
- $-118
Break-even live
Sensitivity live
| Price | -10% $26 | -5% $-46 | +0% $-118 | +5% $-191 | +10% $-263 |
|---|---|---|---|---|---|
| Rent | -10% $-251 | -5% $-185 | +0% $-118 | +5% $-52 | +10% $14 |
| Rate | -1.0pp $-13 | -0.5pp $-65 | base $-118 | +0.5pp $-173 | +1.0pp $-228 |
UW: 25.0% down · 7.5% · 30yr · 1.5% tax · 5.0% vac · 8.0% maint · 8.0% mgmt
Financing live
Cash to close
- Down payment
- $52,250
- Closing costs
- $6,270
- Reserves months
- —
- Total cash needed
- —
Loan-product check · same deal, 3 products live
Conventional
25% down · 7.5% · 30yr
- Down + closing
- —
- Monthly P&I
- —
- Monthly cashflow
- —
- DSCR
- —
- Eligible?
- —
Personal DTI + credit; lowest rate.
DSCR
20% down · 8.5% · 30yr
- Down + closing
- —
- Monthly P&I
- —
- Monthly cashflow
- —
- DSCR
- —
- Eligible?
- —
No personal income docs; deal must DSCR.
Hard money
10% down · 12.0% · 12mo
- Down + closing
- —
- Monthly P&I
- —
- Monthly cashflow
- —
- DSCR
- —
- Eligible?
- —
Short-term bridge; refi at stabilization.
Listing history 19 events
-
2026-06-22days on market $209,000 Active 44 DOM
-
2026-06-18days on market $209,000 Active 41 DOM
-
2026-06-17days on market $209,000 Active 40 DOM
-
2026-06-16days on market $209,000 Active 39 DOM
-
2026-06-15days on market $209,000 Active 38 DOM
-
2026-06-14days on market $209,000 Active 36 DOM
-
2026-06-13days on market $209,000 Active 35 DOM
-
2026-06-10days on market $209,000 Active 33 DOM
-
2026-06-09days on market $209,000 Active 32 DOM
-
2026-06-08days on market $209,000 Active 31 DOM
-
2026-06-07days on market $209,000 Active 30 DOM
-
2026-06-03days on market $209,000 Active 26 DOM
-
2026-06-02days on market $209,000 Active 25 DOM
-
2026-06-01days on market $209,000 Active 24 DOM
-
2026-05-31days on market $209,000 Active 23 DOM
-
2026-05-30days on market $209,000 Active 22 DOM
-
2026-05-08$209,000 Active 1256-char remark
-
2025-04-02historical Under Contract-Show
-
2024-11-15$225,000 Active - New
ⓘ Source: listings_history table (triggers on properties + properties_extension) + one-shot
backfill from property_details.listing_events for pre-trigger history.
Climate risk First Street
- Flood 1/10 Low FEMA zone X (unshaded) · 0% chance over 30 yrs
- Wildfire 3/10 Moderate
- Heat 6/10 Major 7 d/yr ≥96°F today · 20 d/yr by 30 yrs out
- Wind 1/10 Low
- Air quality 8/10 Severe 17 unhealthy d/yr today · 17 by 30 yrs out
Nearby sold comps map
Loading sold comps map…
Walkable amenities ~0.75 mi
Loading nearby amenities…
Taxation est. · year 1
- Rental income
- $20,140
- − Mortgage interest
- −$11,707
- − Property taxes
- −$3,135
- − Insurance
- −$1,045
- − Repairs & maintenance
- −$1,611
- − Management
- −$1,611
- − Depreciation
- −$6,080
- Taxable loss
- −$5,050
- Est. tax savings @ 24.0%
- +$1,212
- After-tax cash flow
- $-210/yr
For passive investors: Depreciation is non-cash, so a rental often shows a tax loss while cash-flowing — sheltering income. Rental losses are passive: they offset passive income freely, and up to $25,000/yr can offset ordinary (W-2) income if you actively participate and your MAGI is under $100k (phasing out to $0 by $150k); unused losses carry forward. On sale, claimed depreciation is recaptured at up to 25%, and gains may owe capital-gains tax (a 1031 exchange can defer both). Figures are a year-1 estimate at your 24.0% rate — not tax advice; consult a CPA.
Schools (NCES district)
- District
- Lyon County School District
- NCES district ID
- 3200300
- Math proficiency
- 21% ▼ -11.00%
- Reading proficiency
- 35% ▼ -7.00%
- Median HH income
- $48,197
- Composite
- 24.32/100
- National rank
- #7707
- State rank
- #14 of 17 in NV
Livability — Silver Springs
- Score
- 65/100
- State rank
- #42
- US rank
- #13362
Category grades
Schools grade is shown separately in the Schools card above.
Census & demographics
- Census place
- Silver Springs, NV
- City population
- 7,949
- Population (ZIP)
- 7,949
Population outlook (Lyon County) Hauer SSP2
- Today (2025)
- 51,655 people
- By 2030
- 50,194 · -2.8%
- By 2040
- 46,155 · -10.6%
- By 2050
- 41,580 · -19.5%
- By 2075
- 32,687 · -36.7%
- By 2100
- 24,111 · -53.3%
Race, ethnicity, and origin ACS 2023
- Neighborhood character
- Predominantly White (83%)
- Race & ethnicity
- White 83% Two or more races 8% Hispanic / Latino 8% Native American 2%
- Hispanic origin (detail)
- Mexican 7%
- Common ancestry
- Slovak 3% Lithuanian 2% Italian 2%
- Foreign-born
- 5% · Canada, China
- Languages at home
- 92% English-only · Spanish 5% Arabic 1% Chinese 1%
Political lean MEDSL · Lyon
- 2024 margin
- Solid R (+44.4) · D 26.7% · R 71.1% · Other 2.2%
- 2008→2024 swing
- -26.5pp toward R · 2008: -17.9pp · 2024: -44.4pp
- All cycles
- 2024: R+44.4 2020: R+41.1 2016: R+41.5 2012: R+28.6 2008: R+17.9
Not yet ingested
- Civics
- —
Market trends
- HPI YoY
- ▲ 6.36%
- Current HPI
- 271.5945
- Rent YoY
- —
- Metro
- —
- State GDP YoY
- ▲ 3.08%
- F500 in state
- 6
Industry mix (Fortune 500 HQ in NV)
| Industry | F500 HQs | Revenue |
|---|---|---|
| Hotels / Casinos | 3 | $36B |
|
||
Price history
-7.1% since first listed3 events — show timeline
- 2026-05-08 Listed $209,000 NNRMLS
- 2025-04-02 Contingent — NNRMLS
- 2024-11-15 Listed $225,000 NNRMLS
Property tax history
+6.3%/yrLatest (2025): $335 · +3.0% YoY. Source: county tax records.
Cash-flow waterfall
monthlySold comps — $/sqft
last 12 mo · ≤1 miLoading sold comps…