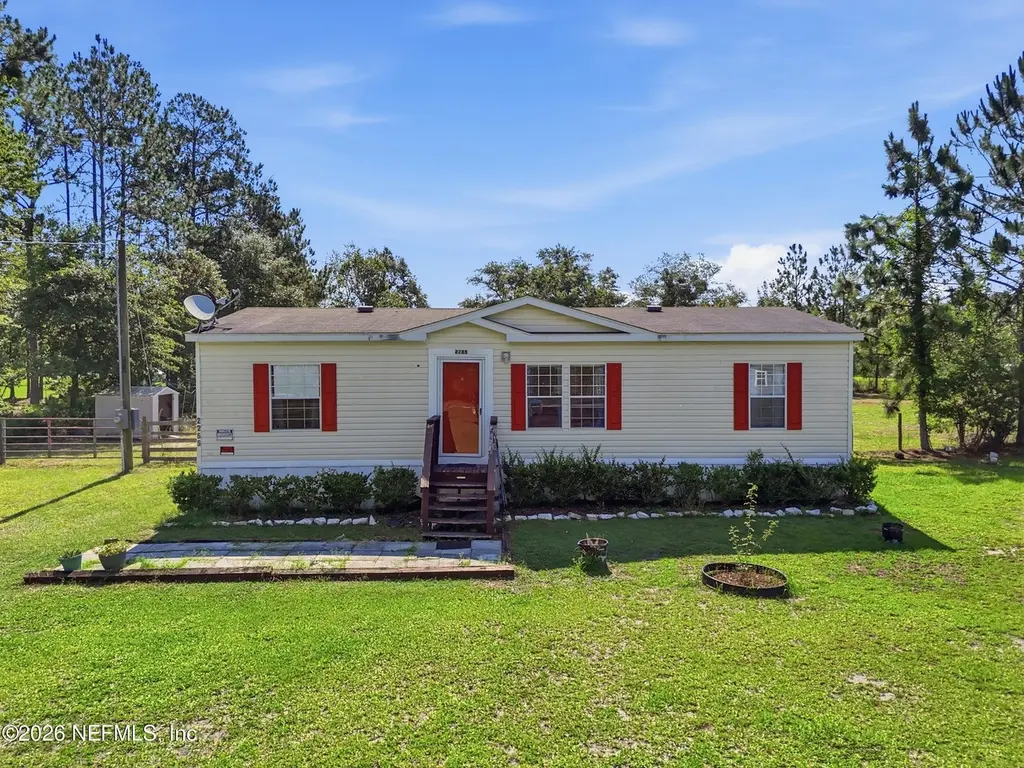
2285 Barrage Ct · Middleburg, FL
Flood risk 1/10 · Minimal
- FEMA flood zone
- X (unshaded)
- Chance of flooding over 30 yrs
- 0.0%
- Est. flood insurance / yr
- $507 – $1,088
Fire risk 7/10 · Major
- Est. fire insurance / yr
- $947 – $1,759
Heat risk 8/10 · Major
- Hot days now (above 109°F)
- 7 days/yr
- Hot days in 30 yrs
- 19 days/yr
Wind risk 9/10 · Severe
- Chance of severe wind over 30 yrs
- 99.0%
Air-quality risk 3/10 · Minor
- Unhealthy air days now
- 3 days/yr
- Unhealthy air days in 30 yrs
- 3 days/yr
Risk factors via First Street. Map © Google.
Why this score? — see what drove the C grade
The composite is a weighted blend of 9 inputs, each scored 0–100. Each bar is that input's sub-score; the figure is the points it added to the 100-point composite (weight × sub-score).
- Cash flow +19.5/30.0
- ARV discount +12.6/15.0
- DSCR +6.1/10.0
- Schools +5.1/10.0
- 1% rule +3.8/10.0
- Rent growth +3.3/5.0
- Livability +3.2/5.0
- Condition / age +2.5/5.0
- Appreciation +0.0/10.0
$217,500
🖨 Deal sheet 📄 Offer letter ✓ Due diligence
Listing remarks MLS
PENDING - TAKING BACK UP OFFERS. This 3 bedroom, 2 bath home just built in 2015 offers you plenty of space without losing it's cozy feel. This home sits on over an acre of land with a huge back yard and is located off of a quiet private road. Completely renovated top to bottom this home features new water-resistant laminate flooring and freshly painted/textured walls throughout as well as new appliances and new wall to wall carpeting. It is just 25 minutes to Orange Park and 45 minutes to Jacksonville making it a central location between these two major cities. Home is Tenant occupied until October 1st. Please do not disturb the tenant
Key facts
- Quiet private road
- Huge back yard
- Over an acre of land
Tags
Property features AI
Finance
- HOA & community: Not a senior community
Exterior
- Parking: Other parking
- Utilities: Septic tank; Electricity connected
- Home design: Mobile home
- Exterior features: 1.31-acre lot; Residential use; No private pool
Interior
- Kitchen: Electric oven; Refrigerator
- Bedrooms: 3 bedrooms
- Bathrooms: 2 full bathrooms
- Interior features: Electric oven; Refrigerator; Central heating and central air
Neighborhood map
What this means for you Summary
Snapshot
- This is a 3-bed/2.0-bath manufactured listed at $218k.
Deal economics
- At list price, monthly cash flow is $245 ($3k/yr) — positive.
- The deal already cash-flows at list — no discount required.
- To meet the 1% rule (rent ≥ 1% of price), the offer needs to be $192k (11.6% below list).
- Recommended offer: $192k (11.6% below list) — sets the bar for 1% rule.
- Cap rate 7.6% vs local median 3.8% in Middleburg — top-decile yield for the area; either an underpriced asset or a hidden risk that comps aren't pricing in. Stress-test before assuming the spread holds.
Location & tenants
- Location reads 65/100 on livability (#657 in FL) — a middle-class / working-renter tenant base. Strengths: cost of living A+, housing A+; Watch: amenities F, commute F, health & safety F.
- Clay (suburban): math 58% / reading 59% proficiency, ranked #14 of 73 in FL (top 19%) — acceptable for families but not a draw, mixed tenant base, ~2y average lease.
- Market conditions: Rents rising (+3.4%/yr); 601 active listings in the ZIP; 1 comparable units currently listed for rent nearby; solid renter incomes; 1,876 units permitted in Clay County in 2024 (14 in 5+ unit buildings).
Forward outlook
- Local home prices are declining (-3.0%/yr); year-one equity from $2k of loan paydown is wiped out by about $7k of value loss. Plan a longer hold.
- Clay County population projected at +19% by 2050 — long-run rental-demand tailwind backs the buy-and-hold thesis.
Negotiation context
- Only 6 days on market — expect competitive offers; lowballing is unlikely to land.
- 5 sale attempts since 10y ago with the ask held roughly flat each time — persistent listings suggest the price (not the market) is what's stuck; bring a comps-based counter.
- Current owner paid $125k; list at $218k implies a 74% gain — meaningful room to come down on a strong offer.
Risks & watch-outs
- Climate carrying-cost: severe wind risk, 99% chance of damaging wind over 30y; major wildfire risk; extreme-heat days projected 7→19/yr by 2055 (HVAC capex compounding) — expect insurance premiums to compound above CPI over the hold.
Questions for the listing agent
- Is there a deadline driving the sale (1031 exchange, divorce, estate, relocation)? That informs how much negotiation room exists.
- Schools are B-rated — typically a magnet for longer-tenancy family renters. What's the average tenant stay here, and is there a school-zone premium baked into asking?
- What's the average days-on-market for RENTAL listings here right now (not sales)? A rising rental-DOM trend means longer vacancies and softer asking-rent achievability than the comps imply.
- What's the recent tenant-quality profile in this submarket — average credit score on applications, eviction rate, late-payment / NSF rate, and stable-employment percentage? A property-management company in the area should have these aggregated.
- How much new for-sale + rental construction is in the pipeline within 1–3 miles? Heavy new supply typically softens prices + rents 12–24 months out; constrained supply supports both.
Investment metrics
- 1% rule
- 0.88% ✗
- Cap rate
- 7.65%
- Cash-on-cash
- 4.83%
- DSCR
- 1.21
- GRM
- 9.4
CMA / ARV
- ARV (on-the-fly)
- $245,430
- Comps found
- 4
Show comp detail 4 sales within ~0.75 mi
| Address | Dist | Beds/Ba | Sqft | Sold | Price | $/sf | Match |
|---|---|---|---|---|---|---|---|
| 4325 Angora St | 0.20mi | 3/2.0 | 1,296 (+7%) | 19mo | $267,000 | $206 | 63 |
| 63 Yucca St | 0.45mi | 3/2.0 | 1,232 (+1%) | 24mo | $249,000 | $202 | 57 |
| 4497 Peppergrass St | 0.47mi | 2/2.0 (-1) | 1,269 (+4%) | 13mo | $200,000 | $158 | 55 |
| 4542 Mayflower St | 0.61mi | 3/2.0 | 1,248 (+3%) | 22mo | $240,000 | $192 | 49 |
Match score weights: distance 35% · size 25% · config 20% · recency 20%. Top-matched comps best support the ARV.
Projected returns pro-forma
-3.0% appreciation · 3.35% rent growth · sell at horizon
- IRR
- -8.5%
- Equity multiple
- 0.69×
- Total profit
- $-19,066
- Equity at exit
- $32,430
- IRR
- 1.3%
- Equity multiple
- 1.10×
- Total profit
- $5,851
- Equity at exit
- $18,805
Cash invested: $60,900 (down + closing). Projections, not guarantees.
Landlord ↔ Tenant lean methodology
- Overall (STATE)
- 87 Strongly Landlord-Friendly
- State Florida
- 87 Strongly Landlord-Friendly · R+3
- County
- — inherits STATE
- City
- — inherits STATE
ZIP-level market 32068
- Home prices YoY
- -27.5%
- Rents YoY
- 3.4%
- Active inventory
- 601
- Price-to-rent
- 9.4×
Monthly cashflow live
- Estimated rent
- $1,922 medium interval (Pro) →
- Mortgage (P&I)
- −$1,141
- Tax from tax record
- −$42 /mo · $502/yr
- Insurance
- −$91
- HOA
- −$0
- Vacancy / Maint / Mgmt
- −$404
- Net cashflow
- $245
Break-even live
UW: 25.0% down · 7.5% · 30yr · 1.5% tax · 5.0% vac · 8.0% maint · 8.0% mgmt
Financing live
Cash to close
- Down payment
- $54,375
- Closing costs
- $6,525
- Reserves months
- —
- Total cash needed
- —
Loan-product check · same deal, 3 products live
Conventional
25% down · 7.5% · 30yr
- Down + closing
- —
- Monthly P&I
- —
- Monthly cashflow
- —
- DSCR
- —
- Eligible?
- —
Personal DTI + credit; lowest rate.
DSCR
20% down · 8.5% · 30yr
- Down + closing
- —
- Monthly P&I
- —
- Monthly cashflow
- —
- DSCR
- —
- Eligible?
- —
No personal income docs; deal must DSCR.
Hard money
10% down · 12.0% · 12mo
- Down + closing
- —
- Monthly P&I
- —
- Monthly cashflow
- —
- DSCR
- —
- Eligible?
- —
Short-term bridge; refi at stabilization.
Rent comps 1 comps
| Address | Beds | Baths | Sqft | Rent | $/sqft | DOM | Units | Dist |
|---|---|---|---|---|---|---|---|---|
| 4027 Everett Ave Unit C Middleburg, FL | 2.0 | 1.0 | 950 | $1,400 | $1.47 | 23d | 1 | 1.50mi |
Listing history 6 events
-
2026-06-18days on market $217,500 Active 6 DOM
-
2026-06-17days on market $217,500 Active 5 DOM
-
2026-06-16days on market $217,500 Active 4 DOM
-
2026-06-15days on market $217,500 Active 3 DOM
-
2026-06-13remarks 295-char remark
-
2026-06-13$217,500 Active 1 DOM
ⓘ Source: listings_history table (triggers on properties + properties_extension) + one-shot
backfill from property_details.listing_events for pre-trigger history.
Tax reassessment forecast FL · Resets to sale price
- Current annual tax
- $502 · $42/mo
- Projected year-2 tax
- $1,805 · $150/mo
- Expected delta
- +$1,303/yr (+$109/mo · 259.4%)
ⓘ Screening estimate from a state-policy table — verify with the county assessor before closing.
Climate risk First Street
- Flood 1/10 Low FEMA zone X (unshaded) · 0% chance over 30 yrs
- Wildfire 7/10 Severe
- Heat 8/10 Severe 7 d/yr ≥109°F today · 19 d/yr by 30 yrs out
- Wind 9/10 Extreme 99% chance of damaging wind over 30 yrs
- Air quality 3/10 Moderate 3 unhealthy d/yr today · 3 by 30 yrs out
Nearby sold comps map
Loading sold comps map…
Walkable amenities ~0.75 mi
Loading nearby amenities…
Taxation est. · year 1
- Rental income
- $23,061
- − Mortgage interest
- −$12,183
- − Property taxes
- −$502
- − Insurance
- −$1,088
- − Repairs & maintenance
- −$1,845
- − Management
- −$1,845
- − Depreciation
- −$6,327
- Taxable loss
- −$729
- Est. tax savings @ 24.0%
- +$175
- After-tax cash flow
- $3,116/yr
For passive investors: Depreciation is non-cash, so a rental often shows a tax loss while cash-flowing — sheltering income. Rental losses are passive: they offset passive income freely, and up to $25,000/yr can offset ordinary (W-2) income if you actively participate and your MAGI is under $100k (phasing out to $0 by $150k); unused losses carry forward. On sale, claimed depreciation is recaptured at up to 25%, and gains may owe capital-gains tax (a 1031 exchange can defer both). Figures are a year-1 estimate at your 24.0% rate — not tax advice; consult a CPA.
Schools (NCES district)
- District
- Clay
- NCES district ID
- 1200300
- Math proficiency
- 58% ▼ -8.00%
- Reading proficiency
- 59% ▼ -3.00%
- Median HH income
- $59,379
- Composite
- 50.73/100
- National rank
- #1815
- State rank
- #14 of 73 in FL
Livability — Middleburg
- Score
- 65/100
- State rank
- #657
- US rank
- #13174
Category grades
Schools grade is shown separately in the Schools card above.
Census & demographics
- Census place
- Middleburg, FL
- County
- Clay County · 208,450 people
- Metro
- Jacksonville, FL
- Population (ZIP)
- 58,983
- Household income
- $84,431
- Rent vs Own
- Severe rent burden
- 975.0
Population outlook (Clay County) Hauer SSP2
- Today (2025)
- 230,495 people
- By 2030
- 242,427 · +5.2%
- By 2040
- 262,244 · +13.8%
- By 2050
- 275,148 · +19.4%
- By 2075
- 295,397 · +28.2%
- By 2100
- 287,592 · +24.8%
Race, ethnicity, and origin ACS 2023
- Neighborhood character
- Predominantly White (74%)
- Race & ethnicity
- White 74% Hispanic / Latino 13% Two or more races 10% Black 7%
- Hispanic origin (detail)
- Mexican 2% Puerto Rican 5%
- Common ancestry
- Slovak 2% Romanian 2% Lithuanian 2%
- Foreign-born
- 7% · Canada, Jamaica
- Languages at home
- 87% English-only · Spanish 9% Arabic 1% German/W. Germanic 1%
Political lean MEDSL · Clay
- 2024 margin
- Solid R (+39.3) · D 29.9% · R 69.2%
- 2008→2024 swing
- +3.6pp toward D · 2008: -42.8pp · 2024: -39.3pp
- All cycles
- 2024: R+39.3 2020: R+37.1 2016: R+44.3 2012: R+45.8 2008: R+42.8
Not yet ingested
- Civics
- —
Market trends
- HPI YoY
- ▼ -115.99%
- Current HPI
- 305.2531
- Rent YoY
- ▲ 3.35%
- Metro
- Jacksonville, FL
- State GDP YoY
- ▲ 3.28%
- F500 in state
- 36
Industry mix (Fortune 500 HQ in FL)
| Industry | F500 HQs | Revenue |
|---|---|---|
| Industrial Technology | 2 | $29B |
|
||
| Insurance | 2 | $17B |
|
||
| Retail | 1 | $60B |
|
||
| Technology Distribution | 1 | $58B |
|
||
| Homebuilding | 1 | $35B |
|
||
| Technology Manufacturing | 1 | $35B |
|
||
Price history
+2053.5% since first listed18 events — show timeline
- 2026-06-12 Listed $217,500 realMLS
- 2019-11-18 Sold (Public Records) $125,000 Public Records
- 2019-11-13 Sold (MLS) $125,000 realMLS
- 2019-10-07 Pending — realMLS
- 2019-09-13 Listed $125,000 realMLS
- 2018-12-05 Listing Removed — realMLS
- 2018-10-29 Relisted — realMLS
- 2018-10-23 Pending — realMLS
- 2018-10-15 Listed $125,000 realMLS
- 2016-12-05 Listing Removed — realMLS
- 2016-11-23 Price Changed $75,500 realMLS
- 2016-10-14 Price Changed $79,900 realMLS
- 2016-08-11 Listed $99,999 realMLS
- 2016-08-11 Price Changed $89,900 realMLS
- 2016-08-11 Price Changed $83,900 realMLS
- 2015-04-21 Sold (Public Records) $26,500 Public Records
- 2003-06-10 Sold (Public Records) $32,090 Public Records
- 2002-10-01 Sold (Public Records) $10,100 Public Records
Property tax history
+1.2%/yrLatest (2025): $502 · +2.0% YoY. Source: county tax records.
Cash-flow waterfall
monthlySold comps — $/sqft
last 12 mo · ≤1 miLoading sold comps…