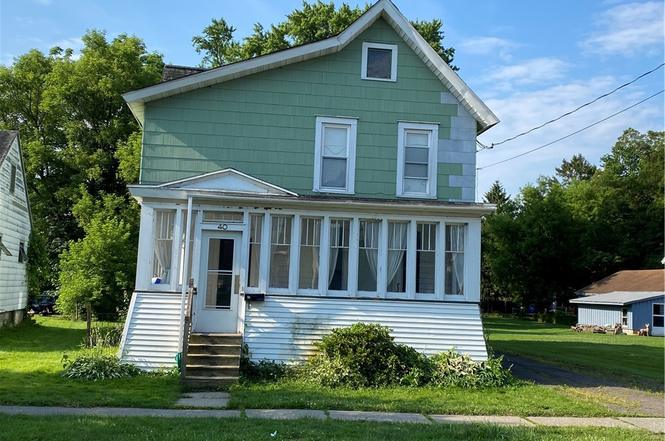
40 Brown Ave · Norwich, NY
Flood risk 4/10 · Minor
- FEMA flood zone
- X (unshaded)
- Chance of flooding over 30 yrs
- 0.22%
- Est. flood insurance / yr
- $473 – $860
Fire risk 3/10 · Minor
- Est. fire insurance / yr
- $691 – $1,283
Heat risk 3/10 · Minor
- Hot days now (above 94°F)
- 7 days/yr
- Hot days in 30 yrs
- 17 days/yr
Wind risk 2/10 · Minimal
- Chance of severe wind over 30 yrs
- 1.0%
Air-quality risk 1/10 · Minimal
- Unhealthy air days now
- 0 days/yr
- Unhealthy air days in 30 yrs
- 0 days/yr
Risk factors via First Street. Map © Google.
Why this score? — see what drove the A grade
The composite is a weighted blend of 9 inputs, each scored 0–100. Each bar is that input's sub-score; the figure is the points it added to the 100-point composite (weight × sub-score).
- Cash flow +30.0/30.0
- ARV discount +15.0/15.0
- 1% rule +10.0/10.0
- DSCR +10.0/10.0
- Appreciation +10.0/10.0
- Schools +3.6/10.0
- Livability +3.5/5.0
- Rent growth +2.5/5.0
- Condition / age +2.5/5.0
$75,000
🖨 Deal sheet (PDF) 📄 Offer letter ✓ Due diligence
Listing remarks
Great Opportunity!!! Over $10,000 of Improvements made!! - New Boiler installed in October 2025. - Dunkirk, high efficiency boiler. This spacious, 2-story, four-bedroom, one and a half bath residence features newer windows throughout, bringing natural light while improving energy efficiency. The home offers a comfortable layout, and some essential roof repairs were completed in 2014. A new sump pump was installed in the basement. All appliances will stay with the property including electric oven, refrigerator, washer and dryer. With a relatively spacious, partially enclosed back yard, you can enjoy peaceful living on a quiet neighborhood street. Conveniently located within walking distance
Key facts
- Newer windows
- 8,100 sq ft lot
- Garage
Tags
Neighborhood map
What this means for you Summary
Snapshot
- This is a 4-bed/2.0-bath single-family listed at $75k.
Deal economics
- At list price, monthly cash flow is $551 ($7k/yr) — positive.
- The deal already cash-flows at list — no discount required.
- Meets the 1% rule at list price ($2k rent vs $75k).
- Recommended offer: $66k (12.0% below list) — sets the bar for market timing.
Location & tenants
- Location reads 70/100 on livability (#447 in NY) — a middle-class / working-renter tenant base. Strengths: cost of living A+, housing A+, health & safety A+; Watch: crime D, amenities F, commute F.
- Norwich City School District (town): math 42% / reading 43% proficiency, ranked #498 of 590 in NY (top 84%) — families likely to look elsewhere, expect single-tenant / working-renter base with shorter leases.
- Zoned schools: Stanford J Gibson Primary School (400 students, 52% FRL); Norwich Middle School (math 34% / reading 48%, grade F, #402 of 729 statewide, top 56%, 381 students, 59% FRL); Norwich High School (math 92% / reading 75%, grade A, #409 of 1,100 statewide, top 39%, 546 students, 48% FRL).
- Zoned-school proficiency averages 62% at this address vs 42% district-wide (+20 pts) — the actual schools serving this property are materially stronger than the Norwich City School District average implies; a family-tenant draw the district grade alone would hide.
- Market conditions: 84 active listings in the ZIP; 151 units permitted in Chenango County in 2024 (96 in 5+ unit buildings).
Forward outlook
- In year one you build about $8k of equity ($519 loan paydown + $8k appreciation (10.0% local appreciation)).
- Chenango County population projected at -26% by 2050 — secular population decline; favor cash flow + early exit over multi-decade hold.
- At projected returns (10.0% appreciation + 3.0% rent growth), your $21k cash investment doubles in ~2 years — after that, you're playing with house money.
- By year 5, paydown + projected appreciation supports a ~$37k cash-out refi (75% LTV) — recoverable capital for the next deal without selling this one.
Negotiation context
- It's been on market 325 days — a 12% lower offer ($66k) is reasonable based on typical stale-listing flexibility.
- 7 sale attempts since 19y ago; this cycle's ask has dropped $20k (21%) from the opening price — seller is motivated, your offer sets the floor, not the list.
- Current owner paid $25k; list at $75k implies a 200% gain — meaningful room to come down on a strong offer.
Risks & watch-outs
- Watch-outs: property tax is 3.7% of price; built in 1900 — expect roof / HVAC / electrical / plumbing capex.
Questions for the listing agent
- It's been on market 325 days. Have you received any prior offers? Is the seller open to a 12% concession, seller financing, or rate buy-down credit?
- Built in 1900 — when were the roof, HVAC, electrical panel, plumbing, and water heater last replaced?
- Property tax is high relative to price — has the assessment been appealed recently, and will the sale trigger a re-assessment?
- Why hasn't it sold? Are there any deal-killer items the seller is aware of (foundation, flood, title, zoning, code violations)?
- Is there a deadline driving the sale (1031 exchange, divorce, estate, relocation)? That informs how much negotiation room exists.
- Crime grade is D in this area — have there been break-ins, vandalism, or insurance claims at this property in the last 3 years? What carrier currently insures it and at what premium?
- What's the average days-on-market for RENTAL listings here right now (not sales)? A rising rental-DOM trend means longer vacancies and softer asking-rent achievability than the comps imply.
- What's the recent tenant-quality profile in this submarket — average credit score on applications, eviction rate, late-payment / NSF rate, and stable-employment percentage? A property-management company in the area should have these aggregated.
- How much new for-sale + rental construction is in the pipeline within 1–3 miles? Heavy new supply typically softens prices + rents 12–24 months out; constrained supply supports both.
Investment metrics
- 1% rule
- 2.04% ✓
- Cap rate
- 15.12%
- Cash-on-cash
- 31.51%
- DSCR
- 2.40
- GRM
- 4.1
CMA / ARV
- ARV (on-the-fly)
- $139,542
- Comps found
- 12
Show comp detail 12 sales within ~0.75 mi
| Address | Dist | Beds/Ba | Sqft | Sold | Price | $/sf | Match |
|---|---|---|---|---|---|---|---|
| 29 Birdsall St | 0.20mi | 4/1.5 | 1,770 (-1%) | 7mo | $50,000 | $28 | 81 |
| 6 Hickory St | 0.40mi | 3/2.0 (-1) | 1,696 (-5%) | 3mo | $125,000 | $74 | 65 |
| 13 Jones Ave | 0.33mi | 4/2.0 | 1,862 (+4%) | 18mo | $160,250 | $86 | 63 |
| 153 E Main St | 0.61mi | 3/2.0 (-1) | 1,768 (-1%) | 10mo | $164,500 | $93 | 56 |
| 34 Locust St | 0.51mi | 3/1.5 (-1) | 1,824 (+2%) | 14mo | $138,000 | $76 | 54 |
| 42 Guernsey St | 0.63mi | 3/1.5 (-1) | 1,609 (-10%) | 2mo | $100,000 | $62 | 46 |
| 12 Rexford St | 0.69mi | 4/2.0 | 2,037 (+14%) | 1mo | $125,000 | $61 | 44 |
| 37 Gold St | 0.69mi | 4/1.5 | 2,026 (+13%) | 2mo | $157,950 | $78 | 42 |
| 32 Park St | 0.63mi | 3/1.5 (-1) | 1,645 (-8%) | 14mo | $180,000 | $109 | 38 |
| 77 Sheldon St | 0.64mi | 5/2.5 (+1) | 1,971 (+10%) | 11mo | $185,000 | $94 | 37 |
| 12 Marshall St | 0.61mi | 4/3.0 | 1,536 (-14%) | 15mo | $195,994 | $128 | 31 |
| 180 Randall Ave | 0.56mi | 3/2.0 (-1) | 2,044 (+14%) | 18mo | $125,000 | $61 | 30 |
Match score weights: distance 35% · size 25% · config 20% · recency 20%. Top-matched comps best support the ARV.
Projected returns pro-forma
10.0% appreciation · 3.0% rent growth · sell at horizon
- IRR
- 48.3%
- Equity multiple
- 4.62×
- Total profit
- $76,078
- Equity at exit
- $67,566
- IRR
- 42.1%
- Equity multiple
- 10.36×
- Total profit
- $196,631
- Equity at exit
- $145,709
Cash invested: $21,000 (down + closing). Projections, not guarantees.
Landlord ↔ Tenant lean methodology
- Overall (STATE)
- 15 Strongly Tenant-Friendly
- State New York
- 15 Strongly Tenant-Friendly · D+10
- County
- — inherits STATE
- City
- — inherits STATE
ZIP-level market 13815
- Home prices YoY
- 8.2%
- Active inventory
- 84
- Price-to-rent
- 4.1×
Monthly cashflow live
- Estimated rent
- $1,529 medium interval (Pro) →
- Mortgage (P&I)
- −$393
- Tax from tax record
- −$232 /mo · $2,780/yr
- Insurance
- −$31
- HOA
- −$0
- Vacancy / Maint / Mgmt
- −$321
- Net cashflow
- $551
Break-even live
Sensitivity live
| Price | -10% $594 | -5% $573 | +0% $551 | +5% $530 | +10% $509 |
|---|---|---|---|---|---|
| Rent | -10% $431 | -5% $491 | +0% $551 | +5% $612 | +10% $672 |
| Rate | -1.0pp $589 | -0.5pp $571 | base $551 | +0.5pp $532 | +1.0pp $512 |
UW: 25.0% down · 7.5% · 30yr · 1.5% tax · 5.0% vac · 8.0% maint · 8.0% mgmt
Financing live
Cash to close
- Down payment
- $18,750
- Closing costs
- $2,250
- Reserves months
- —
- Total cash needed
- —
Loan-product check · same deal, 3 products live
Conventional
25% down · 7.5% · 30yr
- Down + closing
- —
- Monthly P&I
- —
- Monthly cashflow
- —
- DSCR
- —
- Eligible?
- —
Personal DTI + credit; lowest rate.
DSCR
20% down · 8.5% · 30yr
- Down + closing
- —
- Monthly P&I
- —
- Monthly cashflow
- —
- DSCR
- —
- Eligible?
- —
No personal income docs; deal must DSCR.
Hard money
10% down · 12.0% · 12mo
- Down + closing
- —
- Monthly P&I
- —
- Monthly cashflow
- —
- DSCR
- —
- Eligible?
- —
Short-term bridge; refi at stabilization.
Listing history 24 events
-
2026-05-31statusdays on market $75,000 Pending 325 DOM
-
2026-04-26historical Active Under Contract
-
2026-03-16status Active
-
2026-02-19historical Active Under Contract
-
2026-02-17status Active
-
2026-02-13historical Active Under Contract
-
2026-02-13status Active
-
2026-02-12historical Active Under Contract
-
2026-02-10status Pending
-
2026-01-28price $75,000
-
2025-12-17price $89,000
-
2025-12-15status Active
-
2025-11-04historical Active Under Contract
-
2025-09-30price $84,900
-
2025-08-22price $89,900
-
2025-07-08$95,000 Active
-
2021-11-07historical
-
2021-07-12$72,500
-
2019-01-23soldstatus $25,000
-
2007-12-14soldstatus $123,600
-
2007-12-14soldstatus $123,600
-
2007-08-31$128,500
-
1998-06-24soldstatus $52,900
-
1992-10-19soldstatus $55,000
ⓘ Source: listings_history table (triggers on properties + properties_extension) + one-shot
backfill from property_details.listing_events for pre-trigger history.
Tax reassessment forecast NY · Partial reset (capped growth)
- Current annual tax
- $2,780 · $232/mo
- Projected year-2 tax
- $2,780 · $232/mo
- Expected delta
- $0/yr ($0/mo · 0.0%)
ⓘ Screening estimate from a state-policy table — verify with the county assessor before closing.
Climate risk First Street
- Flood 4/10 Moderate FEMA zone X (unshaded) · 22% chance over 30 yrs
- Wildfire 3/10 Moderate
- Heat 3/10 Moderate 7 d/yr ≥94°F today · 17 d/yr by 30 yrs out
- Wind 2/10 Low 100% chance of damaging wind over 30 yrs
- Air quality 1/10 Low 0 unhealthy d/yr today · 0 by 30 yrs out
Nearby sold comps map
Loading sold comps map…
Walkable amenities ~0.75 mi
Loading nearby amenities…
Taxation est. · year 1
- Rental income
- $18,344
- − Mortgage interest
- −$4,201
- − Property taxes
- −$2,780
- − Insurance
- −$375
- − Repairs & maintenance
- −$1,468
- − Management
- −$1,468
- − Depreciation
- −$2,182
- Taxable income
- $5,872
- Est. tax owed @ 24.0%
- −$1,409
- After-tax cash flow
- $5,208/yr
For passive investors: Depreciation is non-cash, so a rental often shows a tax loss while cash-flowing — sheltering income. Rental losses are passive: they offset passive income freely, and up to $25,000/yr can offset ordinary (W-2) income if you actively participate and your MAGI is under $100k (phasing out to $0 by $150k); unused losses carry forward. On sale, claimed depreciation is recaptured at up to 25%, and gains may owe capital-gains tax (a 1031 exchange can defer both). Figures are a year-1 estimate at your 24.0% rate — not tax advice; consult a CPA.
Schools (NCES district)
- District
- Norwich City School District
- NCES district ID
- 3621330
- Math proficiency
- 42% ▼ -13.00%
- Reading proficiency
- 43% ▲ 1.00%
- Median HH income
- $40,687
- Composite
- 35.68/100
- National rank
- #4874
- State rank
- #498 of 590 in NY
Livability — Norwich
- Score
- 70/100
- State rank
- #447
- US rank
- #7857
Category grades
Schools grade is shown separately in the Schools card above.
Census & demographics
- Census place
- Norwich, NY
- City population
- 12,855
- Population (ZIP)
- 12,855
Population outlook (Chenango County) Hauer SSP2
- Today (2025)
- 45,669 people
- By 2030
- 43,484 · -4.8%
- By 2040
- 38,774 · -15.1%
- By 2050
- 34,000 · -25.6%
- By 2075
- 24,637 · -46.1%
- By 2100
- 16,452 · -64.0%
Race, ethnicity, and origin ACS 2023
- Neighborhood character
- Predominantly White (90%)
- Race & ethnicity
- White 90% Hispanic / Latino 5% Two or more races 4%
- Common ancestry
- Lithuanian 3% Slovak 2% Iranian 2%
- Foreign-born
- 4% · Canada
- Languages at home
- 95% English-only · Spanish 3% German/W. Germanic 0%
Political lean MEDSL · Chenango
- 2024 margin
- Strong R (+27.2) · D 36.4% · R 63.6%
- 2008→2024 swing
- -26.1pp toward R · 2008: -1.1pp · 2024: -27.2pp
- All cycles
- 2024: R+27.2 2020: R+23.3 2016: R+28.1 2012: R+3.4 2008: R+1.1
Not yet ingested
- Civics
- —
Market trends
- HPI YoY
- ▲ 21.23%
- Current HPI
- 280.463
- Rent YoY
- —
- Metro
- —
- State GDP YoY
- ▲ 2.60%
- F500 in state
- 92
Industry mix (Fortune 500 HQ in NY)
| Industry | F500 HQs | Revenue |
|---|---|---|
| Financial Services | 10 | $950B |
|
||
| Consumer Goods | 9 | $162B |
|
||
| Insurance | 4 | $225B |
|
||
| Telecommunications | 2 | $144B |
|
||
| Pharmaceuticals | 2 | $112B |
|
||
| Media / Entertainment | 2 | $69B |
|
||
Price history
+36.4% since first listed23 events — show timeline
- 2026-04-26 Contingent — UNYREIS
- 2026-03-16 Relisted — UNYREIS
- 2026-02-19 Contingent — UNYREIS
- 2026-02-17 Relisted — UNYREIS
- 2026-02-13 Contingent — UNYREIS
- 2026-02-13 Relisted — UNYREIS
- 2026-02-12 Contingent — UNYREIS
- 2026-02-10 Pending — UNYREIS
- 2026-01-28 Price Changed $75,000 UNYREIS
- 2025-12-17 Price Changed $89,000 UNYREIS
- 2025-12-15 Relisted — UNYREIS
- 2025-11-04 Contingent — UNYREIS
- 2025-09-30 Price Changed $84,900 UNYREIS
- 2025-08-22 Price Changed $89,900 UNYREIS
- 2025-07-08 Listed $95,000 UNYREIS
- 2021-11-07 Listing Removed — UNYREIS
- 2021-07-12 Listed $72,500 UNYREIS
- 2019-01-23 Sold (Public Records) $25,000 Public Records
- 2007-12-14 Sold (Public Records) $123,600 Public Records
- 2007-12-14 Sold (MLS) $123,600 UNYREIS
- 2007-08-31 Listed $128,500 UNYREIS
- 1998-06-24 Sold (Public Records) $52,900 Public Records
- 1992-10-19 Sold (Public Records) $55,000 Public Records
Property tax history
+2.0%/yrLatest (2025): $2,780 · +2.5% YoY. Source: county tax records.
Cash-flow waterfall
monthlySold comps — $/sqft
last 12 mo · ≤1 miLoading sold comps…