326 2nd Ave E · Federal Dam, MN
Flood risk 1/10 · Minimal
- FEMA flood zone
- —
- Chance of flooding over 30 yrs
- 0.0%
- Est. flood insurance / yr
- —
Fire risk 5/10 · Moderate
- Est. fire insurance / yr
- $888 – $1,650
Heat risk 1/10 · Minimal
- Hot days now (above 94°F)
- 7 days/yr
- Hot days in 30 yrs
- 12 days/yr
Wind risk 1/10 · Minimal
- Chance of severe wind over 30 yrs
- —
Air-quality risk 2/10 · Minimal
- Unhealthy air days now
- 0 days/yr
- Unhealthy air days in 30 yrs
- 1 days/yr
Risk factors via First Street. Map © Google.
Why this score? — see what drove the D- grade
The composite is a weighted blend of 9 inputs, each scored 0–100. Each bar is that input's sub-score; the figure is the points it added to the 100-point composite (weight × sub-score).
- Appreciation +9.3/10.0
- ARV discount +7.5/15.0
- Cash flow +6.5/30.0
- Livability +3.0/5.0
- Schools +2.8/10.0
- Rent growth +2.5/5.0
- Condition / age +2.5/5.0
- DSCR +0.8/10.0
- 1% rule +0.5/10.0
$209,000
🖨 Deal sheet 📄 Offer letter ✓ Due diligence
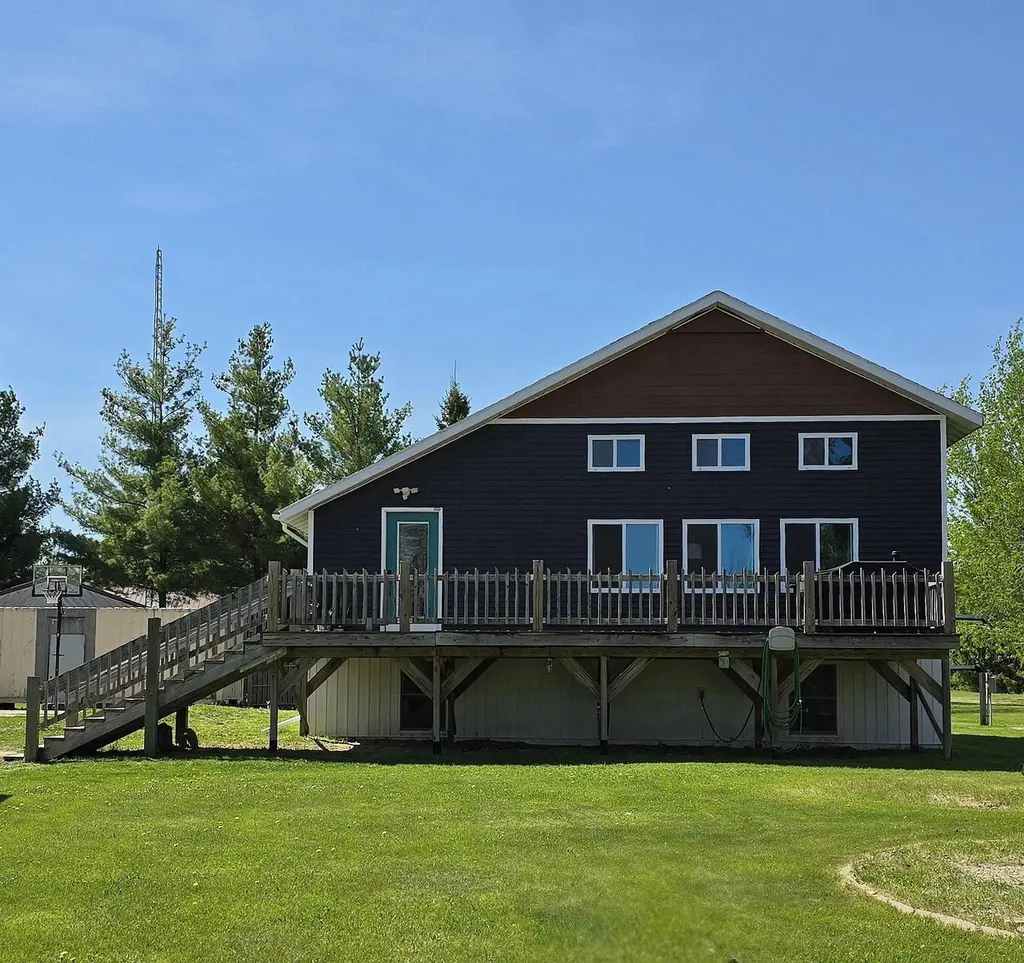
Listing remarks
This solid 5 bed 3 bath home lies in the beautiful Chippewa National Forest and just blocks from Federal Dam Recreation Area. It sits on 1/2 acre and comes with a 1320sf pole building and a metal shipping container for extra storage. This home has received a new basement and extensive remodeling. The great room is so comfy you may not want to leave! The large deck is great for entertaining and the home features a main floor primary bedroom and main floor laundry. The loft holds 2 bedrooms and a 1/2 bath. The basement was rebuilt but has not been fully finished. It holds 2 more bedrooms, living space, a 3/4 bath area and more storage. The outdoor space is wonderful too ~ complete with a fenc
Key facts
- Large deck
- New basement
- 1320sf pole building
Tags
Property features AI
Exterior
- Parking: Gravel parking
- Utilities: Well water; City sewer (connected); Electric with circuit breakers (Lake Country Power); Pellet fuel
- Home design: Residential property; One and one-half levels; Entry level main floor
- Construction: Frame construction; Asphalt roof (over 8 years old); Slab and wood foundation; Foundation dimensions approximately 34x32
- Exterior features: Composite decking and deck; Vinyl exterior; Partial chain link fence; Pole building on property; City paved street frontage (public maintained road)
Interior
- Kitchen: Dishwasher; Microwave; Range; Refrigerator
- Bedrooms: 5 bedrooms
- Bathrooms: Main floor full bath; Upper level half bath; Basement three-quarter bath
- Heating & cooling: Heating: Other; No central air
- Interior features: Dishwasher; Dryer; Electric water heater; Microwave; Range; Refrigerator; Washer; Full, partially finished wood basement
- Laundry & utility: Main level laundry; Washer and dryer included
Neighborhood map
What this means for you Summary
Snapshot
- This is a 5-bed/3.0-bath single-family listed at $209k.
Deal economics
- At list price, monthly cash flow is $-354 ($-4k/yr) — negative.
- To cash-flow at today's rent, offer at most $147k (29.9% below list).
- To meet the 1% rule (rent ≥ 1% of price), the offer needs to be $114k (45.3% below list).
- Recommended offer: $114k (45.3% below list) — sets the bar for 1% rule.
Location & tenants
- Location reads 59/100 on livability (#795 in MN) — a working-class tenant base; expect higher turnover. Strengths: cost of living A+; Watch: health & safety C-, crime D+, employment D+.
- Northland Community Schools (rural): math 25% / reading 35% proficiency, ranked #395 of 467 in MN (top 85%) — families likely to look elsewhere, expect single-tenant / working-renter base with shorter leases.
- Market conditions: 9 active listings in the ZIP; 285 units permitted in Cass County in 2024 (0 in 5+ unit buildings).
Forward outlook
- In year one you build about $19k of equity ($1k loan paydown + $18k appreciation (8.6% local appreciation)).
- Cass County population projected at -20% by 2050 — secular population decline; favor cash flow + early exit over multi-decade hold.
- By year 2, paydown + projected appreciation supports a ~$31k cash-out refi (75% LTV) — recoverable capital for the next deal without selling this one.
Negotiation context
- It's been on market 20 days — a 2% lower offer ($206k) is reasonable based on typical stale-listing flexibility.
Risks & watch-outs
- Climate carrying-cost: moderate wildfire risk — expect insurance premiums to compound above CPI over the hold.
Questions for the listing agent
- What do current leases actually rent for vs. the listed asking? Can we see a recent rent roll and the last 12 months of T-12 income?
- Is there a deadline driving the sale (1031 exchange, divorce, estate, relocation)? That informs how much negotiation room exists.
- Schools are F-rated, which usually means shorter tenancies and higher turnover. Who's the typical renter profile here, and what's been the actual vacancy rate?
- Crime grade is D in this area — have there been break-ins, vandalism, or insurance claims at this property in the last 3 years? What carrier currently insures it and at what premium?
- The area grade is low — what's the realistic commute time and amenity access for the typical tenant pool here? Any planned neighborhood developments (good or bad) we should know about?
- What's the average days-on-market for RENTAL listings here right now (not sales)? A rising rental-DOM trend means longer vacancies and softer asking-rent achievability than the comps imply.
- What's the recent tenant-quality profile in this submarket — average credit score on applications, eviction rate, late-payment / NSF rate, and stable-employment percentage? A property-management company in the area should have these aggregated.
- How much new for-sale + rental construction is in the pipeline within 1–3 miles? Heavy new supply typically softens prices + rents 12–24 months out; constrained supply supports both.
Investment metrics
- 1% rule
- 0.55% ✗
- Cap rate
- 4.26%
- Cash-on-cash
- -7.25%
- DSCR
- 0.68
- GRM
- 15.2
CMA / ARV
No comps found within radius.
Projected returns pro-forma
8.62% appreciation · 3.0% rent growth · sell at horizon
- IRR
- 16.0%
- Equity multiple
- 2.23×
- Total profit
- $71,877
- Equity at exit
- $167,729
- IRR
- 15.4%
- Equity multiple
- 4.86×
- Total profit
- $225,753
- Equity at exit
- $341,857
Cash invested: $58,520 (down + closing). Projections, not guarantees.
Landlord ↔ Tenant lean methodology
- Overall (STATE)
- 46 Balanced
- State Minnesota
- 46 Balanced · D+2
- County
- — inherits STATE
- City
- — inherits STATE
ZIP-level market 56641
- Home prices YoY
- 3.2%
- Active inventory
- 9
- Price-to-rent
- 15.2×
Monthly cashflow live
- Estimated rent
- $1,143 medium interval (Pro) →
- Mortgage (P&I)
- −$1,096
- Tax from tax record
- −$74 /mo · $884/yr
- Insurance
- −$87
- HOA
- −$0
- Vacancy / Maint / Mgmt
- −$240
- Net cashflow
- $-354
Break-even live
UW: 25.0% down · 7.5% · 30yr · 1.5% tax · 5.0% vac · 8.0% maint · 8.0% mgmt
Financing live
Cash to close
- Down payment
- $52,250
- Closing costs
- $6,270
- Reserves months
- —
- Total cash needed
- —
Loan-product check · same deal, 3 products live
Conventional
25% down · 7.5% · 30yr
- Down + closing
- —
- Monthly P&I
- —
- Monthly cashflow
- —
- DSCR
- —
- Eligible?
- —
Personal DTI + credit; lowest rate.
DSCR
20% down · 8.5% · 30yr
- Down + closing
- —
- Monthly P&I
- —
- Monthly cashflow
- —
- DSCR
- —
- Eligible?
- —
No personal income docs; deal must DSCR.
Hard money
10% down · 12.0% · 12mo
- Down + closing
- —
- Monthly P&I
- —
- Monthly cashflow
- —
- DSCR
- —
- Eligible?
- —
Short-term bridge; refi at stabilization.
Listing history 15 events
-
2026-06-18days on market $209,000 Active 20 DOM
-
2026-06-17days on market $209,000 Active 19 DOM
-
2026-06-16days on market $209,000 Active 18 DOM
-
2026-06-15days on market $209,000 Active 17 DOM
-
2026-06-13days on market $209,000 Active 15 DOM
-
2026-06-12days on market $209,000 Active 14 DOM
-
2026-06-09days on market $209,000 Active 11 DOM
-
2026-06-08days on market $209,000 Active 10 DOM
-
2026-06-07days on market $209,000 Active 9 DOM
-
2026-06-05days on market $209,000 Active 7 DOM
-
2026-06-04days on market $209,000 Active 5 DOM
-
2026-06-02days on market $209,000 Active 4 DOM
-
2026-06-01days on market $209,000 Active 3 DOM
-
2026-05-31days on market $209,000 Active 2 DOM
-
2026-05-29$209,000 Active
ⓘ Source: listings_history table (triggers on properties + properties_extension) + one-shot
backfill from property_details.listing_events for pre-trigger history.
Tax reassessment forecast MN · Partial reset (capped growth)
- Current annual tax
- $884 · $74/mo
- Projected year-2 tax
- $1,612 · $134/mo
- Expected delta
- +$728/yr (+$61/mo · 82.4%)
ⓘ Screening estimate from a state-policy table — verify with the county assessor before closing.
Climate risk First Street
- Flood 1/10 Low 0% chance over 30 yrs
- Wildfire 5/10 Major
- Heat 1/10 Low 7 d/yr ≥94°F today · 12 d/yr by 30 yrs out
- Wind 1/10 Low
- Air quality 2/10 Low 0 unhealthy d/yr today · 1 by 30 yrs out
Nearby sold comps map
Loading sold comps map…
Walkable amenities ~0.75 mi
Loading nearby amenities…
Taxation est. · year 1
- Rental income
- $13,717
- − Mortgage interest
- −$11,707
- − Property taxes
- −$884
- − Insurance
- −$1,045
- − Repairs & maintenance
- −$1,097
- − Management
- −$1,097
- − Depreciation
- −$6,080
- Taxable loss
- −$8,194
- Est. tax savings @ 24.0%
- +$1,967
- After-tax cash flow
- $-2,278/yr
For passive investors: Depreciation is non-cash, so a rental often shows a tax loss while cash-flowing — sheltering income. Rental losses are passive: they offset passive income freely, and up to $25,000/yr can offset ordinary (W-2) income if you actively participate and your MAGI is under $100k (phasing out to $0 by $150k); unused losses carry forward. On sale, claimed depreciation is recaptured at up to 25%, and gains may owe capital-gains tax (a 1031 exchange can defer both). Figures are a year-1 estimate at your 24.0% rate — not tax advice; consult a CPA.
Schools (NCES district)
- District
- Northland Community Schools
- NCES district ID
- 2730870
- Math proficiency
- 25% ▼ -5.00%
- Reading proficiency
- 35% ▼ -5.00%
- Median HH income
- $40,741
- Composite
- 28.13/100
- National rank
- #12208
- State rank
- #395 of 467 in MN
Livability — Federal Dam
- Score
- 59/100
- State rank
- #795
- US rank
- #20081
Category grades
Schools grade is shown separately in the Schools card above.
Census & demographics
- Census place
- Federal Dam, MN
- Population (ZIP)
- 359
Population outlook (Cass County) Hauer SSP2
- Today (2025)
- 27,371 people
- By 2030
- 26,311 · -3.9%
- By 2040
- 23,945 · -12.5%
- By 2050
- 21,889 · -20.0%
- By 2075
- 18,435 · -32.6%
- By 2100
- 14,478 · -47.1%
Race, ethnicity, and origin ACS 2023
- Neighborhood character
- Highly diverse neighborhood (Simpson 0.82)
- Race & ethnicity
- White 42% Native American 34% Two or more races 22% Asian 2%
- Common ancestry
- Romanian 11% Portuguese 4% Lithuanian 3%
- Foreign-born
- 4% · Canada
- Languages at home
- 92% English-only · Other Indo-European 1% Chinese 1% Other Asian/Pacific 1%
Political lean MEDSL · Cass
- 2024 margin
- Solid R (+33.4) · D 32.6% · R 66.0% · Other 1.3%
- 2008→2024 swing
- -24.9pp toward R · 2008: -8.5pp · 2024: -33.4pp
- All cycles
- 2024: R+33.4 2020: R+28.9 2016: R+31.7 2012: R+13.1 2008: R+8.5
Not yet ingested
- Civics
- —
Market trends
- HPI YoY
- ▲ 8.62%
- Current HPI
- 280.7636
- Rent YoY
- —
- Metro
- —
- State GDP YoY
- ▲ 2.41%
- F500 in state
- 34
Industry mix (Fortune 500 HQ in MN)
| Industry | F500 HQs | Revenue |
|---|---|---|
| Healthcare | 2 | $407B |
|
||
| Retail | 2 | $150B |
|
||
| Consumer Goods | 2 | $32B |
|
||
| Industrial Machinery | 2 | $6B |
|
||
| Agriculture | 1 | $40B |
|
||
| Healthcare / Medical Devices | 1 | $32B |
|
||
Price history
1 event — show timeline
- 2026-05-29 Listed $209,000 NORTHSTARMLS as Distributed by MLS Grid
Property tax history
+9.1%/yrLatest (2025): $884 · +25.2% YoY. Source: county tax records.
Cash-flow waterfall
monthlySold comps — $/sqft
last 12 mo · ≤1 miLoading sold comps…