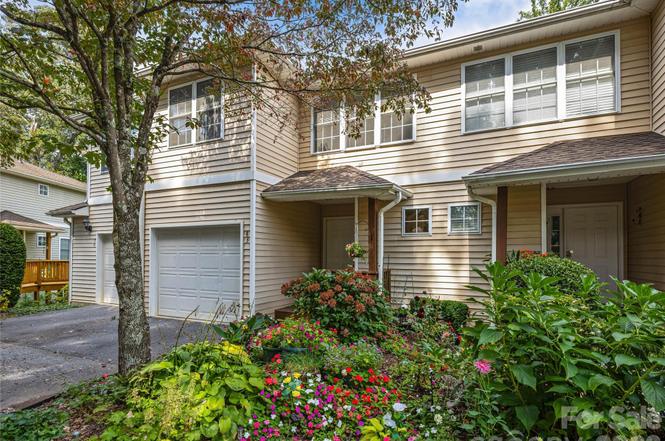
83 Farm Ln · Mills River, NC
Flood risk 1/10 · Minimal
- FEMA flood zone
- X (unshaded)
- Chance of flooding over 30 yrs
- 0.0%
- Est. flood insurance / yr
- $473 – $860
Fire risk 4/10 · Minor
- Est. fire insurance / yr
- $906 – $1,684
Heat risk 4/10 · Minor
- Hot days now (above 97°F)
- 7 days/yr
- Hot days in 30 yrs
- 19 days/yr
Wind risk 2/10 · Minimal
- Chance of severe wind over 30 yrs
- —
Air-quality risk 3/10 · Minor
- Unhealthy air days now
- 2 days/yr
- Unhealthy air days in 30 yrs
- 3 days/yr
Risk factors via First Street. Map © Google.
Why this score? — see what drove the D- grade
The composite is a weighted blend of 9 inputs, each scored 0–100. Each bar is that input's sub-score; the figure is the points it added to the 100-point composite (weight × sub-score).
- Cash flow +12.0/30.0
- ARV discount +7.4/15.0
- Schools +4.2/10.0
- 1% rule +3.6/10.0
- DSCR +3.5/10.0
- Livability +3.4/5.0
- Rent growth +2.5/5.0
- Condition / age +2.5/5.0
- Appreciation +0.0/10.0
$315,000
🖨 Deal sheet 📄 Offer letter ✓ Due diligence
Listing remarks
Welcome to effortless living in Mills River, where space, comfort, and community come together in an ideal location. Just minutes from South Asheville, Hendersonville, the airport, and local favorites like Sierra Nevada Brewing, this condo offers both convenience and charm. Step inside to a freshly painted main level, where an open floor plan invites connection. The kitchen with breakfast bar flows into a light-filled dining area and living room, framed by cathedral ceilings and walls of windows. From here, step out to the deck—perfect for morning coffee or sunset gatherings. Upstairs, the home offers two bedrooms, including a generous primary suite with private bath and walk-in close
Key facts
- Open floor plan
- Walls of windows
- Cathedral ceilings
Tags
Property features AI
Finance
- Other: Subdivision restrictions; Zoning: MR-30
- HOA & community: HOA managed by Cedar Management Group; Mandatory HOA dues of $325 monthly; Community amenities include clubhouse, fitness center, outdoor pool, and pond; Pets allowed with size limit
Exterior
- Parking: Attached garage (1 car); Driveway with 1 open parking space
- Utilities: City water; Public sewer; Electric service (implied by appliances and electric water heater)
- Home design: Residential townhouse; Three levels; Site built
- Construction: Vinyl exterior; Composition roof; Crawl space foundation; Built on site
- Exterior features: Balcony; Rear porch; Concrete and paved roads; private maintained road; Lot approximately 0.05 acres
Interior
- Kitchen: Dishwasher; Electric range; Microwave; Refrigerator
- Bedrooms: 3 bedrooms total — 2 upstairs, 1 in basement
- Flooring: Carpet; Linoleum
- Bathrooms: 3 full bathrooms; 1 half bathroom
- Heating & cooling: Forced air heating (natural gas); Central air conditioning
- Interior features: 12 rooms; Daylight, partially finished basement with exterior and interior entry and storage space; Entry level: 1
- Laundry & utility: Laundry in basement / utility room; Electric water heater
Neighborhood map
What this means for you Summary
Snapshot
- This is a 3-bed/3.5-bath townhouse listed at $315k.
Deal economics
- At list price, monthly cash flow is $-75 ($-899/yr) — negative.
- To cash-flow at today's rent, offer at most $302k (4.2% below list).
- To meet the 1% rule (rent ≥ 1% of price), the offer needs to be $269k (14.4% below list).
- Recommended offer: $269k (14.4% below list) — sets the bar for 1% rule.
- Cap rate 6.0% vs local median 2.3% in Mills River — top-decile yield for the area; either an underpriced asset or a hidden risk that comps aren't pricing in. Stress-test before assuming the spread holds.
Location & tenants
- Location reads 67/100 on livability (#253 in NC) — a middle-class / working-renter tenant base. Strengths: crime A+, housing A+, employment A-; Watch: amenities F, commute F, health & safety F.
- Henderson County Schools (suburban): math 48% / reading 52% proficiency, ranked #64 of 178 in NC (top 36%) — acceptable for families but not a draw, mixed tenant base, ~2y average lease.
- Zoned schools: Glenn C Marlow Elementary (math 70% / reading 70%, grade A-, #90 of 1,410 statewide, top 7%, 580 students, 30% FRL); West Henderson High (math 73% / reading 63%, grade B, #137 of 535 statewide, top 26%, 1,087 students, 34% FRL).
- Zoned-school proficiency averages 69% at this address vs 50% district-wide (+19 pts) — the actual schools serving this property are materially stronger than the Henderson County Schools average implies; a family-tenant draw the district grade alone would hide.
- Market conditions: 109 active listings in the ZIP; 1 comparable units currently listed for rent nearby; solid renter incomes; 1,534 units permitted in Henderson County in 2024 (558 in 5+ unit buildings).
- This rent runs 30% of the median local income ($108k/yr) — at the standard rent-burdened threshold; future hikes will face affordability resistance.
Forward outlook
- Local home prices are declining (-3.0%/yr); year-one equity from $2k of loan paydown is wiped out by about $9k of value loss. Plan a longer hold.
- Henderson County population projected at +20% by 2050 — long-run rental-demand tailwind backs the buy-and-hold thesis.
Negotiation context
- It's been on market 274 days — a 12% lower offer ($277k) is reasonable based on typical stale-listing flexibility.
Questions for the listing agent
- What do current leases actually rent for vs. the listed asking? Can we see a recent rent roll and the last 12 months of T-12 income?
- It's been on market 274 days. Have you received any prior offers? Is the seller open to a 14% concession, seller financing, or rate buy-down credit?
- What does the HOA fee cover, when was the last increase, and are there any pending special assessments or reserve-fund shortfalls?
- Why hasn't it sold? Are there any deal-killer items the seller is aware of (foundation, flood, title, zoning, code violations)?
- Is there a deadline driving the sale (1031 exchange, divorce, estate, relocation)? That informs how much negotiation room exists.
- Schools are B-rated — typically a magnet for longer-tenancy family renters. What's the average tenant stay here, and is there a school-zone premium baked into asking?
- The area grade is low — what's the realistic commute time and amenity access for the typical tenant pool here? Any planned neighborhood developments (good or bad) we should know about?
- What's the average days-on-market for RENTAL listings here right now (not sales)? A rising rental-DOM trend means longer vacancies and softer asking-rent achievability than the comps imply.
- What's the recent tenant-quality profile in this submarket — average credit score on applications, eviction rate, late-payment / NSF rate, and stable-employment percentage? A property-management company in the area should have these aggregated.
- How much new for-sale + rental construction is in the pipeline within 1–3 miles? Heavy new supply typically softens prices + rents 12–24 months out; constrained supply supports both.
Investment metrics
- 1% rule
- 0.86% ✗
- Cap rate
- 6.01%
- Cash-on-cash
- -1.02%
- DSCR
- 0.95
- GRM
- 9.7
CMA / ARV
- ARV (on-the-fly)
- $314,145
- Comps found
- 4
Show comp detail 4 sales within ~0.75 mi
| Address | Dist | Beds/Ba | Sqft | Sold | Price | $/sf | Match |
|---|---|---|---|---|---|---|---|
| 107 Farm Ln | 0.04mi | 3/3.5 | 1,814 (+13%) | 2mo | $285,000 | $157 | 76 |
| 127 Farm Ln | 0.05mi | 3/3.5 | 1,742 (+8%) | 17mo | $340,000 | $195 | 70 |
| 97 Farm Ln | 0.02mi | 2/3.5 (-1) | 1,800 (+12%) | 6mo | $265,000 | $147 | 69 |
| 538 Wheatfield Rd | 0.70mi | 3/2.5 | 1,674 (+4%) | 14mo | $351,210 | $210 | 45 |
Match score weights: distance 35% · size 25% · config 20% · recency 20%. Top-matched comps best support the ARV.
Projected returns pro-forma
-3.0% appreciation · 3.0% rent growth · sell at horizon
- IRR
- -18.0%
- Equity multiple
- 0.37×
- Total profit
- $-55,756
- Equity at exit
- $46,968
- IRR
- -10.1%
- Equity multiple
- 0.38×
- Total profit
- $-54,461
- Equity at exit
- $27,235
Cash invested: $88,200 (down + closing). Projections, not guarantees.
Landlord ↔ Tenant lean methodology
- Overall (STATE)
- 85 Strongly Landlord-Friendly
- State North Carolina
- 85 Strongly Landlord-Friendly · R+3
- County
- — inherits STATE
- City
- — inherits STATE
ZIP-level market 28759
- Home prices YoY
- -30.1%
- Active inventory
- 109
- Price-to-rent
- 9.7×
Monthly cashflow live
- Estimated rent
- $2,695 medium interval (Pro) →
- Mortgage (P&I)
- −$1,652
- Tax from tax record
- −$96 /mo · $1,149/yr
- Insurance
- −$131
- HOA
- −$325
- Vacancy / Maint / Mgmt
- −$566
- Net cashflow
- $-75
Break-even live
UW: 25.0% down · 7.5% · 30yr · 1.5% tax · 5.0% vac · 8.0% maint · 8.0% mgmt
Financing live
Cash to close
- Down payment
- $78,750
- Closing costs
- $9,450
- Reserves months
- —
- Total cash needed
- —
Loan-product check · same deal, 3 products live
Conventional
25% down · 7.5% · 30yr
- Down + closing
- —
- Monthly P&I
- —
- Monthly cashflow
- —
- DSCR
- —
- Eligible?
- —
Personal DTI + credit; lowest rate.
DSCR
20% down · 8.5% · 30yr
- Down + closing
- —
- Monthly P&I
- —
- Monthly cashflow
- —
- DSCR
- —
- Eligible?
- —
No personal income docs; deal must DSCR.
Hard money
10% down · 12.0% · 12mo
- Down + closing
- —
- Monthly P&I
- —
- Monthly cashflow
- —
- DSCR
- —
- Eligible?
- —
Short-term bridge; refi at stabilization.
Rent comps 1 comps
| Address | Beds | Baths | Sqft | Rent | $/sqft | DOM | Units | Dist |
|---|---|---|---|---|---|---|---|---|
| 210 Mud Creek Rd Fletcher, NC | 4.0 | 2.0 | 1477 | $2,595 | $1.76 | 23d | 1 | 1.28mi |
HOA detail
- Monthly dues
- $325 · $3,900/yr
Listing history 18 events
-
2026-06-18days on market $315,000 Active 274 DOM
-
2026-06-17days on market $315,000 Active 273 DOM
-
2026-06-16days on market $315,000 Active 272 DOM
-
2026-06-15days on market $315,000 Active 271 DOM
-
2026-06-14days on market $315,000 Active 269 DOM
-
2026-06-13days on market $315,000 Active 268 DOM
-
2026-06-10days on market $315,000 Active 266 DOM
-
2026-06-09days on market $315,000 Active 265 DOM
-
2026-06-08days on market $315,000 Active 264 DOM
-
2026-06-07days on market $315,000 Active 263 DOM
-
2026-06-05days on market $315,000 Active 260 DOM
-
2026-06-03days on market $315,000 Active 259 DOM
-
2026-06-02days on market $315,000 Active 258 DOM
-
2026-06-01days on market $315,000 Active 257 DOM
-
2026-05-31days on market $315,000 Active 256 DOM
-
2026-05-30days on market $315,000 Active 255 DOM
-
2025-09-17$315,000 Active
-
2019-09-20price $206,000
ⓘ Source: listings_history table (triggers on properties + properties_extension) + one-shot
backfill from property_details.listing_events for pre-trigger history.
Tax reassessment forecast NC · Resets to sale price
- Current annual tax
- $1,149 · $96/mo
- Projected year-2 tax
- $2,583 · $215/mo
- Expected delta
- +$1,434/yr (+$119/mo · 124.8%)
ⓘ Screening estimate from a state-policy table — verify with the county assessor before closing.
Climate risk First Street
- Flood 1/10 Low FEMA zone X (unshaded) · 0% chance over 30 yrs
- Wildfire 4/10 Moderate
- Heat 4/10 Moderate 7 d/yr ≥97°F today · 19 d/yr by 30 yrs out
- Wind 2/10 Low
- Air quality 3/10 Moderate 2 unhealthy d/yr today · 3 by 30 yrs out
Nearby sold comps map
Loading sold comps map…
Walkable amenities ~0.75 mi
Loading nearby amenities…
Taxation est. · year 1
- Rental income
- $32,339
- − Mortgage interest
- −$17,645
- − Property taxes
- −$1,149
- − Insurance
- −$1,575
- − Repairs & maintenance
- −$2,587
- − Management
- −$2,587
- − HOA
- −$3,900
- − Depreciation
- −$9,164
- Taxable loss
- −$6,268
- Est. tax savings @ 24.0%
- +$1,504
- After-tax cash flow
- $605/yr
For passive investors: Depreciation is non-cash, so a rental often shows a tax loss while cash-flowing — sheltering income. Rental losses are passive: they offset passive income freely, and up to $25,000/yr can offset ordinary (W-2) income if you actively participate and your MAGI is under $100k (phasing out to $0 by $150k); unused losses carry forward. On sale, claimed depreciation is recaptured at up to 25%, and gains may owe capital-gains tax (a 1031 exchange can defer both). Figures are a year-1 estimate at your 24.0% rate — not tax advice; consult a CPA.
Schools (NCES district)
- District
- Henderson County Schools
- NCES district ID
- 3702100
- Math proficiency
- 48% ▼ -2.00%
- Reading proficiency
- 52% ▼ -2.00%
- Median HH income
- $47,101
- Composite
- 42.5/100
- National rank
- #3206
- State rank
- #64 of 178 in NC
Livability — Mills River
- Score
- 67/100
- State rank
- #253
- US rank
- #11185
Category grades
Schools grade is shown separately in the Schools card above.
Census & demographics
- Census place
- Mills River, NC
- County
- Henderson County · 78,587 people
- City population
- 7,555
- Metro
- Asheville, NC
- Population (ZIP)
- 7,555
- Household income
- $107,609
- Rent vs Own
- Severe rent burden
- 25.0
Population outlook (Henderson County) Hauer SSP2
- Today (2025)
- 124,075 people
- By 2030
- 129,690 · +4.5%
- By 2040
- 139,898 · +12.8%
- By 2050
- 148,298 · +19.5%
- By 2075
- 163,980 · +32.2%
- By 2100
- 166,962 · +34.6%
Race, ethnicity, and origin ACS 2023
- Neighborhood character
- Predominantly White (84%)
- Race & ethnicity
- White 84% Hispanic / Latino 4% Asian 4% Two or more races 4% Black 3%
- Common ancestry
- Slovak 4% Serbian 2% Iranian 2%
- Foreign-born
- 6% · Canada, China, South Korea
- Languages at home
- 94% English-only · Spanish 3% Other Asian/Pacific 1%
Political lean MEDSL · Henderson
- 2024 margin
- R (+14.6) · D 42.1% · R 56.7% · Other 1.1%
- 2008→2024 swing
- +6.5pp toward D · 2008: -21.0pp · 2024: -14.6pp
- All cycles
- 2024: R+14.6 2020: R+18.8 2016: R+27.9 2012: R+27.6 2008: R+21.0
Not yet ingested
- Civics
- —
Market trends
- HPI YoY
- ▼ -90.89%
- Current HPI
- 210.99
- Rent YoY
- —
- Metro
- Asheville, NC
- State GDP YoY
- ▲ 3.28%
- F500 in state
- 26
Industry mix (Fortune 500 HQ in NC)
| Industry | F500 HQs | Revenue |
|---|---|---|
| Financial Services | 2 | $213B |
|
||
| Retail | 2 | $95B |
|
||
| Industrial Conglomerate | 1 | $38B |
|
||
| Metals / Steel | 1 | $35B |
|
||
| Utilities | 1 | $30B |
|
||
| Industrial Machinery | 1 | $19B |
|
||
Price history
+52.9% since first listed2 events — show timeline
- 2025-09-17 Listed $315,000 CANOPYMLS as Distributed by MLS Grid
- 2019-09-20 Price Changed $206,000 CANOPYMLS as Distributed by MLS Grid
Property tax history
+3.6%/yrLatest (2025): $1,149 · +0.0% YoY. Source: county tax records.
Cash-flow waterfall
monthlySold comps — $/sqft
last 12 mo · ≤1 miLoading sold comps…