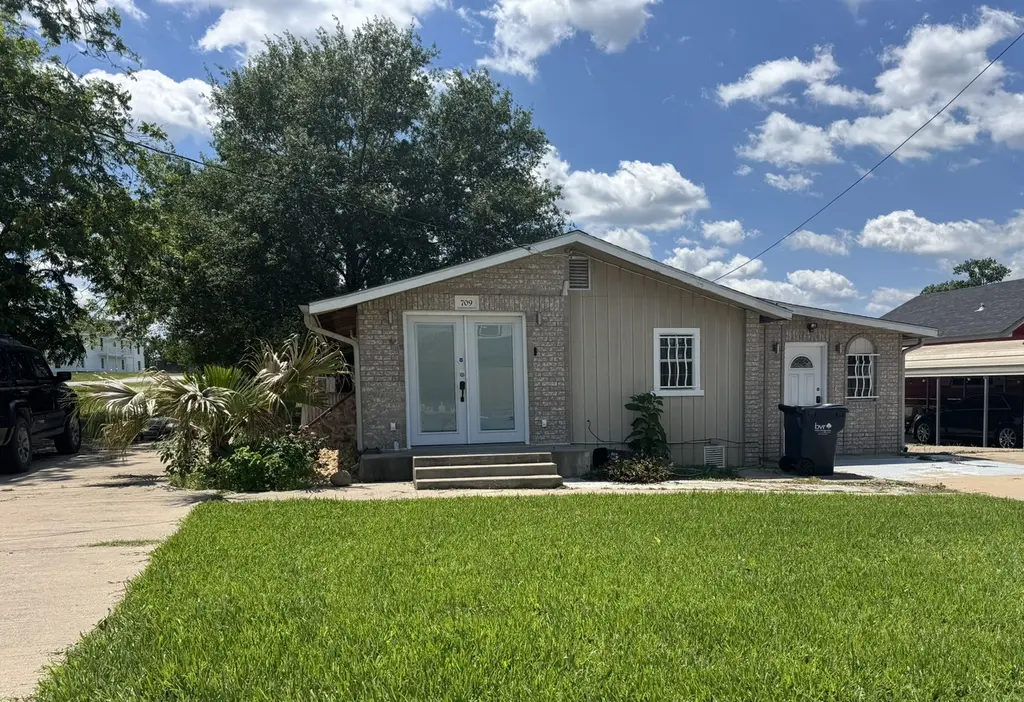
709 Sabine St · Brenham, TX
Flood risk 1/10 · Minimal
- FEMA flood zone
- X (unshaded)
- Chance of flooding over 30 yrs
- 0.0%
- Est. flood insurance / yr
- $507 – $1,088
Fire risk 5/10 · Moderate
- Est. fire insurance / yr
- $1,222 – $2,270
Heat risk 8/10 · Major
- Hot days now (above 111°F)
- 7 days/yr
- Hot days in 30 yrs
- 23 days/yr
Wind risk 8/10 · Major
- Chance of severe wind over 30 yrs
- 99.0%
Air-quality risk 1/10 · Minimal
- Unhealthy air days now
- 0 days/yr
- Unhealthy air days in 30 yrs
- 0 days/yr
Risk factors via First Street. Map © Google.
Why this score? — see what drove the B grade
The composite is a weighted blend of 9 inputs, each scored 0–100. Each bar is that input's sub-score; the figure is the points it added to the 100-point composite (weight × sub-score).
- Cash flow +27.9/30.0
- ARV discount +15.0/15.0
- DSCR +9.9/10.0
- 1% rule +8.2/10.0
- Schools +3.9/10.0
- Livability +3.8/5.0
- Rent growth +2.5/5.0
- Condition / age +2.5/5.0
- Appreciation +0.0/10.0
$115,000
🖨 Deal sheet 📄 Offer letter ✓ Due diligence
Listing remarks MLS
Unlock the potential. This 3/1 home is Ideal for investors, first-time buyers, or those seeking a project with room to expand. The large corner lot gives ample space for future additions, outdoor living, or gardening. Located in a developing neighborhood with convenient access to the Washington County Fairgrounds, local amenities, great schools, and just minutes from downtown Brenham. This property combines location with potential, come see for yourself!
Key facts
- 0.23 acre lot
- Built 1998
- Listed 50 days
Property features AI
Exterior
- Utilities: Public water; Public sewer
- Home design: Residential property; Single-story information includes rooms on first, second and third levels
- Construction: Built in 1998; Slab foundation; Composition roof
- Exterior features: Located in a subdivision
Interior
- Bedrooms: Primary bedroom on the first floor (approx. 11 x 11); Bedroom on the second floor (approx. 11 x 12); Bedroom on the third floor (approx. 12 x 14)
- Bathrooms: 1 full bathroom
- Heating & cooling: Wall furnace heating; Window unit(s) for cooling
- Interior features: Washer hookup; 3 total rooms
- Laundry & utility: Washer hookup
Neighborhood map
What this means for you Summary
Snapshot
- This is a 3-bed/1.0-bath single-family listed at $115k.
Deal economics
- At list price, monthly cash flow is $354 ($4k/yr) — positive.
- The deal already cash-flows at list — no discount required.
- Meets the 1% rule at list price ($2k rent vs $115k).
- Recommended offer: $112k (3.0% below list) — sets the bar for market timing.
- Cap rate 10.0% vs local median 2.7% in Brenham — top-decile yield for the area; either an underpriced asset or a hidden risk that comps aren't pricing in. Stress-test before assuming the spread holds.
Location & tenants
- Location reads 75/100 on livability (#136 in TX, #3,978 nationally) — a middle-class / working-renter tenant base. Strengths: cost of living A+, housing A+, amenities A; Watch: employment C-, crime F, commute F.
- Brenham ISD (town): math 50% / reading 40% proficiency, ranked #263 of 826 in TX (top 32%) — families likely to look elsewhere, expect single-tenant / working-renter base with shorter leases.
- Zoned schools: Brenham H S (math 50% / reading 45%, grade D, #583 of 1,632 statewide, top 36%, 1,584 students, 50% FRL) — zoned schools at 50% FRL track the district average.
- Market conditions: 514 active listings in the ZIP; 12 comparable units currently listed for rent nearby; rentals lingering (median 44d on market — plan ~5-8 weeks vacancy on turnover, expect pricing pressure); 100% of comp listings sitting > 30 days — soft ceiling on asking rent; 111 units permitted in Washington County in 2024 (0 in 5+ unit buildings).
Forward outlook
- Local home prices are declining (-3.0%/yr); year-one equity from $795 of loan paydown is wiped out by about $3k of value loss. Plan a longer hold.
- Washington County population projected at +16% by 2050 — long-run rental-demand tailwind backs the buy-and-hold thesis.
- At projected returns (-3.0% appreciation + 3.0% rent growth), your $32k cash investment doubles in ~9 years — after that, you're playing with house money.
Negotiation context
- It's been on market 51 days — a 3% lower offer ($112k) is reasonable based on typical stale-listing flexibility.
- 7 sale attempts; this cycle's ask has dropped $15k (12%) from the opening price — seller is motivated, your offer sets the floor, not the list.
Risks & watch-outs
- Climate carrying-cost: severe wind risk, 99% chance of damaging wind over 30y; moderate wildfire risk; extreme-heat days projected 7→23/yr by 2055 (HVAC capex compounding) — expect insurance premiums to compound above CPI over the hold.
Questions for the listing agent
- It's been on market 51 days. Have you received any prior offers? Is the seller open to a 3% concession, seller financing, or rate buy-down credit?
- Is there a deadline driving the sale (1031 exchange, divorce, estate, relocation)? That informs how much negotiation room exists.
- Crime grade is F in this area — have there been break-ins, vandalism, or insurance claims at this property in the last 3 years? What carrier currently insures it and at what premium?
- What's the average days-on-market for RENTAL listings here right now (not sales)? A rising rental-DOM trend means longer vacancies and softer asking-rent achievability than the comps imply.
- What's the recent tenant-quality profile in this submarket — average credit score on applications, eviction rate, late-payment / NSF rate, and stable-employment percentage? A property-management company in the area should have these aggregated.
- How much new for-sale + rental construction is in the pipeline within 1–3 miles? Heavy new supply typically softens prices + rents 12–24 months out; constrained supply supports both.
Investment metrics
- 1% rule
- 1.32% ✓
- Cap rate
- 9.98%
- Cash-on-cash
- 13.18%
- DSCR
- 1.59
- GRM
- 6.3
CMA / ARV
- ARV (median comp)
- $187,519
- List price
- $115,000
- Delta
- -38.67%
- Verdict
- UNDERPRICED
- Comps
- 20 within 1.0 mi
Show comp detail 12 sales within ~0.75 mi
| Address | Dist | Beds/Ba | Sqft | Sold | Price | $/sf | Match |
|---|---|---|---|---|---|---|---|
| 706 Matilda St | 0.50mi | 3/1.0 | 1,210 (-2%) | 8mo | $199,900 | $165 | 66 |
| 605 Gay Hill St | 0.48mi | 3/1.0 | 1,238 (-0%) | 14mo | $250,000 | $202 | 66 |
| 1107 Thiel St | 0.29mi | 2/1.0 (-1) | 1,209 (-3%) | 14mo | $125,000 | $103 | 65 |
| 1201 E Alamo St | 0.48mi | 3/1.0 | 1,158 (-7%) | 6mo | $214,900 | $186 | 62 |
| 400 N Chappell Hill St | 0.42mi | 2/1.0 (-1) | 1,331 (+7%) | 2mo | $249,900 | $188 | 61 |
| 907 Martin St | 0.22mi | 2/2.0 (-1) | 1,160 (-6%) | 12mo | $199,000 | $172 | 59 |
| 1006 Barnhill St | 0.38mi | 3/1.0 | 1,341 (+8%) | 14mo | $95,000 | $71 | 57 |
| 1304 E Alamo St | 0.47mi | 3/1.0 | 1,161 (-6%) | 14mo | $184,900 | $159 | 56 |
| 1210 Bridge St | 0.32mi | 3/2.0 | 1,054 (-15%) | 3mo | $197,000 | $187 | 54 |
| 1002 Norris St | 0.72mi | 3/2.0 | 1,174 (-5%) | 5mo | $305,000 | $260 | 49 |
| 505 Alma St | 0.63mi | 2/1.0 (-1) | 1,259 (+2%) | 18mo | $380,000 | $302 | 48 |
| 1003 Norris St | 0.69mi | 2/1.0 (-1) | 1,064 (-14%) | 6mo | $150,000 | $141 | 34 |
Match score weights: distance 35% · size 25% · config 20% · recency 20%. Top-matched comps best support the ARV.
Projected returns pro-forma
-3.0% appreciation · 3.0% rent growth · sell at horizon
- IRR
- 3.2%
- Equity multiple
- 1.12×
- Total profit
- $3,950
- Equity at exit
- $17,147
- IRR
- 12.8%
- Equity multiple
- 2.01×
- Total profit
- $32,665
- Equity at exit
- $9,943
Cash invested: $32,200 (down + closing). Projections, not guarantees.
Landlord ↔ Tenant lean methodology
- Overall (STATE)
- 87 Strongly Landlord-Friendly
- State Texas
- 87 Strongly Landlord-Friendly · R+5
- County
- — inherits STATE
- City
- — inherits STATE
ZIP-level market 77833
- Active inventory
- 514
- Price-to-rent
- 6.3×
Monthly cashflow live
- Estimated rent
- $1,513 high interval (Pro) →
- Mortgage (P&I)
- −$603
- Tax from tax record
- −$191 /mo · $2,286/yr
- Insurance
- −$48
- HOA
- −$0
- Vacancy / Maint / Mgmt
- −$318
- Net cashflow
- $354
Break-even live
UW: 25.0% down · 7.5% · 30yr · 1.5% tax · 5.0% vac · 8.0% maint · 8.0% mgmt
Financing live
Cash to close
- Down payment
- $28,750
- Closing costs
- $3,450
- Reserves months
- —
- Total cash needed
- —
Loan-product check · same deal, 3 products live
Conventional
25% down · 7.5% · 30yr
- Down + closing
- —
- Monthly P&I
- —
- Monthly cashflow
- —
- DSCR
- —
- Eligible?
- —
Personal DTI + credit; lowest rate.
DSCR
20% down · 8.5% · 30yr
- Down + closing
- —
- Monthly P&I
- —
- Monthly cashflow
- —
- DSCR
- —
- Eligible?
- —
No personal income docs; deal must DSCR.
Hard money
10% down · 12.0% · 12mo
- Down + closing
- —
- Monthly P&I
- —
- Monthly cashflow
- —
- DSCR
- —
- Eligible?
- —
Short-term bridge; refi at stabilization.
Rent comps 12 comps
| Address | Beds | Baths | Sqft | Rent | $/sqft | DOM | Units | Dist |
|---|---|---|---|---|---|---|---|---|
| 715 Sabine St Brenham, TX | 2.0 | 1.0 | 900 | $1,450 | $1.61 | 44d | 1 | 0.02mi |
| 704 E Academy St Brenham, TX | 2.0 | 1.0 | 816 | $1,250 | $1.53 | 44d | 1 | 0.49mi |
| 1002 Garrett St Brenham, TX | 3.0 | 2.0 | 1084 | $1,450 | $1.34 | 44d | 1 | 0.57mi |
| 910 N Park St Brenham, TX | 1.0–2.0 | 1.0 | 715 | $1,250 | $1.75 | 44d | 2 | 0.80mi |
| 309 Duprie Dr Brenham, TX | 3.0 | 2.0 | 1094 | $1,550 | $1.42 | 44d | 1 | 0.94mi |
| 1000 Marie St Brenham, TX | 3.0 | 2.0 | 1322 | $1,450 | $1.10 | 44d | 1 | 1.05mi |
| 201 Ava Dr Brenham, TX | 3.0 | 2.0 | 1301 | $1,800 | $1.38 | 44d | 1 | 1.08mi |
| 309 McNeese St Brenham, TX | 2.0 | 1.0 | 877 | $1,400 | $1.60 | 44d | 1 | 1.09mi |
| 809 Jersey Ln Brenham, TX | 2.0 | 1.0 | 884 | $1,300 | $1.47 | 44d | 1 | 1.26mi |
| 514 W Jefferson St Brenham, TX | 2.0 | 1.0 | 819 | $1,300 | $1.59 | 44d | 1 | 1.28mi |
| 500 College Ave Brenham, TX | 1.0–3.0 | 1.0–1.5 | 800 | $1,375 | $1.72 | 44d | 2 | 1.45mi |
| 705 S Jackson St Brenham, TX | 2.0 | 1.0 | 1050 | $1,312 | $1.25 | 44d | 2 | 1.46mi |
Listing history 26 events
-
2026-06-19days on market $115,000 Active 51 DOM
-
2026-06-18days on market $115,000 Active 50 DOM
-
2026-06-17days on market $115,000 Active 49 DOM
-
2026-06-16days on market $115,000 Active 48 DOM
-
2026-06-15days on market $115,000 Active 47 DOM
-
2026-06-14days on market $115,000 Active 45 DOM
-
2026-06-12days on market $115,000 Active 44 DOM
-
2026-06-09days on market $115,000 Active 41 DOM
-
2026-06-08days on market $115,000 Active 40 DOM
-
2026-06-07pricedays on market $115,000 Active 39 DOM
-
2026-06-02days on market $130,000 Active 34 DOM
-
2026-06-01days on market $130,000 Active 33 DOM
-
2026-05-31days on market $130,000 Active 32 DOM
-
2026-05-30days on market $130,000 Active 31 DOM
-
2026-04-29$130,000 Active 458-char remark
Show marketing remark (458 chars)
Unlock the potential. This 3/1 home is Ideal for investors, first-time buyers, or those seeking a project with room to expand. The large corner lot gives ample space for future additions, outdoor living, or gardening. Located in a developing neighborhood with convenient access to the Washington County Fairgrounds, local amenities, great schools, and just minutes from downtown Brenham. This property combines location with potential, come see for yourself!
-
2026-04-29$130,000 Active 534-char remark
Show marketing remark (458 chars)
Unlock the potential. This 3/1 home is Ideal for investors, first-time buyers, or those seeking a project with room to expand. The large corner lot gives ample space for future additions, outdoor living, or gardening. Located in a developing neighborhood with convenient access to the Washington County Fairgrounds, local amenities, great schools, and just minutes from downtown Brenham. This property combines location with potential, come see for yourself!
-
2026-01-14historical
-
2025-12-08price $120,000
-
2025-12-08price $120,000
-
2025-11-14status Active
-
2025-10-23status Active
-
2025-10-23price $135,000
-
2025-10-23price $135,000
-
2025-10-15status Active
-
2025-10-04$160,000 Active
-
2025-10-01$160,000 Active
ⓘ Source: listings_history table (triggers on properties + properties_extension) + one-shot
backfill from property_details.listing_events for pre-trigger history.
Tax reassessment forecast TX · Resets to sale price
- Current annual tax
- $2,286 · $191/mo
- Projected year-2 tax
- $2,286 · $191/mo
- Expected delta
- $0/yr ($0/mo · 0.0%)
ⓘ Screening estimate from a state-policy table — verify with the county assessor before closing.
Climate risk First Street
- Flood 1/10 Low FEMA zone X (unshaded) · 0% chance over 30 yrs
- Wildfire 5/10 Major
- Heat 8/10 Severe 7 d/yr ≥111°F today · 23 d/yr by 30 yrs out
- Wind 8/10 Severe 99% chance of damaging wind over 30 yrs
- Air quality 1/10 Low 0 unhealthy d/yr today · 0 by 30 yrs out
Nearby sold comps map
Loading sold comps map…
Walkable amenities ~0.75 mi
Loading nearby amenities…
Taxation est. · year 1
- Rental income
- $18,157
- − Mortgage interest
- −$6,442
- − Property taxes
- −$2,286
- − Insurance
- −$575
- − Repairs & maintenance
- −$1,453
- − Management
- −$1,453
- − Depreciation
- −$3,345
- Taxable income
- $2,603
- Est. tax owed @ 24.0%
- −$625
- After-tax cash flow
- $3,621/yr
For passive investors: Depreciation is non-cash, so a rental often shows a tax loss while cash-flowing — sheltering income. Rental losses are passive: they offset passive income freely, and up to $25,000/yr can offset ordinary (W-2) income if you actively participate and your MAGI is under $100k (phasing out to $0 by $150k); unused losses carry forward. On sale, claimed depreciation is recaptured at up to 25%, and gains may owe capital-gains tax (a 1031 exchange can defer both). Figures are a year-1 estimate at your 24.0% rate — not tax advice; consult a CPA.
Schools (NCES district)
- District
- Brenham ISD
- NCES district ID
- 4811280
- Math proficiency
- 50% ▼ -4.00%
- Reading proficiency
- 40% ▼ -4.00%
- Median HH income
- $48,090
- Composite
- 38.51/100
- National rank
- #4177
- State rank
- #263 of 826 in TX
Livability — Brenham
- Score
- 75/100
- State rank
- #136
- US rank
- #3978
Category grades
Schools grade is shown separately in the Schools card above.
Census & demographics
- Census place
- Brenham, TX
- County
- Washington County · 29,498 people
- City population
- 29,498
- Metro
- Brenham, TX
- Population (ZIP)
- 29,498
- Household income
- $73,388
- Rent vs Own
- Severe rent burden
- 614.0
Population outlook (Washington County) Hauer SSP2
- Today (2025)
- 37,557 people
- By 2030
- 38,789 · +3.3%
- By 2040
- 41,305 · +10.0%
- By 2050
- 43,687 · +16.3%
- By 2075
- 50,242 · +33.8%
- By 2100
- 53,235 · +41.7%
Race, ethnicity, and origin ACS 2023
- Neighborhood character
- Diverse neighborhood (Simpson 0.59)
- Race & ethnicity
- White 59% Hispanic / Latino 20% Black 16% Two or more races 12% Asian 2%
- Hispanic origin (detail)
- Mexican 18%
- Common ancestry
- Romanian 2% Lithuanian 2% Slovak 1%
- Foreign-born
- 7% · Canada, South Korea
- Languages at home
- 85% English-only · Spanish 12% Tagalog/Filipino 1% Russian/Polish/Slavic 1%
Political lean MEDSL · Washington
- 2024 margin
- Solid R (+54.7) · D 22.3% · R 77.0%
- 2008→2024 swing
- -12.0pp toward R · 2008: -42.7pp · 2024: -54.7pp
- All cycles
- 2024: R+54.7 2020: R+49.9 2016: R+51.3 2012: R+52.0 2008: R+42.7
Not yet ingested
- Civics
- —
Market trends
- HPI YoY
- ▼ -107.24%
- Current HPI
- 192.9078
- Rent YoY
- —
- Metro
- Brenham, TX
- State GDP YoY
- ▲ 3.95%
- F500 in state
- 110
Industry mix (Fortune 500 HQ in TX)
| Industry | F500 HQs | Revenue |
|---|---|---|
| Energy | 16 | $1,198B |
|
||
| Technology | 5 | $198B |
|
||
| Engineering / Construction | 4 | $72B |
|
||
| Energy Services | 3 | $60B |
|
||
| Utilities | 3 | $41B |
|
||
| Healthcare | 2 | $330B |
|
||
Price history
-28.1% since first listed14 events — show timeline
- 2026-06-06 Price Changed $115,000 BCSRMLS
- 2026-06-05 Price Changed $115,000 HARMLS
- 2026-04-29 Listed $130,000 BCSRMLS
- 2026-04-29 Listed $130,000 HARMLS
- 2026-01-14 Listing Removed — HARMLS
- 2025-12-08 Price Changed $120,000 BCSRMLS
- 2025-12-08 Price Changed $120,000 HARMLS
- 2025-11-14 Relisted — BCSRMLS
- 2025-10-23 Relisted — BCSRMLS
- 2025-10-23 Price Changed $135,000 BCSRMLS
- 2025-10-23 Price Changed $135,000 HARMLS
- 2025-10-15 Relisted — BCSRMLS
- 2025-10-04 Listed $160,000 HARMLS
- 2025-10-01 Listed $160,000 BCSRMLS
Property tax history
+12.0%/yrLatest (2025): $2,286 · +68.0% YoY. Source: county tax records.
Cash-flow waterfall
monthlySold comps — $/sqft
last 12 mo · ≤1 miLoading sold comps…