 🏗️ New Construction
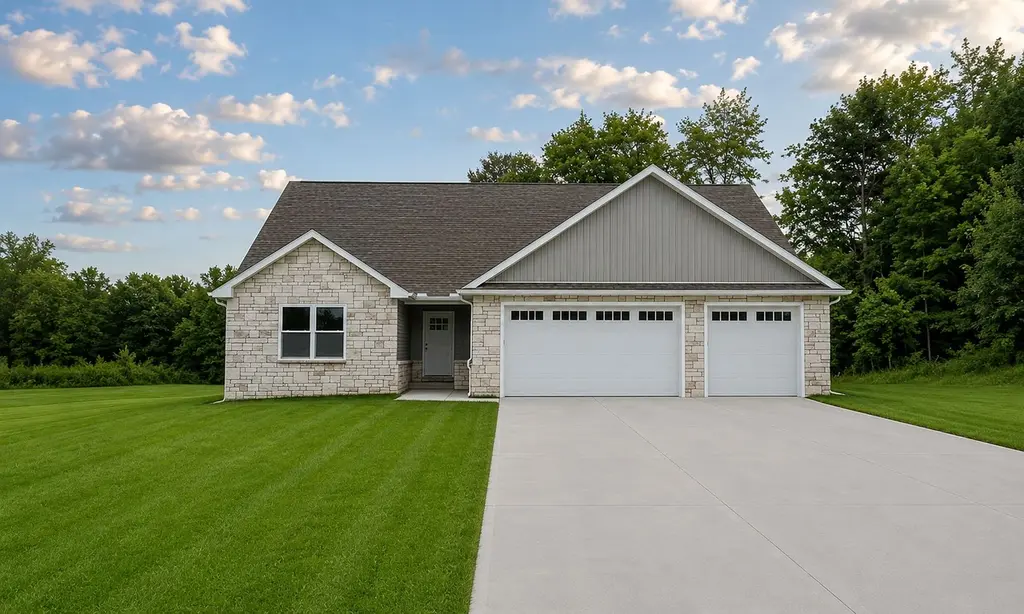
Waverly Plan · Mansfield, OH
Flood risk No data
- FEMA flood zone
- —
- Chance of flooding over 30 yrs
- —
- Est. flood insurance / yr
- —
Fire risk No data
- Est. fire insurance / yr
- —
Heat risk No data
- Hot days now (above threshold)
- —
- Hot days in 30 yrs
- —
Wind risk No data
- Chance of severe wind over 30 yrs
- —
Air-quality risk No data
- Unhealthy air days now
- —
- Unhealthy air days in 30 yrs
- —
Risk factors via First Street. Map © Google.
Why this score? — see what drove the B+ grade
The composite is a weighted blend of 9 inputs, each scored 0–100. Each bar is that input's sub-score; the figure is the points it added to the 100-point composite (weight × sub-score).
- Cash flow +30.0/30.0
- 1% rule +10.0/10.0
- DSCR +10.0/10.0
- Appreciation +9.2/10.0
- ARV discount +7.5/15.0
- Livability +3.8/5.0
- Rent growth +2.5/5.0
- Condition / age +2.5/5.0
- Schools +2.3/10.0
$100
🖨 Deal sheet 📄 Offer letter ✓ Due diligence
Listing remarks
This thoughtfully designed Waverly floor plan offers over 2,000 square feet of stylish, functional living space all on one level. Featuring 3 bedrooms and 2 bathrooms, this home combines open-concept living with everyday comfort and convenience. The spacious great room flows seamlessly into the kitchen and dining area, creating the perfect setup for entertaining or relaxing at home. The private owner's suite includes a large bedroom, walk-in closet, and spa-like bath with a beautifully designed shower. Two additional bedrooms provide flexibility for guests, family, or a home office. A dedicated laundry room, attached garage, and ample storage throughout add to the home's practicality. Enjoy
Key facts
- 3 parking spots
- Listed 27 days
Property features AI
Finance
- Financial info: List price: 100
Exterior
- Parking: 3 parking spaces
- Utilities: Natural gas heating; Electric for cooling
- Home design: Waverly plan; New construction plan
- Construction: 2013 living area (listed value)
- Exterior features: Composition roof
Interior
- Bedrooms: 3 bedrooms
- Bathrooms: 2 full bathrooms
- Heating & cooling: Natural gas forced air heating; Central air conditioning
- Interior features: Active listing (Plan: Waverly)
Neighborhood map
What this means for you Summary
Snapshot
- This is a 3-bed/2.0-bath single-family listed at $100.
Deal economics
- At list price, monthly cash flow is $457 ($5k/yr) — positive.
- The deal already cash-flows at list — no discount required.
- Meets the 1% rule at list price ($1k rent vs $100).
- Recommended offer: $98 (2.0% below list) — sets the bar for market timing.
- Cap rate 14.1% vs local median 4.2% in Mansfield — top-decile yield for the area; either an underpriced asset or a hidden risk that comps aren't pricing in. Stress-test before assuming the spread holds.
Location & tenants
- Location reads 76/100 on livability (#224 in OH, #3,525 nationally) — a middle-class / working-renter tenant base. Strengths: commute A+, cost of living A+, housing A+; Watch: schools C-, crime D-, amenities D-.
- Mansfield City (urban): math 24% / reading 33% proficiency, ranked #590 of 656 in OH (top 90%) — low school quality limits family demand, transient renter base, plan for 1-2y turnover; 80% free/reduced lunch — lower-income household profile, screen leases tightly.
- Market conditions: 30 active listings in the ZIP; 1 comparable units currently listed for rent nearby; lower-income renter base — watch delinquency; 145 units permitted in Richland County in 2024 (0 in 5+ unit buildings).
- At $1,195/mo this rent would consume 45% of the median local household income ($32k/yr) — very limited rent-growth headroom before tenants either downsize or default.
Forward outlook
- In year one you build about $6k of equity ($487 loan paydown + $6k appreciation (8.4% local appreciation)).
- Richland County population projected at -18% by 2050 — secular population decline; favor cash flow + early exit over multi-decade hold.
- At projected returns (8.4% appreciation + 3.0% rent growth), your $20k cash investment doubles in ~2 years — after that, you're playing with house money.
- By year 6, paydown + projected appreciation supports a ~$37k cash-out refi (75% LTV) — recoverable capital for the next deal without selling this one.
Negotiation context
- It's been on market 28 days — a 2% lower offer ($98) is reasonable based on typical stale-listing flexibility.
Risks & watch-outs
- Watch-outs: property tax is 1056.8% of price.
Questions for the listing agent
- Property tax is high relative to price — has the assessment been appealed recently, and will the sale trigger a re-assessment?
- Is there a deadline driving the sale (1031 exchange, divorce, estate, relocation)? That informs how much negotiation room exists.
- Crime grade is D in this area — have there been break-ins, vandalism, or insurance claims at this property in the last 3 years? What carrier currently insures it and at what premium?
- What's the average days-on-market for RENTAL listings here right now (not sales)? A rising rental-DOM trend means longer vacancies and softer asking-rent achievability than the comps imply.
- What's the recent tenant-quality profile in this submarket — average credit score on applications, eviction rate, late-payment / NSF rate, and stable-employment percentage? A property-management company in the area should have these aggregated.
- How much new for-sale + rental construction is in the pipeline within 1–3 miles? Heavy new supply typically softens prices + rents 12–24 months out; constrained supply supports both.
Investment metrics
- 1% rule
- 1.70% ✓
- Cap rate
- 14.08%
- Cash-on-cash
- 27.81%
- DSCR
- 2.24
- GRM
- 4.9
CMA / ARV
- ARV (on-the-fly)
- $70,455
- Comps found
- 8
Show comp detail 8 sales within ~0.75 mi
| Address | Dist | Beds/Ba | Sqft | Sold | Price | $/sf | Match |
|---|---|---|---|---|---|---|---|
| 181 Second St | 0.43mi | 3/2.0 | 1,990 (-1%) | 23mo | $95,000 | $48 | 59 |
| 272 W 5th St | 0.55mi | 3/1.0 | 1,915 (-5%) | 6mo | $135,000 | $70 | 58 |
| 228 Clairmont Ave | 0.45mi | 3/2.0 | 2,268 (+13%) | 6mo | $79,900 | $35 | 53 |
| 135 Wood St | 0.55mi | 3/2.0 | 2,260 (+12%) | 2mo | $85,000 | $38 | 52 |
| 109 W 5th St | 0.32mi | 4/1.5 (+1) | 1,798 (-11%) | 14mo | $22,000 | $12 | 48 |
| 203 Home Ave | 0.63mi | 3/2.0 | 1,748 (-13%) | 2mo | $38,000 | $22 | 47 |
| 146 Boughton Ave | 0.31mi | 3/1.5 | 1,728 (-14%) | 16mo | $20,000 | $12 | 46 |
| 114 Vennum Ave | 0.74mi | 4/1.0 (+1) | 1,724 (-14%) | 4mo | $50,000 | $29 | 29 |
Match score weights: distance 35% · size 25% · config 20% · recency 20%. Top-matched comps best support the ARV.
Projected returns pro-forma
8.45% appreciation · 3.0% rent growth · sell at horizon
- IRR
- 42.9%
- Equity multiple
- 4.05×
- Total profit
- $60,206
- Equity at exit
- $55,706
- IRR
- 38.1%
- Equity multiple
- 8.77×
- Total profit
- $153,226
- Equity at exit
- $112,722
Cash invested: $19,727 (down + closing). Projections, not guarantees.
Landlord ↔ Tenant lean methodology
- Overall (STATE)
- 73 Landlord-Friendly
- State Ohio
- 73 Landlord-Friendly · R+6
- County
- — inherits STATE
- City
- — inherits STATE
ZIP-level market 44902
- Home prices YoY
- 2.9%
- Active inventory
- 30
Monthly cashflow live
- Estimated rent
- $1,195 medium interval (Pro) →
- Mortgage (P&I)
- −$369
- Tax est. 1.5%
- −$88 /mo · $1,057/yr
- Insurance
- −$29
- HOA
- −$0
- Vacancy / Maint / Mgmt
- −$251
- Net cashflow
- $457
Break-even live
UW: 25.0% down · 7.5% · 30yr · 1.5% tax · 5.0% vac · 8.0% maint · 8.0% mgmt
Financing live
Cash to close
- Down payment
- $17,614
- Closing costs
- $2,114
- Reserves months
- —
- Total cash needed
- —
Loan-product check · same deal, 3 products live
Conventional
25% down · 7.5% · 30yr
- Down + closing
- —
- Monthly P&I
- —
- Monthly cashflow
- —
- DSCR
- —
- Eligible?
- —
Personal DTI + credit; lowest rate.
DSCR
20% down · 8.5% · 30yr
- Down + closing
- —
- Monthly P&I
- —
- Monthly cashflow
- —
- DSCR
- —
- Eligible?
- —
No personal income docs; deal must DSCR.
Hard money
10% down · 12.0% · 12mo
- Down + closing
- —
- Monthly P&I
- —
- Monthly cashflow
- —
- DSCR
- —
- Eligible?
- —
Short-term bridge; refi at stabilization.
Rent comps 1 comps
| Address | Beds | Baths | Sqft | Rent | $/sqft | DOM | Units | Dist |
|---|---|---|---|---|---|---|---|---|
| 243 W 1st St Mansfield, OH | 4.0 | 1.0 | 1470 | $1,195 | $0.81 | 44d | 1 | 0.45mi |
Listing history 16 events
-
2026-06-19days on market $100 Active 28 DOM
-
2026-06-18days on market $100 Active 27 DOM
-
2026-06-17days on market $100 Active 26 DOM
-
2026-06-16days on market $100 Active 25 DOM
-
2026-06-15days on market $100 Active 24 DOM
-
2026-06-14days on market $100 Active 22 DOM
-
2026-06-12days on market $100 Active 21 DOM
-
2026-06-09days on market $100 Active 18 DOM
-
2026-06-08days on market $100 Active 17 DOM
-
2026-06-07days on market $100 Active 16 DOM
-
2026-06-05days on market $100 Active 13 DOM
-
2026-06-03days on market $100 Active 12 DOM
-
2026-06-02days on market $100 Active 11 DOM
-
2026-06-01days on market $100 Active 10 DOM
-
2026-05-31days on market $100 Active 9 DOM
-
2026-05-30days on market $100 Active 8 DOM
ⓘ Source: listings_history table (triggers on properties + properties_extension) + one-shot
backfill from property_details.listing_events for pre-trigger history.
Nearby sold comps map
Loading sold comps map…
Walkable amenities ~0.75 mi
Loading nearby amenities…
Taxation est. · year 1
- Rental income
- $14,340
- − Mortgage interest
- −$3,947
- − Property taxes
- −$1,057
- − Insurance
- −$352
- − Repairs & maintenance
- −$1,147
- − Management
- −$1,147
- − Depreciation
- −$2,050
- Taxable income
- $4,640
- Est. tax owed @ 24.0%
- −$1,114
- After-tax cash flow
- $4,372/yr
For passive investors: Depreciation is non-cash, so a rental often shows a tax loss while cash-flowing — sheltering income. Rental losses are passive: they offset passive income freely, and up to $25,000/yr can offset ordinary (W-2) income if you actively participate and your MAGI is under $100k (phasing out to $0 by $150k); unused losses carry forward. On sale, claimed depreciation is recaptured at up to 25%, and gains may owe capital-gains tax (a 1031 exchange can defer both). Figures are a year-1 estimate at your 24.0% rate — not tax advice; consult a CPA.
Schools (NCES district)
- District
- Mansfield City
- NCES district ID
- 3904429
- Math proficiency
- 24% ▼ -19.00%
- Reading proficiency
- 33% ▼ -12.00%
- Median HH income
- $32,435
- Composite
- 23.25/100
- National rank
- #7934
- State rank
- #590 of 656 in OH
Livability — Mansfield
- Score
- 76/100
- State rank
- #224
- US rank
- #3525
Category grades
Schools grade is shown separately in the Schools card above.
Census & demographics
- Census place
- Mansfield, OH
- County
- Richland · 128,966 people
- City population
- 16,349
- Metro
- Mansfield, OH
- Population (ZIP)
- 4,876
- Household income
- $31,619
- Rent vs Own
- Severe rent burden
- 13.2
Population outlook (Richland County) Hauer SSP2
- Today (2025)
- 115,577 people
- By 2030
- 111,669 · -3.4%
- By 2040
- 103,323 · -10.6%
- By 2050
- 95,135 · -17.7%
- By 2075
- 76,719 · -33.6%
- By 2100
- 57,188 · -50.5%
Race, ethnicity, and origin ACS 2023
- Neighborhood character
- Diverse neighborhood (Simpson 0.61)
- Race & ethnicity
- White 52% Black 35% Two or more races 10% Hispanic / Latino 5%
- Common ancestry
- Italian 2% Serbian 2% Iranian 1%
- Foreign-born
- 1% · Canada
- Languages at home
- 95% English-only · Spanish 4% Other Indo-European 1%
Political lean MEDSL · Richland
- 2024 margin
- Solid R (+42.3) · D 28.4% · R 70.8%
- 2008→2024 swing
- -28.8pp toward R · 2008: -13.6pp · 2024: -42.3pp
- All cycles
- 2024: R+42.3 2020: R+39.7 2016: R+37.5 2012: R+20.1 2008: R+13.6
Not yet ingested
- Civics
- —
Market trends
- HPI YoY
- ▲ 8.45%
- Current HPI
- 302.035
- Rent YoY
- —
- Metro
- —
- State GDP YoY
- ▲ 1.98%
- F500 in state
- 48
Industry mix (Fortune 500 HQ in OH)
| Industry | F500 HQs | Revenue |
|---|---|---|
| Insurance | 3 | $145B |
|
||
| Industrial Machinery | 3 | $49B |
|
||
| Financial Services | 3 | $24B |
|
||
| Consumer Goods | 2 | $93B |
|
||
| Aerospace / Defense | 2 | $47B |
|
||
| Utilities | 2 | $33B |
|
||
Cash-flow waterfall
monthlySold comps — $/sqft
last 12 mo · ≤1 miLoading sold comps…