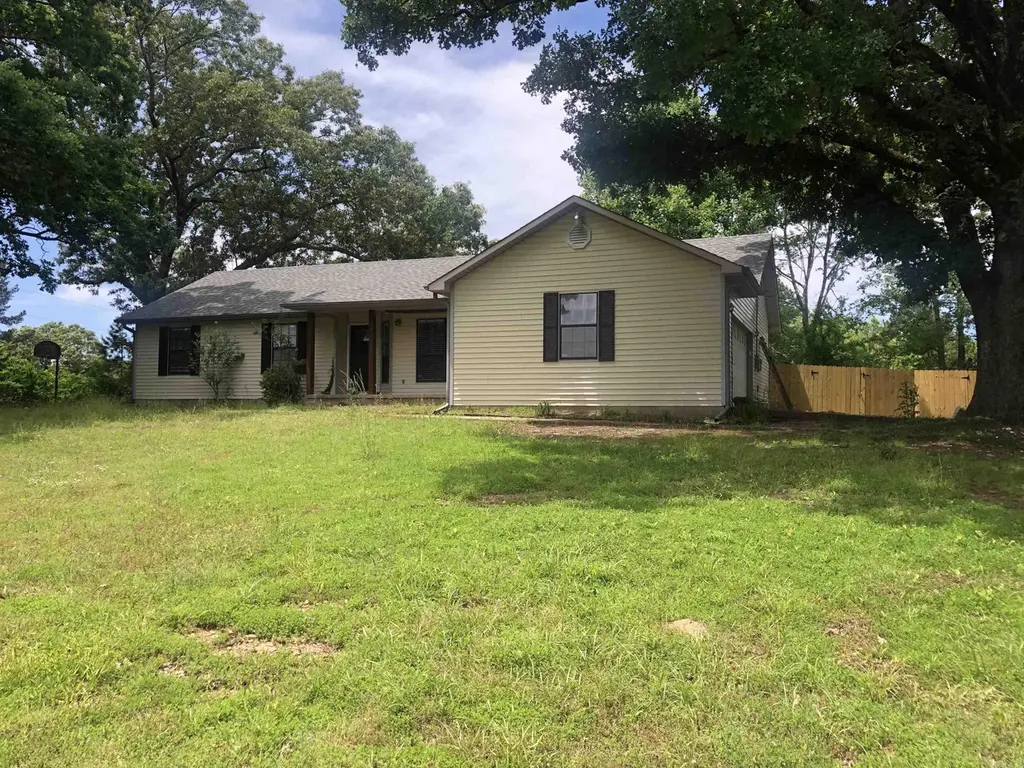
4159 Salt Creek Rd · Benton, AR
Flood risk 1/10 · Minimal
- FEMA flood zone
- X (unshaded)
- Chance of flooding over 30 yrs
- 0.0%
- Est. flood insurance / yr
- $507 – $1,088
Fire risk 4/10 · Minor
- Est. fire insurance / yr
- $1,499 – $2,785
Heat risk 6/10 · Moderate
- Hot days now (above 110°F)
- 7 days/yr
- Hot days in 30 yrs
- 19 days/yr
Wind risk 4/10 · Minor
- Chance of severe wind over 30 yrs
- 11.0%
Air-quality risk 2/10 · Minimal
- Unhealthy air days now
- 0 days/yr
- Unhealthy air days in 30 yrs
- 1 days/yr
Risk factors via First Street. Map © Google.
Why this score? — see what drove the C- grade
The composite is a weighted blend of 9 inputs, each scored 0–100. Each bar is that input's sub-score; the figure is the points it added to the 100-point composite (weight × sub-score).
- Cash flow +17.1/30.0
- ARV discount +13.1/15.0
- DSCR +5.3/10.0
- Schools +4.1/10.0
- 1% rule +3.6/10.0
- Rent growth +3.6/5.0
- Livability +3.3/5.0
- Condition / age +2.5/5.0
- Appreciation +0.0/10.0
$215,000
🖨 Deal sheet 📄 Offer letter ✓ Due diligence
Listing remarks MLS
VERY WELL KEPT HOME ON A LITTLE OVER AN ACRE. HOME HAS A NEWER FURNACE AND A COVERED DECK SO YOU CAN ENJOY THE WILDLIFE THAT COMES UP. BEAUTIFUL MATURE TREES IN FRONT YARD AND THE COVERED DECK OUT BACK MAKES THIS A PLACE YOU CAN REALLY ENJOY. NO PROPERTY DISCLOSURE AVAILABLE.
Key facts
- Covered deck
- Newer furnace
- Mature trees
Tags
Property features AI
Finance
- Financial info: Financing options include VA, FHA, and conventional loans
Exterior
- Parking: Attached or detached garage for 2 cars
- Utilities: Septic system; Public water; Natural gas
- Home design: Metal/vinyl siding; Crawl space foundation
- Construction: Composition roof
- Exterior features: Deck; Porch; Sloped, cleared rural lot; Not in a subdivision; Up-slope lot character
Interior
- Kitchen: Free-standing stove; Electric range; Dishwasher; Pantry
- Flooring: Carpet; Vinyl
- Bathrooms: Two full bathrooms
- Heating & cooling: Central gas heat; Central electric cooling
- Interior features: Washer connection; Electric dryer connection; Gas water heater; Window treatments; Ceiling fans; Sheetrock walls/ceilings
- Laundry & utility: Washer connection; Electric dryer connection
Neighborhood map
What this means for you Summary
Snapshot
- This is a 3-bed/2.0-bath single-family listed at $215k.
Deal economics
- At list price, monthly cash flow is $149 ($2k/yr) — positive.
- The deal already cash-flows at list — no discount required.
- To meet the 1% rule (rent ≥ 1% of price), the offer needs to be $186k (13.7% below list).
- Recommended offer: $186k (13.7% below list) — sets the bar for 1% rule.
- Cap rate 7.1% vs local median 4.5% in Benton — top-decile yield for the area; either an underpriced asset or a hidden risk that comps aren't pricing in. Stress-test before assuming the spread holds.
Location & tenants
- Location reads 66/100 on livability (#119 in AR) — a middle-class / working-renter tenant base. Strengths: cost of living A+, housing A+; Watch: crime D, amenities F, commute F.
- Benton School District (suburban): math 51% / reading 43% proficiency, ranked #25 of 238 in AR (top 10%) — families likely to look elsewhere, expect single-tenant / working-renter base with shorter leases.
- Market conditions: Rents rising fast (+4.5%/yr); 244 active listings in the ZIP; 3 comparable units currently listed for rent nearby; rentals at typical pace (median 24d on market — plan ~3-4 weeks tenant-placement turnaround); solid renter incomes; 446 units permitted in Saline County in 2024 (0 in 5+ unit buildings).
Forward outlook
- Local home prices are declining (-3.0%/yr); year-one equity from $1k of loan paydown is wiped out by about $6k of value loss. Plan a longer hold.
- Saline County population projected at +39% by 2050 — long-run rental-demand tailwind backs the buy-and-hold thesis.
Negotiation context
- It's been on market 38 days — a 3% lower offer ($209k) is reasonable based on typical stale-listing flexibility.
- 3 sale attempts since 5y ago; this cycle's ask has dropped $30k (12%) from the opening price — seller is motivated, your offer sets the floor, not the list.
Risks & watch-outs
- Climate carrying-cost: extreme-heat days projected 7→19/yr by 2055 (HVAC capex compounding) — expect insurance premiums to compound above CPI over the hold.
Questions for the listing agent
- It's been on market 38 days. Have you received any prior offers? Is the seller open to a 14% concession, seller financing, or rate buy-down credit?
- Is there a deadline driving the sale (1031 exchange, divorce, estate, relocation)? That informs how much negotiation room exists.
- Crime grade is D in this area — have there been break-ins, vandalism, or insurance claims at this property in the last 3 years? What carrier currently insures it and at what premium?
- What's the average days-on-market for RENTAL listings here right now (not sales)? A rising rental-DOM trend means longer vacancies and softer asking-rent achievability than the comps imply.
- What's the recent tenant-quality profile in this submarket — average credit score on applications, eviction rate, late-payment / NSF rate, and stable-employment percentage? A property-management company in the area should have these aggregated.
- How much new for-sale + rental construction is in the pipeline within 1–3 miles? Heavy new supply typically softens prices + rents 12–24 months out; constrained supply supports both.
Investment metrics
- 1% rule
- 0.86% ✗
- Cap rate
- 7.12%
- Cash-on-cash
- 2.97%
- DSCR
- 1.13
- GRM
- 9.7
CMA / ARV
- ARV (median comp)
- $245,779
- List price
- $215,000
- Delta
- -12.52%
- Verdict
- UNDERPRICED
- Comps
- 20 within 1.0 mi
Show comp detail 6 sales within ~0.75 mi
| Address | Dist | Beds/Ba | Sqft | Sold | Price | $/sf | Match |
|---|---|---|---|---|---|---|---|
| 1004 Stamford Dr | 0.23mi | 3/2.0 | 1,640 (+5%) | 10mo | $225,000 | $137 | 72 |
| 1204 Oxford Ave | 0.41mi | 3/2.0 | 1,698 (+9%) | 1mo | $255,000 | $150 | 65 |
| 1240 Oxford | 0.45mi | 3/2.0 | 1,698 (+9%) | 1mo | $255,000 | $150 | 63 |
| 508 Spuds Ln | 0.17mi | 3/2.0 | 1,332 (-14%) | 6mo | $202,000 | $152 | 63 |
| 5701 Mcgee Rd | 0.68mi | 3/2.0 | 1,623 (+4%) | 9mo | $315,000 | $194 | 54 |
| 3010 Salt Creek Rd | 0.66mi | 3/2.5 | 1,690 (+8%) | 23mo | $230,000 | $136 | 34 |
Match score weights: distance 35% · size 25% · config 20% · recency 20%. Top-matched comps best support the ARV.
Projected returns pro-forma
-3.0% appreciation · 4.53% rent growth · sell at horizon
- IRR
- -10.1%
- Equity multiple
- 0.63×
- Total profit
- $-22,540
- Equity at exit
- $32,057
- IRR
- 1.0%
- Equity multiple
- 1.08×
- Total profit
- $4,546
- Equity at exit
- $18,589
Cash invested: $60,200 (down + closing). Projections, not guarantees.
Landlord ↔ Tenant lean methodology
- Overall (STATE)
- 92 Strongly Landlord-Friendly
- State Arkansas
- 92 Strongly Landlord-Friendly · R+14
- County
- — inherits STATE
- City
- — inherits STATE
ZIP-level market 72019
- Home prices YoY
- -12.2%
- Rents YoY
- 4.5%
- Active inventory
- 244
- Price-to-rent
- 9.7×
Monthly cashflow live
- Estimated rent
- $1,856 medium interval (Pro) →
- Mortgage (P&I)
- −$1,127
- Tax from tax record
- −$100 /mo · $1,205/yr
- Insurance
- −$90
- HOA
- −$0
- Vacancy / Maint / Mgmt
- −$390
- Net cashflow
- $149
Break-even live
UW: 25.0% down · 7.5% · 30yr · 1.5% tax · 5.0% vac · 8.0% maint · 8.0% mgmt
Financing live
Cash to close
- Down payment
- $53,750
- Closing costs
- $6,450
- Reserves months
- —
- Total cash needed
- —
Loan-product check · same deal, 3 products live
Conventional
25% down · 7.5% · 30yr
- Down + closing
- —
- Monthly P&I
- —
- Monthly cashflow
- —
- DSCR
- —
- Eligible?
- —
Personal DTI + credit; lowest rate.
DSCR
20% down · 8.5% · 30yr
- Down + closing
- —
- Monthly P&I
- —
- Monthly cashflow
- —
- DSCR
- —
- Eligible?
- —
No personal income docs; deal must DSCR.
Hard money
10% down · 12.0% · 12mo
- Down + closing
- —
- Monthly P&I
- —
- Monthly cashflow
- —
- DSCR
- —
- Eligible?
- —
Short-term bridge; refi at stabilization.
Rent comps 3 comps
| Address | Beds | Baths | Sqft | Rent | $/sqft | DOM | Units | Dist |
|---|---|---|---|---|---|---|---|---|
| 1205 Copper Creek Dr Benton, AR | 3.0 | 2.0 | 1056 | $1,400 | $1.33 | 43d | 1 | 1.25mi |
| 4041 Elizabeth Ct Benton, AR | 4.0 | 3.0 | 2070 | $2,500 | $1.21 | 14d | 1 | 1.37mi |
| 3537 Terrace Hill Ct Benton, AR | 3.0 | 2.0 | 1290 | $1,500 | $1.16 | 23d | 1 | 1.45mi |
Listing history 19 events
-
2026-06-13statusdays on market $215,000 Under Contract 38 DOM
-
2026-06-10days on market $215,000 Active 37 DOM
-
2026-06-09days on market $215,000 Active 36 DOM
-
2026-06-08days on market $215,000 Active 35 DOM
-
2026-06-07days on market $215,000 Active 34 DOM
-
2026-06-03statusdays on market $215,000 Active 30 DOM
-
2026-06-02days on market $215,000 Price Change 29 DOM
-
2026-06-01days on market $215,000 Price Change 28 DOM
-
2026-05-31days on market $215,000 Price Change 27 DOM
-
2026-05-31days on market $215,000 Price Change 26 DOM
-
2026-05-04$245,000 New Listing 219-char remark
-
2026-02-12soldstatus $215,000
-
2022-02-22soldstatus $161,726
-
2022-02-11soldstatus $161,726 Sold 276-char remark
Show marketing remark (276 chars)
VERY WELL KEPT HOME ON A LITTLE OVER AN ACRE. HOME HAS A NEWER FURNACE AND A COVERED DECK SO YOU CAN ENJOY THE WILDLIFE THAT COMES UP. BEAUTIFUL MATURE TREES IN FRONT YARD AND THE COVERED DECK OUT BACK MAKES THIS A PLACE YOU CAN REALLY ENJOY. NO PROPERTY DISCLOSURE AVAILABLE.
-
2022-02-11soldstatus $161,726
Show marketing remark (276 chars)
VERY WELL KEPT HOME ON A LITTLE OVER AN ACRE. HOME HAS A NEWER FURNACE AND A COVERED DECK SO YOU CAN ENJOY THE WILDLIFE THAT COMES UP. BEAUTIFUL MATURE TREES IN FRONT YARD AND THE COVERED DECK OUT BACK MAKES THIS A PLACE YOU CAN REALLY ENJOY. NO PROPERTY DISCLOSURE AVAILABLE.
-
2021-12-30status Under Contract 276-char remark
Show marketing remark (276 chars)
VERY WELL KEPT HOME ON A LITTLE OVER AN ACRE. HOME HAS A NEWER FURNACE AND A COVERED DECK SO YOU CAN ENJOY THE WILDLIFE THAT COMES UP. BEAUTIFUL MATURE TREES IN FRONT YARD AND THE COVERED DECK OUT BACK MAKES THIS A PLACE YOU CAN REALLY ENJOY. NO PROPERTY DISCLOSURE AVAILABLE.
-
2021-11-24$218,000 New Listing 276-char remark
Show marketing remark (276 chars)
VERY WELL KEPT HOME ON A LITTLE OVER AN ACRE. HOME HAS A NEWER FURNACE AND A COVERED DECK SO YOU CAN ENJOY THE WILDLIFE THAT COMES UP. BEAUTIFUL MATURE TREES IN FRONT YARD AND THE COVERED DECK OUT BACK MAKES THIS A PLACE YOU CAN REALLY ENJOY. NO PROPERTY DISCLOSURE AVAILABLE.
-
2021-11-24$218,000
Show marketing remark (276 chars)
VERY WELL KEPT HOME ON A LITTLE OVER AN ACRE. HOME HAS A NEWER FURNACE AND A COVERED DECK SO YOU CAN ENJOY THE WILDLIFE THAT COMES UP. BEAUTIFUL MATURE TREES IN FRONT YARD AND THE COVERED DECK OUT BACK MAKES THIS A PLACE YOU CAN REALLY ENJOY. NO PROPERTY DISCLOSURE AVAILABLE.
-
1993-07-01soldstatus $79,000
ⓘ Source: listings_history table (triggers on properties + properties_extension) + one-shot
backfill from property_details.listing_events for pre-trigger history.
Tax reassessment forecast AR · Resets to sale price
- Current annual tax
- $1,205 · $100/mo
- Projected year-2 tax
- $1,376 · $115/mo
- Expected delta
- +$171/yr (+$14/mo · 14.2%)
ⓘ Screening estimate from a state-policy table — verify with the county assessor before closing.
Climate risk First Street
- Flood 1/10 Low FEMA zone X (unshaded) · 0% chance over 30 yrs
- Wildfire 4/10 Moderate
- Heat 6/10 Major 7 d/yr ≥110°F today · 19 d/yr by 30 yrs out
- Wind 4/10 Moderate 11% chance of damaging wind over 30 yrs
- Air quality 2/10 Low 0 unhealthy d/yr today · 1 by 30 yrs out
Nearby sold comps map
Loading sold comps map…
Walkable amenities ~0.75 mi
Loading nearby amenities…
Taxation est. · year 1
- Rental income
- $22,272
- − Mortgage interest
- −$12,043
- − Property taxes
- −$1,205
- − Insurance
- −$1,075
- − Repairs & maintenance
- −$1,782
- − Management
- −$1,782
- − Depreciation
- −$6,255
- Taxable loss
- −$1,869
- Est. tax savings @ 24.0%
- +$449
- After-tax cash flow
- $2,234/yr
For passive investors: Depreciation is non-cash, so a rental often shows a tax loss while cash-flowing — sheltering income. Rental losses are passive: they offset passive income freely, and up to $25,000/yr can offset ordinary (W-2) income if you actively participate and your MAGI is under $100k (phasing out to $0 by $150k); unused losses carry forward. On sale, claimed depreciation is recaptured at up to 25%, and gains may owe capital-gains tax (a 1031 exchange can defer both). Figures are a year-1 estimate at your 24.0% rate — not tax advice; consult a CPA.
Schools (NCES district)
- District
- Benton School District
- NCES district ID
- 0502960
- Math proficiency
- 51% ▼ -10.00%
- Reading proficiency
- 43% ▼ -10.00%
- Median HH income
- $51,870
- Composite
- 40.52/100
- National rank
- #3707
- State rank
- #25 of 238 in AR
Livability — Benton
- Score
- 66/100
- State rank
- #119
- US rank
- #11460
Category grades
Schools grade is shown separately in the Schools card above.
Census & demographics
- County
- Saline County · 77,216 people
- City population
- 58,767
- Metro
- Little Rock-North Little Rock-Conway, AR
- Population (ZIP)
- 30,055
- Household income
- $87,869
- Rent vs Own
- Severe rent burden
- 331.0
Population outlook (Saline County) Hauer SSP2
- Today (2025)
- 140,141 people
- By 2030
- 151,233 · +7.9%
- By 2040
- 173,100 · +23.5%
- By 2050
- 194,368 · +38.7%
- By 2075
- 245,295 · +75.0%
- By 2100
- 279,117 · +99.2%
Race, ethnicity, and origin ACS 2023
- Neighborhood character
- Predominantly White (83%)
- Race & ethnicity
- White 83% Hispanic / Latino 8% Two or more races 5% Black 3% Asian 2%
- Hispanic origin (detail)
- Mexican 6%
- Common ancestry
- Italian 3% Slovak 2% Lithuanian 2%
- Foreign-born
- 3% · Canada, China, Vietnam
- Languages at home
- 92% English-only · Spanish 6% Vietnamese 1%
Political lean MEDSL · Saline
- 2024 margin
- Solid R (+40.1) · D 28.8% · R 69.0% · Other 2.2%
- 2008→2024 swing
- +0.8pp no change · 2008: -41.0pp · 2024: -40.1pp
- All cycles
- 2024: R+40.1 2020: R+41.2 2016: R+43.5 2012: R+42.7 2008: R+41.0
Not yet ingested
- Civics
- —
Market trends
- HPI YoY
- ▼ -29.95%
- Current HPI
- 215.1912
- Rent YoY
- ▲ 4.53%
- Metro
- Little Rock-North Little Rock-Conway, AR
- State GDP YoY
- ▲ 3.80%
- F500 in state
- 10
Industry mix (Fortune 500 HQ in AR)
| Industry | F500 HQs | Revenue |
|---|---|---|
| Retail | 1 | $681B |
|
||
| Food / Agriculture | 1 | $53B |
|
||
| Retail / Energy | 1 | $22B |
|
||
| Transportation / Logistics | 1 | $12B |
|
||
| Energy | 1 | $4B |
|
||
Price history
+172.2% since first listed12 events — show timeline
- 2026-06-11 Pending — CARMLS
- 2026-05-28 Price Changed $215,000 CARMLS
- 2026-05-21 Price Changed $230,000 CARMLS
- 2026-05-04 Listed $245,000 CARMLS
- 2026-02-12 Sold (Public Records) $215,000 Public Records
- 2022-02-22 Sold (Public Records) $161,726 Public Records
- 2022-02-11 Sold (MLS) $161,726 CARMLS
- 2022-02-11 Sold (MLS) $161,726 HSBOR
- 2021-12-30 Pending — CARMLS
- 2021-11-24 Listed $218,000 CARMLS
- 2021-11-24 Listed $218,000 HSBOR
- 1993-07-01 Sold (Public Records) $79,000 Public Records
Property tax history
+7.4%/yrLatest (2025): $1,205 · -7.7% YoY. Source: county tax records.
Cash-flow waterfall
monthlySold comps — $/sqft
last 12 mo · ≤1 miLoading sold comps…