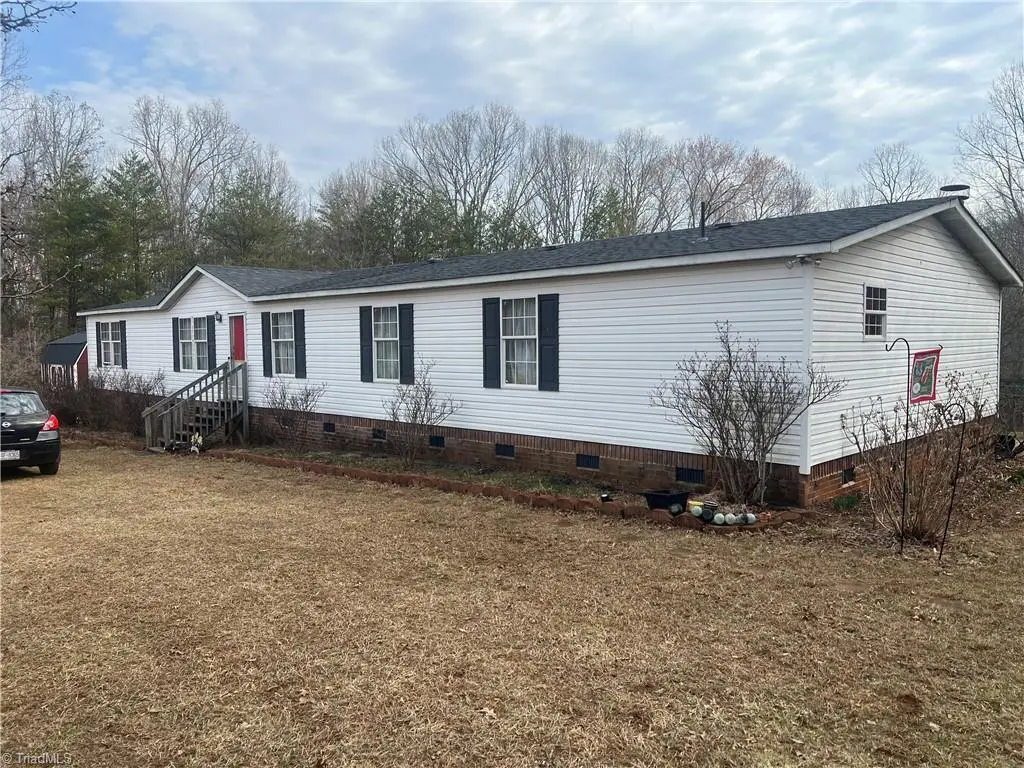
1024 Frans Rd · Pilot Mountain, NC
Flood risk 1/10 · Minimal
- FEMA flood zone
- X (unshaded)
- Chance of flooding over 30 yrs
- 0.0%
- Est. flood insurance / yr
- $507 – $1,088
Fire risk 4/10 · Minor
- Est. fire insurance / yr
- $906 – $1,684
Heat risk 5/10 · Moderate
- Hot days now (above 101°F)
- 7 days/yr
- Hot days in 30 yrs
- 19 days/yr
Wind risk 2/10 · Minimal
- Chance of severe wind over 30 yrs
- 3.0%
Air-quality risk 1/10 · Minimal
- Unhealthy air days now
- 0 days/yr
- Unhealthy air days in 30 yrs
- 0 days/yr
Risk factors via First Street. Map © Google.
Why this score? — see what drove the D+ grade
The composite is a weighted blend of 9 inputs, each scored 0–100. Each bar is that input's sub-score; the figure is the points it added to the 100-point composite (weight × sub-score).
- ARV discount +15.0/15.0
- Appreciation +10.0/10.0
- Cash flow +7.4/30.0
- Schools +4.0/10.0
- Livability +3.2/5.0
- Rent growth +2.5/5.0
- Condition / age +2.5/5.0
- DSCR +1.5/10.0
- 1% rule +1.1/10.0
$215,000
🖨 Deal sheet 📄 Offer letter ✓ Due diligence
Listing remarks
* * * JUDICIAL SALE * * * An acceptable offer will be submitted and will be subject to a 10 day upset bid period. 10% deposit is required. No FHA, VA, or USDA loans. This 4 bedroom 2001 manufactured home sits on 1.75 acres. According to seller, roof, HVAC, well pump, refrigerator, microwave, and dishwasher have all been replaced within the last 5 years. Flowering trees and plants abound on the property. Home is being sold "as is" with no repairs being offered.
Key facts
- Hvac replaced
- Dishwasher replaced
- Microwave replaced
Tags
Property features AI
Finance
- Other: Property is residential manufactured housing; Building area reported as 2,052 (unit omitted); Total of 8 rooms
- HOA & community: No homeowners association
Exterior
- Parking: No garage; field parking
- Utilities: Septic tank sewer; Electric water heater (listed under utilities); Well water
- Home design: Manufactured home (double wide); Single-story; Built in 2001; Existing structure; Publicly maintained road access
- Construction: Vinyl siding; Crawl space foundation
- Exterior features: No fencing; Well water
Interior
- Kitchen: Kitchen on the main level
- Bedrooms: Bedrooms on the main level
- Flooring: Carpet; Vinyl
- Bathrooms: Two full bathrooms; One half bathroom
- Heating & cooling: Heat pump for heating and cooling; Electric heating
- Interior features: Primary bedroom located on the main level; Crawl space basement; One fireplace in the great room
- Laundry & utility: Electric water heater
Neighborhood map
What this means for you Summary
Snapshot
- This is a 4-bed/2.0-bath single-family listed at $215k.
Deal economics
- At list price, monthly cash flow is $-281 ($-3k/yr) — negative.
- To cash-flow at today's rent, offer at most $165k (23.0% below list).
- To meet the 1% rule (rent ≥ 1% of price), the offer needs to be $131k (39.2% below list).
- Recommended offer: $131k (39.2% below list) — sets the bar for 1% rule.
- Cap rate 4.7% vs local median 2.2% in Pilot Mountain — top-decile yield for the area; either an underpriced asset or a hidden risk that comps aren't pricing in. Stress-test before assuming the spread holds.
Location & tenants
- Location reads 65/100 on livability (#309 in NC) — a middle-class / working-renter tenant base. Strengths: crime A+, cost of living A+; Watch: schools D+, amenities F, commute F.
- Stokes County Schools (rural): math 48% / reading 46% proficiency, ranked #78 of 178 in NC (top 44%) — families likely to look elsewhere, expect single-tenant / working-renter base with shorter leases.
- Market conditions: 34 active listings in the ZIP; 230 units permitted in Stokes County in 2024 (0 in 5+ unit buildings).
Forward outlook
- In year one you build about $23k of equity ($1k loan paydown + $22k appreciation (10.0% local appreciation)).
- Stokes County population projected at -26% by 2050 — secular population decline; favor cash flow + early exit over multi-decade hold.
- By year 2, paydown + projected appreciation supports a ~$37k cash-out refi (75% LTV) — recoverable capital for the next deal without selling this one.
Negotiation context
- It's been on market 80 days — a 6% lower offer ($202k) is reasonable based on typical stale-listing flexibility.
Risks & watch-outs
- Climate carrying-cost: extreme-heat days projected 7→19/yr by 2055 (HVAC capex compounding) — expect insurance premiums to compound above CPI over the hold.
Questions for the listing agent
- What do current leases actually rent for vs. the listed asking? Can we see a recent rent roll and the last 12 months of T-12 income?
- It's been on market 80 days. Have you received any prior offers? Is the seller open to a 39% concession, seller financing, or rate buy-down credit?
- Why hasn't it sold? Are there any deal-killer items the seller is aware of (foundation, flood, title, zoning, code violations)?
- Is there a deadline driving the sale (1031 exchange, divorce, estate, relocation)? That informs how much negotiation room exists.
- Schools are D-rated, which usually means shorter tenancies and higher turnover. Who's the typical renter profile here, and what's been the actual vacancy rate?
- The area grade is low — what's the realistic commute time and amenity access for the typical tenant pool here? Any planned neighborhood developments (good or bad) we should know about?
- What's the average days-on-market for RENTAL listings here right now (not sales)? A rising rental-DOM trend means longer vacancies and softer asking-rent achievability than the comps imply.
- What's the recent tenant-quality profile in this submarket — average credit score on applications, eviction rate, late-payment / NSF rate, and stable-employment percentage? A property-management company in the area should have these aggregated.
- How much new for-sale + rental construction is in the pipeline within 1–3 miles? Heavy new supply typically softens prices + rents 12–24 months out; constrained supply supports both.
Investment metrics
- 1% rule
- 0.61% ✗
- Cap rate
- 4.73%
- Cash-on-cash
- -5.59%
- DSCR
- 0.75
- GRM
- 13.7
CMA / ARV
- ARV (on-the-fly)
- $299,592
- Comps found
- 1
Show comp detail 1 sale within ~0.75 mi
| Address | Dist | Beds/Ba | Sqft | Sold | Price | $/sf | Match |
|---|---|---|---|---|---|---|---|
| 1037 Frans Rd | 0.07mi | 4/3.0 | 2,052 (0%) | 14mo | $299,900 | $146 | 81 |
Match score weights: distance 35% · size 25% · config 20% · recency 20%. Top-matched comps best support the ARV.
Projected returns pro-forma
10.0% appreciation · 3.0% rent growth · sell at horizon
- IRR
- 20.3%
- Equity multiple
- 2.65×
- Total profit
- $99,143
- Equity at exit
- $193,689
- IRR
- 18.5%
- Equity multiple
- 6.08×
- Total profit
- $305,836
- Equity at exit
- $417,698
Cash invested: $60,200 (down + closing). Projections, not guarantees.
Landlord ↔ Tenant lean methodology
- Overall (STATE)
- 85 Strongly Landlord-Friendly
- State North Carolina
- 85 Strongly Landlord-Friendly · R+3
- County
- — inherits STATE
- City
- — inherits STATE
ZIP-level market 27053
- Home prices YoY
- 9.6%
- Active inventory
- 34
- Price-to-rent
- 13.7×
Monthly cashflow live
- Estimated rent
- $1,307 medium interval (Pro) →
- Mortgage (P&I)
- −$1,127
- Tax from tax record
- −$96 /mo · $1,153/yr
- Insurance
- −$90
- HOA
- −$0
- Vacancy / Maint / Mgmt
- −$274
- Net cashflow
- $-281
Break-even live
UW: 25.0% down · 7.5% · 30yr · 1.5% tax · 5.0% vac · 8.0% maint · 8.0% mgmt
Financing live
Cash to close
- Down payment
- $53,750
- Closing costs
- $6,450
- Reserves months
- —
- Total cash needed
- —
Loan-product check · same deal, 3 products live
Conventional
25% down · 7.5% · 30yr
- Down + closing
- —
- Monthly P&I
- —
- Monthly cashflow
- —
- DSCR
- —
- Eligible?
- —
Personal DTI + credit; lowest rate.
DSCR
20% down · 8.5% · 30yr
- Down + closing
- —
- Monthly P&I
- —
- Monthly cashflow
- —
- DSCR
- —
- Eligible?
- —
No personal income docs; deal must DSCR.
Hard money
10% down · 12.0% · 12mo
- Down + closing
- —
- Monthly P&I
- —
- Monthly cashflow
- —
- DSCR
- —
- Eligible?
- —
Short-term bridge; refi at stabilization.
Listing history 16 events
-
2026-06-19days on market $215,000 Active 80 DOM
-
2026-06-18days on market $215,000 Active 79 DOM
-
2026-06-17days on market $215,000 Active 78 DOM
-
2026-06-16days on market $215,000 Active 77 DOM
-
2026-06-15days on market $215,000 Active 76 DOM
-
2026-06-14days on market $215,000 Active 74 DOM
-
2026-06-12days on market $215,000 Active 73 DOM
-
2026-06-09days on market $215,000 Active 70 DOM
-
2026-06-08days on market $215,000 Active 69 DOM
-
2026-06-07days on market $215,000 Active 68 DOM
-
2026-06-05days on market $215,000 Active 65 DOM
-
2026-06-02days on market $215,000 Active 63 DOM
-
2026-06-01pricedays on market $215,000 Active 62 DOM
-
2026-05-31days on market $230,000 Active 61 DOM
-
2026-05-30days on market $230,000 Active 60 DOM
-
2026-03-31$230,000 Active
ⓘ Source: listings_history table (triggers on properties + properties_extension) + one-shot
backfill from property_details.listing_events for pre-trigger history.
Tax reassessment forecast NC · Resets to sale price
- Current annual tax
- $1,153 · $96/mo
- Projected year-2 tax
- $1,763 · $147/mo
- Expected delta
- +$610/yr (+$51/mo · 53.0%)
ⓘ Screening estimate from a state-policy table — verify with the county assessor before closing.
Climate risk First Street
- Flood 1/10 Low FEMA zone X (unshaded) · 0% chance over 30 yrs
- Wildfire 4/10 Moderate
- Heat 5/10 Major 7 d/yr ≥101°F today · 19 d/yr by 30 yrs out
- Wind 2/10 Low 3% chance of damaging wind over 30 yrs
- Air quality 1/10 Low 0 unhealthy d/yr today · 0 by 30 yrs out
Nearby sold comps map
Loading sold comps map…
Walkable amenities ~0.75 mi
Loading nearby amenities…
Taxation est. · year 1
- Rental income
- $15,685
- − Mortgage interest
- −$12,043
- − Property taxes
- −$1,153
- − Insurance
- −$1,075
- − Repairs & maintenance
- −$1,255
- − Management
- −$1,255
- − Depreciation
- −$6,255
- Taxable loss
- −$7,350
- Est. tax savings @ 24.0%
- +$1,764
- After-tax cash flow
- $-1,602/yr
For passive investors: Depreciation is non-cash, so a rental often shows a tax loss while cash-flowing — sheltering income. Rental losses are passive: they offset passive income freely, and up to $25,000/yr can offset ordinary (W-2) income if you actively participate and your MAGI is under $100k (phasing out to $0 by $150k); unused losses carry forward. On sale, claimed depreciation is recaptured at up to 25%, and gains may owe capital-gains tax (a 1031 exchange can defer both). Figures are a year-1 estimate at your 24.0% rate — not tax advice; consult a CPA.
Schools (NCES district)
- District
- Stokes County Schools
- NCES district ID
- 3704380
- Math proficiency
- 48% ▲ 5.00%
- Reading proficiency
- 46% ▲ 1.00%
- Median HH income
- $42,284
- Composite
- 39.58/100
- National rank
- #3928
- State rank
- #78 of 178 in NC
Livability — Pilot Mountain
- Score
- 65/100
- State rank
- #309
- US rank
- #12831
Category grades
Schools grade is shown separately in the Schools card above.
Census & demographics
- Population (ZIP)
- 3,187
Population outlook (Stokes County) Hauer SSP2
- Today (2025)
- 44,106 people
- By 2030
- 42,264 · -4.2%
- By 2040
- 37,833 · -14.2%
- By 2050
- 32,818 · -25.6%
- By 2075
- 23,281 · -47.2%
- By 2100
- 15,676 · -64.5%
Race, ethnicity, and origin ACS 2023
- Neighborhood character
- Predominantly White (96%)
- Race & ethnicity
- White 96% Black 3% Two or more races 1%
- Common ancestry
- Serbian 3% Slovak 2% Romanian 1%
- Foreign-born
- 0%
Political lean MEDSL · Stokes
- 2024 margin
- Solid R (+59.6) · D 19.8% · R 79.4%
- 2008→2024 swing
- -24.6pp toward R · 2008: -35.0pp · 2024: -59.6pp
- All cycles
- 2024: R+59.6 2020: R+57.8 2016: R+55.6 2012: R+42.9 2008: R+35.0
Not yet ingested
- Civics
- —
Market trends
- HPI YoY
- ▲ 25.60%
- Current HPI
- 292.0449
- Rent YoY
- —
- Metro
- —
- State GDP YoY
- ▲ 3.28%
- F500 in state
- 26
Industry mix (Fortune 500 HQ in NC)
| Industry | F500 HQs | Revenue |
|---|---|---|
| Financial Services | 2 | $213B |
|
||
| Retail | 2 | $95B |
|
||
| Industrial Conglomerate | 1 | $38B |
|
||
| Metals / Steel | 1 | $35B |
|
||
| Utilities | 1 | $30B |
|
||
| Industrial Machinery | 1 | $19B |
|
||
Price history
1 event — show timeline
- 2026-03-31 Listed $230,000 Triad MLS
Property tax history
+4.8%/yrLatest (2025): $1,153 · +24.9% YoY. Source: county tax records.
Cash-flow waterfall
monthlySold comps — $/sqft
last 12 mo · ≤1 miLoading sold comps…