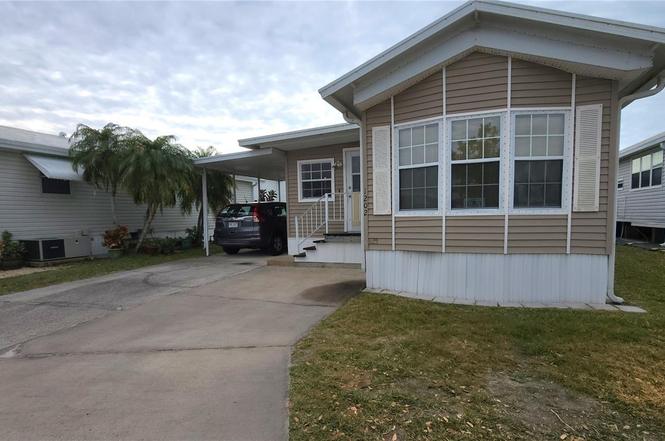
3333 26th Ave E #1202 · Bradenton, FL
Flood risk 9/10 · Severe
- FEMA flood zone
- AE
- Chance of flooding over 30 yrs
- 0.99%
- Est. flood insurance / yr
- $1,737 – $8,500
Fire risk 2/10 · Minimal
- Est. fire insurance / yr
- $947 – $1,759
Heat risk 10/10 · Severe
- Hot days now (above 107°F)
- 7 days/yr
- Hot days in 30 yrs
- 27 days/yr
Wind risk 10/10 · Severe
- Chance of severe wind over 30 yrs
- 99.0%
Air-quality risk 3/10 · Minor
- Unhealthy air days now
- 3 days/yr
- Unhealthy air days in 30 yrs
- 3 days/yr
Risk factors via First Street. Map © Google.
Why this score? — see what drove the B- grade
The composite is a weighted blend of 9 inputs, each scored 0–100. Each bar is that input's sub-score; the figure is the points it added to the 100-point composite (weight × sub-score).
- Cash flow +30.0/30.0
- 1% rule +10.0/10.0
- DSCR +10.0/10.0
- ARV discount +7.5/15.0
- Schools +4.4/10.0
- Livability +4.0/5.0
- Condition / age +2.5/5.0
- Rent growth +1.1/5.0
- Appreciation +0.0/10.0
$90,000
🖨 Deal sheet (PDF) 📄 Offer letter ✓ Due diligence
Listing remarks
OFFERS WELCOME AS SELLER NEEDS IT SOLD! TWO BEDROOM, 1 1/2 BATHROOM MOBILE HOME IN ACTIVE 55+ COMMUNITY. This 800 Square ft. , furnished home is just waiting for you to make it your own. A/C replaced in 2022, Single Carport, Metal Roofover. Spacious living and dining rooms. Second bedroom has an en suite half bath. The laundry room is large enough for extra guest sleeping options. SUGAR CREEK COUNTRY CLUB CO-OP HAS LOW HOA FEES of just $600 quarterly which includes water, trash, sewer, basic cable, internet, and grass mowing. There are two swimming pools, heated spa, clubhouse, tennis, pickleball, shuffleboard, a fitness room, and workshop. There is an active social calendar with fun activi
Key facts
- Laundry room
- Single carport
- A/c replaced
Tags
Property features AI
Finance
- Other: Furnished; Association recreation owned; deed restrictions; buyer approval required
- Financial info: Lease/restrictions apply
- HOA & community: Has HOA (monthly fee applies); Association requires approval; Monthly HOA approximately $200 (quarterly fee shown as $600); Association amenities include pool, heated in-ground spa, tennis courts, shuffleboard, clubhouse, fitness center, recreation facilities, storage, laundry, gated access, community mailbox, street lights; maintenance and utilities such as pool, trash, sewer, water, grounds maintenance, cable and internet included in fees; Senior community; No pets allowed
Exterior
- Parking: Covered parking; Off-street parking; 1-car carport
- Security: Gated community
- Utilities: Public water; Public sewer; Underground utilities; Cable connected; High-speed internet available; Electricity connected; Phone available; Water connected; Sewer connected
- Home design: Manufactured home (double wide); One level; North-facing
- Construction: Frame construction; Metal roof; Roof over; Crawlspace with pillar/post/pier foundation; Built as Chariot Sun Classic model
- Exterior features: Rain gutters; Level, paved and private lot; Private maintained road
Interior
- Kitchen: Range; Range hood; Microwave; Refrigerator
- Bedrooms: 2 bedrooms
- Flooring: Carpet; Linoleum
- Bathrooms: 1 full bath; 1 half bath
- Heating & cooling: Central heating; Central air
- Interior features: Ceiling fans; Split bedroom floor plan; Thermostat; Blinds
- Laundry & utility: Laundry room; Washer; Dryer; Electric water heater
Neighborhood map
What this means for you Summary
Snapshot
- This is a 2-bed/1.0-bath manufactured listed at $90k.
Deal economics
- At list price, monthly cash flow is $-60 ($-721/yr) — negative.
- To cash-flow at today's rent, offer at most $79k (11.8% below list).
- Meets the 1% rule at list price ($1k rent vs $90k).
- Recommended offer: $79k (12.0% below list) — sets the bar for market timing.
- Cap rate 11.2% vs local median 3.6% in Bradenton — top-decile yield for the area; either an underpriced asset or a hidden risk that comps aren't pricing in. Stress-test before assuming the spread holds.
Location & tenants
- Location reads 81/100 on livability (#101 in FL, #1,528 nationally) — a professional / high-income tenant draw. Strengths: commute A+, cost of living A+, housing A+; Watch: employment D+, crime D, amenities F.
- Manatee (suburban): math 54% / reading 50% proficiency, ranked #26 of 73 in FL (top 36%) — acceptable for families but not a draw, mixed tenant base, ~2y average lease.
- Zoned schools: William H. Bashaw Elementary (math 51% / reading 44%, grade D, #1,182 of 2,144 statewide, top 55%, 684 students, 69% FRL); Braden River Middle School (math 54% / reading 47%, grade C, #246 of 571 statewide, top 44%, 810 students, 58% FRL); Braden River High School (math 44% / reading 52%, grade D, #201 of 667 statewide, top 30%, 1,774 students, 45% FRL).
- Market conditions: Rents falling (-5.4%/yr); 351 active listings in the ZIP; 7,472 units permitted in Manatee County in 2024 (1,782 in 5+ unit buildings).
Forward outlook
- Local home prices are declining (-3.0%/yr); year-one equity from $622 of loan paydown is wiped out by about $3k of value loss. Plan a longer hold.
- Manatee County population projected at +43% by 2050 — long-run rental-demand tailwind backs the buy-and-hold thesis.
Negotiation context
- It's been on market 130 days — a 12% lower offer ($79k) is reasonable based on typical stale-listing flexibility.
- Current owner paid $13k; list at $90k implies a 598% gain — meaningful room to come down on a strong offer.
Risks & watch-outs
- Watch-outs: flood insurance adds $427/mo.
- Climate carrying-cost: in FEMA flood zone AE (mandatory federal flood insurance); severe wind risk, 99% chance of damaging wind over 30y; extreme-heat days projected 7→27/yr by 2055 (HVAC capex compounding) — expect insurance premiums to compound above CPI over the hold.
Questions for the listing agent
- What do current leases actually rent for vs. the listed asking? Can we see a recent rent roll and the last 12 months of T-12 income?
- It's been on market 130 days. Have you received any prior offers? Is the seller open to a 12% concession, seller financing, or rate buy-down credit?
- What's the actual annual flood-insurance premium (NFIP or private), and is the property in a SFHA with mandatory coverage?
- What does the HOA fee cover, when was the last increase, and are there any pending special assessments or reserve-fund shortfalls?
- Why hasn't it sold? Are there any deal-killer items the seller is aware of (foundation, flood, title, zoning, code violations)?
- Is there a deadline driving the sale (1031 exchange, divorce, estate, relocation)? That informs how much negotiation room exists.
- Crime grade is D in this area — have there been break-ins, vandalism, or insurance claims at this property in the last 3 years? What carrier currently insures it and at what premium?
- What's the average days-on-market for RENTAL listings here right now (not sales)? A rising rental-DOM trend means longer vacancies and softer asking-rent achievability than the comps imply.
- What's the recent tenant-quality profile in this submarket — average credit score on applications, eviction rate, late-payment / NSF rate, and stable-employment percentage? A property-management company in the area should have these aggregated.
- How much new for-sale + rental construction is in the pipeline within 1–3 miles? Heavy new supply typically softens prices + rents 12–24 months out; constrained supply supports both.
Investment metrics
- 1% rule
- 1.65% ✓
- Cap rate
- 11.18%
- Cash-on-cash
- 17.45%
- DSCR
- 1.78
- GRM
- 5.1
CMA / ARV
- ARV (on-the-fly)
- $48,000
- Comps found
- 2
Show comp detail 2 sales within ~0.75 mi
| Address | Dist | Beds/Ba | Sqft | Sold | Price | $/sf | Match |
|---|---|---|---|---|---|---|---|
| 3333 26th Ave E #1025 | 0.19mi | 1/1.0 (-1) | 501 (+4%) | 12mo | $50,000 | $100 | 69 |
| 3300 26th Ave E #171 | 0.22mi | 1/1.0 (-1) | 420 (-12%) | 3mo | $29,900 | $71 | 62 |
Match score weights: distance 35% · size 25% · config 20% · recency 20%. Top-matched comps best support the ARV.
Projected returns pro-forma
-3.0% appreciation · 0.0% rent growth · sell at horizon
- IRR
- -27.9%
- Equity multiple
- 0.11×
- Total profit
- $-22,360
- Equity at exit
- $13,419
- IRR
- -76.4%
- Equity multiple
- -0.57×
- Total profit
- $-39,580
- Equity at exit
- $7,782
Cash invested: $25,200 (down + closing). Projections, not guarantees.
Landlord ↔ Tenant lean methodology
- Overall (STATE)
- 87 Strongly Landlord-Friendly
- State Florida
- 87 Strongly Landlord-Friendly · R+3
- County
- — inherits STATE
- City
- — inherits STATE
ZIP-level market 34208
- Rents YoY
- -5.4%
- Active inventory
- 351
- Price-to-rent
- 5.1×
Monthly cashflow live
- Estimated rent
- $1,483 medium interval (Pro) →
- Mortgage (P&I)
- −$472
- Tax from tax record
- −$96 /mo · $1,146/yr
- Insurance
- −$38
- Flood insurance flood zone
- −$427 /mo · $5,118/yr
- HOA
- −$200
- Vacancy / Maint / Mgmt
- −$311
- Net cashflow
- $-60
Break-even live
Sensitivity live
| Price | -10% $-9 | -5% $-35 | +0% $-60 | +5% $-86 | +10% $-111 |
|---|---|---|---|---|---|
| Rent | -10% $-177 | -5% $-119 | +0% $-60 | +5% $-2 | +10% $57 |
| Rate | -1.0pp $-15 | -0.5pp $-37 | base $-60 | +0.5pp $-83 | +1.0pp $-107 |
UW: 25.0% down · 7.5% · 30yr · 1.5% tax · 5.0% vac · 8.0% maint · 8.0% mgmt
Financing live
Cash to close
- Down payment
- $22,500
- Closing costs
- $2,700
- Reserves months
- —
- Total cash needed
- —
Loan-product check · same deal, 3 products live
Conventional
25% down · 7.5% · 30yr
- Down + closing
- —
- Monthly P&I
- —
- Monthly cashflow
- —
- DSCR
- —
- Eligible?
- —
Personal DTI + credit; lowest rate.
DSCR
20% down · 8.5% · 30yr
- Down + closing
- —
- Monthly P&I
- —
- Monthly cashflow
- —
- DSCR
- —
- Eligible?
- —
No personal income docs; deal must DSCR.
Hard money
10% down · 12.0% · 12mo
- Down + closing
- —
- Monthly P&I
- —
- Monthly cashflow
- —
- DSCR
- —
- Eligible?
- —
Short-term bridge; refi at stabilization.
HOA detail
- Monthly dues
- $200 · $2,400/yr
- Likely covers
- watersewertrashinternetcablepool
Listing history 18 events
-
2026-06-22days on market $90,000 Active 130 DOM
-
2026-06-18days on market $90,000 Active 127 DOM
-
2026-06-17days on market $90,000 Active 126 DOM
-
2026-06-16days on market $90,000 Active 125 DOM
-
2026-06-15days on market $90,000 Active 124 DOM
-
2026-06-13days on market $90,000 Active 122 DOM
-
2026-06-13days on market $90,000 Active 121 DOM
-
2026-06-10days on market $90,000 Active 119 DOM
-
2026-06-09days on market $90,000 Active 118 DOM
-
2026-06-08days on market $90,000 Active 117 DOM
-
2026-06-08days on market $90,000 Active 116 DOM
-
2026-06-03days on market $90,000 Active 112 DOM
-
2026-06-02days on market $90,000 Active 111 DOM
-
2026-06-01days on market $90,000 Active 110 DOM
-
2026-05-31days on market $90,000 Active 109 DOM
-
2026-03-17price $90,000
-
2026-02-11$119,000 Active
-
1988-07-06soldstatus $12,900
ⓘ Source: listings_history table (triggers on properties + properties_extension) + one-shot
backfill from property_details.listing_events for pre-trigger history.
Tax reassessment forecast FL · Resets to sale price
- Current annual tax
- $1,146 · $96/mo
- Projected year-2 tax
- $1,146 · $96/mo
- Expected delta
- $0/yr ($0/mo · 0.0%)
ⓘ Screening estimate from a state-policy table — verify with the county assessor before closing.
Climate risk First Street
- Flood 9/10 Extreme FEMA zone AE · 99% chance over 30 yrs
- Wildfire 2/10 Low
- Heat 10/10 Extreme 7 d/yr ≥107°F today · 27 d/yr by 30 yrs out
- Wind 10/10 Extreme 99% chance of damaging wind over 30 yrs
- Air quality 3/10 Moderate 3 unhealthy d/yr today · 3 by 30 yrs out
Nearby sold comps map
Loading sold comps map…
Walkable amenities ~0.75 mi
Loading nearby amenities…
Taxation est. · year 1
- Rental income
- $17,794
- − Mortgage interest
- −$5,041
- − Property taxes
- −$1,146
- − Insurance
- −$5,568
- − Repairs & maintenance
- −$1,424
- − Management
- −$1,424
- − HOA
- −$2,400
- − Depreciation
- −$2,618
- Taxable loss
- −$1,827
- Est. tax savings @ 24.0%
- +$439
- After-tax cash flow
- $-283/yr
For passive investors: Depreciation is non-cash, so a rental often shows a tax loss while cash-flowing — sheltering income. Rental losses are passive: they offset passive income freely, and up to $25,000/yr can offset ordinary (W-2) income if you actively participate and your MAGI is under $100k (phasing out to $0 by $150k); unused losses carry forward. On sale, claimed depreciation is recaptured at up to 25%, and gains may owe capital-gains tax (a 1031 exchange can defer both). Figures are a year-1 estimate at your 24.0% rate — not tax advice; consult a CPA.
Schools (NCES district)
- District
- Manatee
- NCES district ID
- 1201230
- Math proficiency
- 54% ▼ -6.00%
- Reading proficiency
- 50% ▼ -2.00%
- Median HH income
- $49,607
- Composite
- 44.43/100
- National rank
- #2806
- State rank
- #26 of 73 in FL
Livability — Bradenton
- Score
- 81/100
- State rank
- #101
- US rank
- #1528
Category grades
Schools grade is shown separately in the Schools card above.
Census & demographics
- County
- Manatee County · 416,364 people
- City population
- 227,091
- Metro
- North Port-Sarasota-Bradenton, FL
- Population (ZIP)
- 44,004
- Household income
- $60,504
- Rent vs Own
- Severe rent burden
- 1777.0
Population outlook (Manatee County) Hauer SSP2
- Today (2025)
- 447,342 people
- By 2030
- 488,911 · +9.3%
- By 2040
- 567,934 · +27.0%
- By 2050
- 637,995 · +42.6%
- By 2075
- 781,970 · +74.8%
- By 2100
- 848,272 · +89.6%
Race, ethnicity, and origin ACS 2023
- Neighborhood character
- Diverse neighborhood (Simpson 0.67)
- Race & ethnicity
- White 43% Hispanic / Latino 33% Black 18% Two or more races 16% Asian 2%
- Hispanic origin (detail)
- Mexican 18% Puerto Rican 3% Cuban 2% Dominican 2%
- Common ancestry
- Hispanic 2% Iranian 2% Lithuanian 1%
- Foreign-born
- 20% · Canada, Jamaica, China
- Languages at home
- 67% English-only · Spanish 27% French/Haitian/Cajun 3% Other Indo-European 1%
Political lean MEDSL · Manatee
- 2024 margin
- Strong R (+23.5) · D 37.9% · R 61.4%
- 2008→2024 swing
- -16.5pp toward R · 2008: -7.0pp · 2024: -23.5pp
- All cycles
- 2024: R+23.5 2020: R+16.1 2016: R+17.1 2012: R+12.5 2008: R+7.0
Not yet ingested
- Civics
- —
Market trends
- HPI YoY
- ▼ -353.49%
- Current HPI
- 287.0443
- Rent YoY
- ▼ -5.44%
- Metro
- North Port-Sarasota-Bradenton, FL
- State GDP YoY
- ▲ 3.28%
- F500 in state
- 36
Industry mix (Fortune 500 HQ in FL)
| Industry | F500 HQs | Revenue |
|---|---|---|
| Industrial Technology | 2 | $29B |
|
||
| Insurance | 2 | $17B |
|
||
| Retail | 1 | $60B |
|
||
| Technology Distribution | 1 | $58B |
|
||
| Homebuilding | 1 | $35B |
|
||
| Technology Manufacturing | 1 | $35B |
|
||
Price history
+597.7% since first listed3 events — show timeline
- 2026-03-17 Price Changed $90,000 Stellar MLS as Distributed by MLS Grid
- 2026-02-11 Listed $119,000 Stellar MLS as Distributed by MLS Grid
- 1988-07-06 Sold (Public Records) $12,900 Public Records
Property tax history
+2.6%/yrLatest (2025): $1,146 · -0.0% YoY. Source: county tax records.
Cash-flow waterfall
monthlySold comps — $/sqft
last 12 mo · ≤1 miLoading sold comps…