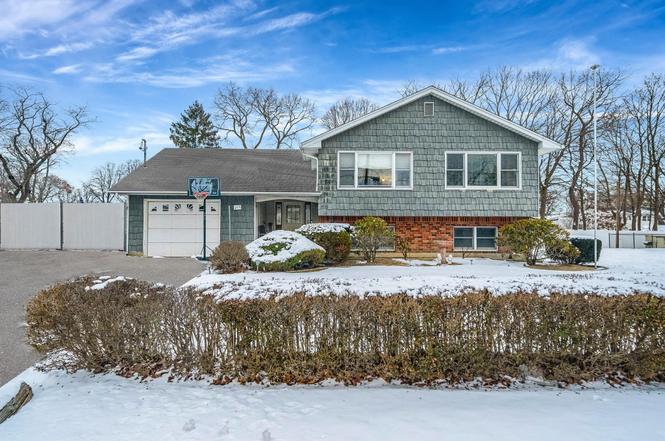
215 Eastwood Ave · Deer Park, NY
Flood risk 1/10 · Minimal
- FEMA flood zone
- X (unshaded)
- Chance of flooding over 30 yrs
- 0.0%
- Est. flood insurance / yr
- $473 – $860
Fire risk 2/10 · Minimal
- Est. fire insurance / yr
- $691 – $1,283
Heat risk 5/10 · Moderate
- Hot days now (above 94°F)
- 7 days/yr
- Hot days in 30 yrs
- 16 days/yr
Wind risk 6/10 · Moderate
- Chance of severe wind over 30 yrs
- 65.0%
Air-quality risk 4/10 · Minor
- Unhealthy air days now
- 4 days/yr
- Unhealthy air days in 30 yrs
- 6 days/yr
Risk factors via First Street. Map © Google.
Why this score? — see what drove the D+ grade
The composite is a weighted blend of 9 inputs, each scored 0–100. Each bar is that input's sub-score; the figure is the points it added to the 100-point composite (weight × sub-score).
- ARV discount +15.0/15.0
- Cash flow +13.0/30.0
- Schools +5.5/10.0
- DSCR +3.9/10.0
- Livability +3.8/5.0
- 1% rule +3.7/10.0
- Rent growth +2.5/5.0
- Condition / age +2.2/5.0
- Appreciation +0.0/10.0
$674,999
🖨 Deal sheet (PDF) 📄 Offer letter ✓ Due diligence
Listing remarks
This lovely 3 bed, 2.5 bath Hi-Ranch located in the Deer Park School District offers spacious and comfortable living. The inviting entrance way leads to a home featuring hardwood floors throughout. The roomy formal living room is filled with natural light, and the family room provides a cozy space to relax. A formal dining room is conveniently located off the eat-in kitchen. Plenty of extra space for family, or possible rental potential with proper permits. Estate Sale being Sold As Is Subject to Court Approval.
Key facts
- 8,400 sq ft lot
- Garage
- Built 1981
Neighborhood map
What this means for you Summary
Snapshot
- This is a 3-bed/2.5-bath single-family listed at $675k. Condition is rated fair.
Deal economics
- At list price, monthly cash flow is $-42 ($-506/yr) — negative.
- To cash-flow at today's rent, offer at most $669k (0.9% below list).
- To meet the 1% rule (rent ≥ 1% of price), the offer needs to be $585k (13.3% below list).
- Recommended offer: $585k (13.3% below list) — sets the bar for 1% rule.
- Cap rate 6.2% vs local median 3.0% in Deer Park — top-decile yield for the area; either an underpriced asset or a hidden risk that comps aren't pricing in. Stress-test before assuming the spread holds.
Location & tenants
- Location reads 76/100 on livability (#216 in NY, #3,358 nationally) — a middle-class / working-renter tenant base. Strengths: employment A+, housing A+, health & safety A+; Watch: amenities D, commute F, cost of living F.
- Deer Park Union Free School District (suburban): math 63% / reading 60% proficiency, ranked #181 of 590 in NY (top 31%) — acceptable for families but not a draw, mixed tenant base, ~2y average lease.
- Zoned schools: John F Kennedy Intermediate School (math 64% / reading 61%, grade B, #671 of 2,108 statewide, top 32%, 830 students, 44% FRL); Robert Frost Middle School (math 30% / reading 60%, grade D, #342 of 729 statewide, top 48%, 903 students, 49% FRL); Deer Park High School (math 95% / reading 57%, grade A-, #616 of 1,100 statewide, top 57%, 1,314 students, 45% FRL) — zoned schools average 46% FRL vs 28% district-wide (17 pts higher); higher-poverty schools than district average — tighter screening recommended.
- Market conditions: 118 active listings in the ZIP; 3 comparable units currently listed for rent nearby; rentals lingering (median 46d on market — plan ~5-8 weeks vacancy on turnover, expect pricing pressure); 67% of comp listings sitting > 30 days — soft ceiling on asking rent; 1,366 units permitted in Suffolk County in 2024 (216 in 5+ unit buildings).
Forward outlook
- Local home prices are declining (-3.0%/yr); year-one equity from $5k of loan paydown is wiped out by about $20k of value loss. Plan a longer hold.
- Suffolk County population projected to shrink 5% by 2050 — rents likely to lag national; underwrite the cash flow, not the appreciation.
Negotiation context
- It's been on market 44 days — a 3% lower offer ($655k) is reasonable based on typical stale-listing flexibility.
- 2 sale attempts with the ask held roughly flat each time — persistent listings suggest the price (not the market) is what's stuck; bring a comps-based counter.
Risks & watch-outs
- Climate carrying-cost: major wind risk, 65% chance of damaging wind over 30y; extreme-heat days projected 7→16/yr by 2055 (HVAC capex compounding) — expect insurance premiums to compound above CPI over the hold.
Questions for the listing agent
- What do current leases actually rent for vs. the listed asking? Can we see a recent rent roll and the last 12 months of T-12 income?
- It's been on market 44 days. Have you received any prior offers? Is the seller open to a 13% concession, seller financing, or rate buy-down credit?
- Have any recent inspections been done? Can we get a copy of the seller's disclosures and any deferred-maintenance estimates?
- Is there a deadline driving the sale (1031 exchange, divorce, estate, relocation)? That informs how much negotiation room exists.
- Schools are A-rated — typically a magnet for longer-tenancy family renters. What's the average tenant stay here, and is there a school-zone premium baked into asking?
- The area grade is low — what's the realistic commute time and amenity access for the typical tenant pool here? Any planned neighborhood developments (good or bad) we should know about?
- What's the average days-on-market for RENTAL listings here right now (not sales)? A rising rental-DOM trend means longer vacancies and softer asking-rent achievability than the comps imply.
- What's the recent tenant-quality profile in this submarket — average credit score on applications, eviction rate, late-payment / NSF rate, and stable-employment percentage? A property-management company in the area should have these aggregated.
- How much new for-sale + rental construction is in the pipeline within 1–3 miles? Heavy new supply typically softens prices + rents 12–24 months out; constrained supply supports both.
Investment metrics
- 1% rule
- 0.87% ✗
- Cap rate
- 6.22%
- Cash-on-cash
- -0.27%
- DSCR
- 0.99
- GRM
- 9.6
CMA / ARV
- ARV (on-the-fly)
- $955,996
- Comps found
- 8
Show comp detail 8 sales within ~0.75 mi
| Address | Dist | Beds/Ba | Sqft | Sold | Price | $/sf | Match |
|---|---|---|---|---|---|---|---|
| 11 Cayuga Ave | 0.43mi | 4/3.0 (+1) | 2,379 (-1%) | 6mo | $760,000 | $319 | 66 |
| 299 Marlin St | 0.46mi | 4/2.5 (+1) | 2,400 (-0%) | 12mo | $999,999 | $417 | 63 |
| 149 Osceola Ave | 0.40mi | 4/2.5 (+1) | 2,184 (-9%) | 7mo | $742,500 | $340 | 56 |
| 331 Gillette St | 0.61mi | 4/2.0 (+1) | 2,300 (-4%) | 3mo | $915,000 | $398 | 55 |
| 293 Marlin St | 0.54mi | 4/2.5 (+1) | 2,624 (+9%) | 3mo | $1,094,000 | $417 | 51 |
| 4 Susan Ct | 0.39mi | 4/2.5 (+1) | 2,045 (-15%) | 9mo | $729,000 | $356 | 44 |
| 66 Claremont St | 0.70mi | 4/2.0 (+1) | 2,153 (-10%) | 15mo | $750,000 | $348 | 30 |
| 33 April Ave | 0.66mi | 4/2.5 (+1) | 2,106 (-12%) | 23mo | $840,000 | $399 | 25 |
Match score weights: distance 35% · size 25% · config 20% · recency 20%. Top-matched comps best support the ARV.
Projected returns pro-forma
-3.0% appreciation · 3.0% rent growth · sell at horizon
- IRR
- -16.7%
- Equity multiple
- 0.41×
- Total profit
- $-111,974
- Equity at exit
- $100,645
- IRR
- -8.5%
- Equity multiple
- 0.47×
- Total profit
- $-100,601
- Equity at exit
- $58,362
Cash invested: $189,000 (down + closing). Projections, not guarantees.
Landlord ↔ Tenant lean methodology
- Overall (STATE)
- 15 Strongly Tenant-Friendly
- State New York
- 15 Strongly Tenant-Friendly · D+10
- County
- — inherits STATE
- City
- — inherits STATE
ZIP-level market 11729
- Active inventory
- 118
- Price-to-rent
- 9.6×
Monthly cashflow live
- Estimated rent
- $5,851 medium interval (Pro) →
- Mortgage (P&I)
- −$3,540
- Tax est. 1.5%
- −$844 /mo · $10,125/yr
- Insurance
- −$281
- HOA
- −$0
- Vacancy / Maint / Mgmt
- −$1,229
- Net cashflow
- $-42
Break-even live
Sensitivity live
| Price | -10% $424 | -5% $191 | +0% $-42 | +5% $-275 | +10% $-509 |
|---|---|---|---|---|---|
| Rent | -10% $-504 | -5% $-273 | +0% $-42 | +5% $189 | +10% $420 |
| Rate | -1.0pp $298 | -0.5pp $130 | base $-42 | +0.5pp $-217 | +1.0pp $-395 |
UW: 25.0% down · 7.5% · 30yr · 1.5% tax · 5.0% vac · 8.0% maint · 8.0% mgmt
Financing live
Cash to close
- Down payment
- $168,750
- Closing costs
- $20,250
- Reserves months
- —
- Total cash needed
- —
Loan-product check · same deal, 3 products live
Conventional
25% down · 7.5% · 30yr
- Down + closing
- —
- Monthly P&I
- —
- Monthly cashflow
- —
- DSCR
- —
- Eligible?
- —
Personal DTI + credit; lowest rate.
DSCR
20% down · 8.5% · 30yr
- Down + closing
- —
- Monthly P&I
- —
- Monthly cashflow
- —
- DSCR
- —
- Eligible?
- —
No personal income docs; deal must DSCR.
Hard money
10% down · 12.0% · 12mo
- Down + closing
- —
- Monthly P&I
- —
- Monthly cashflow
- —
- DSCR
- —
- Eligible?
- —
Short-term bridge; refi at stabilization.
Rent comps 3 comps
| Address | Beds | Baths | Sqft | Rent | $/sqft | DOM | Units | Dist |
|---|---|---|---|---|---|---|---|---|
| 290 Eastwood Ave Deer Park, NY | 4.0 | 2.5 | 2400 | $7,000 | $2.92 | 45d | 1 | 0.23mi |
| 601 Old Country Rd Deer Park, NY | 4.0 | 1.0 | 1945 | $4,000 | $2.06 | 17d | 1 | 0.52mi |
| 1806 Deer Park Ave Deer Park, NY | 2.0 | 1.0 | 3066 | $3,000 | $0.98 | 45d | 1 | 1.09mi |
Listing history 4 events
-
2025-04-04status Pending
-
2025-02-23status Active
-
2025-01-30$674,999 Active
-
2025-01-27historical $674,999
ⓘ Source: listings_history table (triggers on properties + properties_extension) + one-shot
backfill from property_details.listing_events for pre-trigger history.
Climate risk First Street
- Flood 1/10 Low FEMA zone X (unshaded) · 0% chance over 30 yrs
- Wildfire 2/10 Low
- Heat 5/10 Major 7 d/yr ≥94°F today · 16 d/yr by 30 yrs out
- Wind 6/10 Major 65% chance of damaging wind over 30 yrs
- Air quality 4/10 Moderate 4 unhealthy d/yr today · 6 by 30 yrs out
Nearby sold comps map
Loading sold comps map…
Walkable amenities ~0.75 mi
Loading nearby amenities…
Taxation est. · year 1
- Rental income
- $70,217
- − Mortgage interest
- −$37,810
- − Property taxes
- −$10,125
- − Insurance
- −$3,375
- − Repairs & maintenance
- −$5,617
- − Management
- −$5,617
- − Depreciation
- −$19,636
- Taxable loss
- −$11,964
- Est. tax savings @ 24.0%
- +$2,871
- After-tax cash flow
- $2,366/yr
For passive investors: Depreciation is non-cash, so a rental often shows a tax loss while cash-flowing — sheltering income. Rental losses are passive: they offset passive income freely, and up to $25,000/yr can offset ordinary (W-2) income if you actively participate and your MAGI is under $100k (phasing out to $0 by $150k); unused losses carry forward. On sale, claimed depreciation is recaptured at up to 25%, and gains may owe capital-gains tax (a 1031 exchange can defer both). Figures are a year-1 estimate at your 24.0% rate — not tax advice; consult a CPA.
Condition & rehab AI · 13 photos
The home requires moderate repairs and maintenance, particularly to the exterior siding and paint. Painting and repainting the exterior and interior will significantly enhance its curb appeal and value.
Repairs flagged
- Moderate Siding — Weathered appearance
- Minor Paint — Faded appearance
Value-add opportunities
- Both Painting and repainting the exterior siding — Enhances curb appeal and value
- Both Painting interior walls and trim — Improves appearance and value
- Both Reorganizing and decluttering the interior — Creates a more inviting and functional space
Renovation cost estimate screening
| Repair item | Severity | Est. cost |
|---|---|---|
| Siding · Weathered appearance | Moderate | $3,000–15,000 |
| Paint · Faded appearance | Minor | $500–3,000 |
| Total estimated repair cost · 2 items | $3,500–18,000 |
Value-add ROI direction
- Both Painting and repainting the exterior siding — Enhances curb appeal and value ↑
- Both Painting interior walls and trim — Improves appearance and value ↑
- Both Reorganizing and decluttering the interior — Creates a more inviting and functional space ↑
ⓘ Cost ranges are severity-bucket heuristics (US national rule-of-thumb). Get contractor quotes + a written scope before underwriting a rehab budget.
Schools (NCES district)
- District
- Deer Park Union Free School District
- NCES district ID
- 3608880
- Math proficiency
- 63% ▼ -3.00%
- Reading proficiency
- 60% ▼ -5.00%
- Median HH income
- $80,561
- Composite
- 55.26/100
- National rank
- #1268
- State rank
- #181 of 590 in NY
Livability — Deer Park
- Score
- 76/100
- State rank
- #216
- US rank
- #3358
Category grades
Schools grade is shown separately in the Schools card above.
Census & demographics
- Census place
- Deer Park, NY
- City population
- 26,647
- Population (ZIP)
- 26,647
Population outlook (Suffolk County) Hauer SSP2
- Today (2025)
- 1,505,262 people
- By 2030
- 1,498,318 · -0.5%
- By 2040
- 1,471,101 · -2.3%
- By 2050
- 1,424,848 · -5.3%
- By 2075
- 1,337,157 · -11.2%
- By 2100
- 1,217,720 · -19.1%
Race, ethnicity, and origin ACS 2023
- Neighborhood character
- Diverse neighborhood (Simpson 0.67)
- Race & ethnicity
- White 51% Hispanic / Latino 23% Two or more races 13% Black 12% Asian 11%
- Hispanic origin (detail)
- Mexican 1% Puerto Rican 7% Dominican 4%
- Common ancestry
- Hispanic 4% Romanian 3% Armenian 1%
- Foreign-born
- 21% · Canada, China, Jamaica
- Languages at home
- 72% English-only · Spanish 13% Other Indo-European 7% Chinese 3%
Political lean MEDSL · Suffolk
- 2024 margin
- Lean R (+10.0) · D 45.0% · R 55.0%
- 2008→2024 swing
- -16.0pp toward R · 2008: 6.0pp · 2024: -10.0pp
- All cycles
- 2024: R+10.0 2020: R+0.0 2016: R+8.2 2012: D+2.9 2008: D+6.0
Not yet ingested
- Civics
- —
Market trends
- HPI YoY
- ▼ -669.80%
- Current HPI
- 285.3175
- Rent YoY
- —
- Metro
- —
- State GDP YoY
- ▲ 2.60%
- F500 in state
- 92
Industry mix (Fortune 500 HQ in NY)
| Industry | F500 HQs | Revenue |
|---|---|---|
| Financial Services | 10 | $950B |
|
||
| Consumer Goods | 9 | $162B |
|
||
| Insurance | 4 | $225B |
|
||
| Telecommunications | 2 | $144B |
|
||
| Pharmaceuticals | 2 | $112B |
|
||
| Media / Entertainment | 2 | $69B |
|
||
Price history
+0.0% since first listed4 events — show timeline
- 2025-04-04 Pending — OneKey® MLS as Distributed by MLS Grid
- 2025-02-23 Relisted — OneKey® MLS as Distributed by MLS Grid
- 2025-01-30 Listed $674,999 OneKey® MLS as Distributed by MLS Grid
- 2025-01-27 Coming Soon $674,999 OneKey® MLS as Distributed by MLS Grid
Cash-flow waterfall
monthlySold comps — $/sqft
last 12 mo · ≤1 miLoading sold comps…