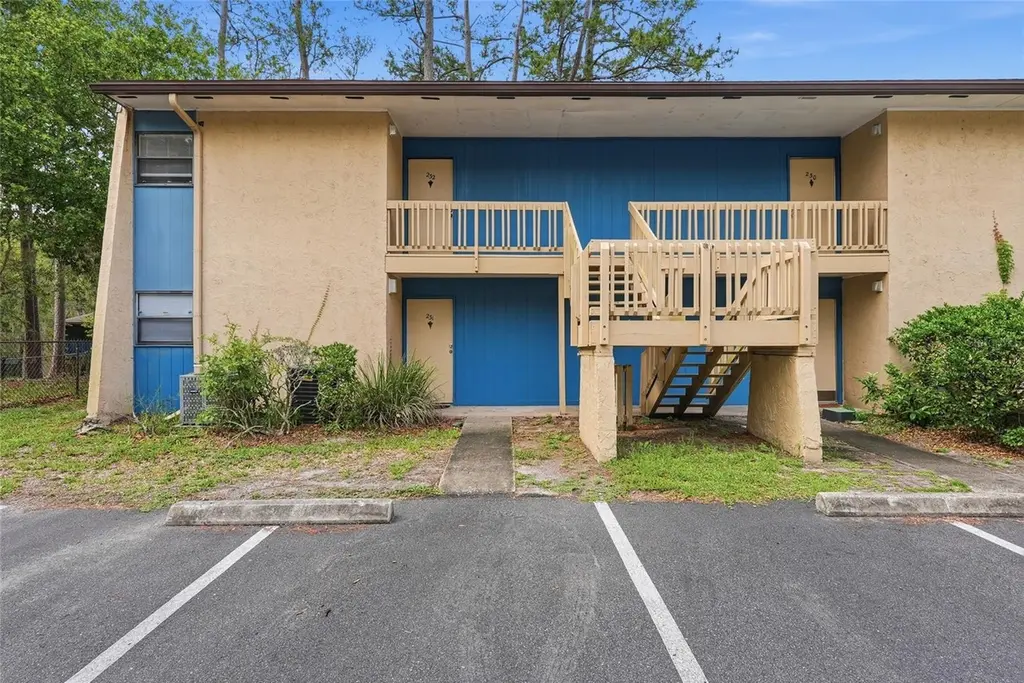
2811 SW Archer Rd Unit Y232 · Gainesville, FL
Flood risk No data
- FEMA flood zone
- —
- Chance of flooding over 30 yrs
- —
- Est. flood insurance / yr
- —
Fire risk No data
- Est. fire insurance / yr
- —
Heat risk No data
- Hot days now (above threshold)
- —
- Hot days in 30 yrs
- —
Wind risk No data
- Chance of severe wind over 30 yrs
- —
Air-quality risk No data
- Unhealthy air days now
- —
- Unhealthy air days in 30 yrs
- —
Risk factors via First Street. Map © Google.
Why this score? — see what drove the B grade
The composite is a weighted blend of 9 inputs, each scored 0–100. Each bar is that input's sub-score; the figure is the points it added to the 100-point composite (weight × sub-score).
- Cash flow +30.0/30.0
- 1% rule +10.0/10.0
- DSCR +10.0/10.0
- ARV discount +7.5/15.0
- Schools +4.3/10.0
- Livability +4.0/5.0
- Rent growth +3.2/5.0
- Condition / age +2.5/5.0
- Appreciation +0.0/10.0
$69,500
🖨 Deal sheet 📄 Offer letter ✓ Due diligence
Listing remarks
Welcome to this beautiful 1-2 bedroom, 1-bathroom 2nd story condo (or a bonus room), located in the sought-after Brandywine Condo community. Featuring vinyl flooring throughout, this home offers both comfort and style. It is neat and tidy and ready for a new owner. Start your day by relaxing on your private porch, enjoying the peaceful sounds of morning birds chirping in the backyard. Conveniently located less than 2 miles from the University of Florida, Shands Hospital, and the Butler Plaza shopping center, this condo offers an unbeatable location for both work and leisure. Brandywine Condo residents enjoy fantastic amenities including a community pool, workout room, sauna, and clubhouse,
Key facts
- Private porch
- Workout room
- Clubhouse
Tags
Property features AI
Finance
- Other: Development: Brandywine
- Financial info: Total annual HOA/association fees: $3,915; Lease restrictions apply
- HOA & community: Monthly HOA fee of $326.25 (includes internet, structure and grounds maintenance, pool, sewer, trash and water); Association approval required; Association: University Managment/ Yatoyia Long; Community clubhouse, fitness center and pool; Community mailbox; Pets allowed with restrictions (cats and dogs OK; breed restrictions)
Exterior
- Utilities: Public water; Public sewer; Electricity connected; Cable available
- Home design: Condominium (residential); One-story; Faces southwest; Unit on 2nd floor (Y-232)
- Construction: Block, frame and wood siding construction; Other roof type; Slab foundation; Built as part of building Y-232
- Exterior features: Balcony; Sliding doors; Paved road access
Interior
- Kitchen: Disposal; Range; Refrigerator
- Bedrooms: 1 bedroom
- Flooring: Tile; Vinyl
- Bathrooms: 1 full bathroom
- Heating & cooling: Electric heating; Central air conditioning
- Interior features: Ceiling fans
- Laundry & utility: Shared laundry in common area
Neighborhood map
What this means for you Summary
Snapshot
- This is a 1-bed/1.0-bath condo listed at $70k.
Deal economics
- At list price, monthly cash flow is $260 ($3k/yr) — positive.
- The deal already cash-flows at list — no discount required.
- Meets the 1% rule at list price ($1k rent vs $70k).
- Recommended offer: $68k (1.5% below list) — sets the bar for market timing.
Location & tenants
- Location reads 81/100 on livability (#97 in FL, #1,480 nationally) — a professional / high-income tenant draw. Strengths: amenities A+, commute A+, cost of living A+; Watch: employment D+, crime F.
- Alachua (urban): math 49% / reading 54% proficiency, ranked #30 of 73 in FL (top 41%) — acceptable for families but not a draw, mixed tenant base, ~2y average lease.
- Market conditions: Rents rising (+2.9%/yr); 594 active listings in the ZIP; 1 comparable units currently listed for rent nearby; 1,774 units permitted in Alachua County in 2024 (984 in 5+ unit buildings).
Forward outlook
- Local home prices are declining (-3.0%/yr); year-one equity from $481 of loan paydown is wiped out by about $2k of value loss. Plan a longer hold.
- Alachua County population projected at +26% by 2050 — long-run rental-demand tailwind backs the buy-and-hold thesis.
- At projected returns (-3.0% appreciation + 2.9% rent growth), your $19k cash investment doubles in ~8 years — after that, you're playing with house money.
Negotiation context
- It's been on market 15 days — a 2% lower offer ($68k) is reasonable based on typical stale-listing flexibility.
Risks & watch-outs
- Watch-outs: HOA is 23% of rent.
Questions for the listing agent
- What does the HOA fee cover, when was the last increase, and are there any pending special assessments or reserve-fund shortfalls?
- Any open or pending special assessments — roof, HVAC, plumbing, elevator, façade? What's the per-unit balance and payoff schedule, and is the seller paying it off at close or rolling it to the buyer?
- Is there a deadline driving the sale (1031 exchange, divorce, estate, relocation)? That informs how much negotiation room exists.
- Schools are B-rated — typically a magnet for longer-tenancy family renters. What's the average tenant stay here, and is there a school-zone premium baked into asking?
- Crime grade is F in this area — have there been break-ins, vandalism, or insurance claims at this property in the last 3 years? What carrier currently insures it and at what premium?
- What's the average days-on-market for RENTAL listings here right now (not sales)? A rising rental-DOM trend means longer vacancies and softer asking-rent achievability than the comps imply.
- What's the recent tenant-quality profile in this submarket — average credit score on applications, eviction rate, late-payment / NSF rate, and stable-employment percentage? A property-management company in the area should have these aggregated.
- How much new apartment / multifamily construction is in the pipeline within 1–3 miles? Heavy new supply (>2% of stock underway) typically softens rents 12–24 months out; light construction supports rent growth.
Investment metrics
- 1% rule
- 2.02% ✓
- Cap rate
- 10.78%
- Cash-on-cash
- 16.04%
- DSCR
- 1.71
- GRM
- 4.1
CMA / ARV
No comps found within radius.
Projected returns pro-forma
-3.0% appreciation · 2.89% rent growth · sell at horizon
- IRR
- 7.1%
- Equity multiple
- 1.28×
- Total profit
- $5,395
- Equity at exit
- $10,363
- IRR
- 16.5%
- Equity multiple
- 2.36×
- Total profit
- $26,397
- Equity at exit
- $6,009
Cash invested: $19,460 (down + closing). Projections, not guarantees.
Landlord ↔ Tenant lean methodology
- Overall (STATE)
- 87 Strongly Landlord-Friendly
- State Florida
- 87 Strongly Landlord-Friendly · R+3
- County
- — inherits STATE
- City
- — inherits STATE
ZIP-level market 32608
- Rents YoY
- 2.9%
- Active inventory
- 594
- Price-to-rent
- 4.1×
Monthly cashflow live
- Estimated rent
- $1,403 medium interval (Pro) →
- Mortgage (P&I)
- −$364
- Tax from tax record
- −$129 /mo · $1,543/yr
- Insurance
- −$29
- HOA
- −$326
- Vacancy / Maint / Mgmt
- −$295
- Net cashflow
- $260
Break-even live
UW: 25.0% down · 7.5% · 30yr · 1.5% tax · 5.0% vac · 8.0% maint · 8.0% mgmt
Financing live
Cash to close
- Down payment
- $17,375
- Closing costs
- $2,085
- Reserves months
- —
- Total cash needed
- —
Loan-product check · same deal, 3 products live
Conventional
25% down · 7.5% · 30yr
- Down + closing
- —
- Monthly P&I
- —
- Monthly cashflow
- —
- DSCR
- —
- Eligible?
- —
Personal DTI + credit; lowest rate.
DSCR
20% down · 8.5% · 30yr
- Down + closing
- —
- Monthly P&I
- —
- Monthly cashflow
- —
- DSCR
- —
- Eligible?
- —
No personal income docs; deal must DSCR.
Hard money
10% down · 12.0% · 12mo
- Down + closing
- —
- Monthly P&I
- —
- Monthly cashflow
- —
- DSCR
- —
- Eligible?
- —
Short-term bridge; refi at stabilization.
Rent comps 1 comps
| Address | Beds | Baths | Sqft | Rent | $/sqft | DOM | Units | Dist |
|---|---|---|---|---|---|---|---|---|
| 4455 SW 34th St Gainesville, FL | 1.0–3.0 | 1.0–3.0 | 1033 | $1,569 | $1.52 | 13d | 28 | 1.20mi |
HOA detail condo
- Monthly dues
- $326 · $3,912/yr
- Likely covers
- pool
- Assessments
- None detected in remarks — confirm with the listing agent.
Listing history 12 events
-
2026-06-18days on market $69,500 Active 15 DOM
-
2026-06-17days on market $69,500 Active 14 DOM
-
2026-06-16days on market $69,500 Active 13 DOM
-
2026-06-15days on market $69,500 Active 12 DOM
-
2026-06-14days on market $69,500 Active 10 DOM
-
2026-06-13days on market $69,500 Active 9 DOM
-
2026-06-10days on market $69,500 Active 7 DOM
-
2026-06-09days on market $69,500 Active 6 DOM
-
2026-06-08days on market $69,500 Active 5 DOM
-
2026-06-07days on market $69,500 Active 4 DOM
-
2026-06-03remarks 699-char remark
-
2026-06-03$69,500 Active 1 DOM
ⓘ Source: listings_history table (triggers on properties + properties_extension) + one-shot
backfill from property_details.listing_events for pre-trigger history.
Tax reassessment forecast FL · Resets to sale price
- Current annual tax
- $1,543 · $129/mo
- Projected year-2 tax
- $1,543 · $129/mo
- Expected delta
- $0/yr ($0/mo · 0.0%)
ⓘ Screening estimate from a state-policy table — verify with the county assessor before closing.
Nearby sold comps map
Loading sold comps map…
Walkable amenities ~0.75 mi
Loading nearby amenities…
Taxation est. · year 1
- Rental income
- $16,832
- − Mortgage interest
- −$3,893
- − Property taxes
- −$1,543
- − Insurance
- −$348
- − Repairs & maintenance
- −$1,347
- − Management
- −$1,347
- − HOA
- −$3,912
- − Depreciation
- −$2,022
- Taxable income
- $2,421
- Est. tax owed @ 24.0%
- −$581
- After-tax cash flow
- $2,540/yr
For passive investors: Depreciation is non-cash, so a rental often shows a tax loss while cash-flowing — sheltering income. Rental losses are passive: they offset passive income freely, and up to $25,000/yr can offset ordinary (W-2) income if you actively participate and your MAGI is under $100k (phasing out to $0 by $150k); unused losses carry forward. On sale, claimed depreciation is recaptured at up to 25%, and gains may owe capital-gains tax (a 1031 exchange can defer both). Figures are a year-1 estimate at your 24.0% rate — not tax advice; consult a CPA.
Schools (NCES district)
- District
- Alachua
- NCES district ID
- 1200030
- Math proficiency
- 49% ▼ -9.00%
- Reading proficiency
- 54% ▼ -3.00%
- Median HH income
- $42,683
- Composite
- 43.31/100
- National rank
- #3038
- State rank
- #30 of 73 in FL
Livability — Gainesville
- Score
- 81/100
- State rank
- #97
- US rank
- #1480
Category grades
Schools grade is shown separately in the Schools card above.
Census & demographics
- Census place
- Gainesville, FL
- County
- Alachua County · 218,005 people
- City population
- 188,348
- Metro
- Gainesville, FL
- Population (ZIP)
- 54,566
- Household income
- $61,588
- Rent vs Own
- Severe rent burden
- 4709.0
Population outlook (Alachua County) Hauer SSP2
- Today (2025)
- 289,834 people
- By 2030
- 305,873 · +5.5%
- By 2040
- 335,246 · +15.7%
- By 2050
- 364,719 · +25.8%
- By 2075
- 436,665 · +50.7%
- By 2100
- 482,920 · +66.6%
Race, ethnicity, and origin ACS 2023
- Neighborhood character
- Diverse neighborhood (Simpson 0.64)
- Race & ethnicity
- White 55% Hispanic / Latino 16% Black 13% Asian 12% Two or more races 11%
- Hispanic origin (detail)
- Mexican 2% Puerto Rican 4% Cuban 4%
- Common ancestry
- Slovak 2% Italian 2% Romanian 2%
- Foreign-born
- 19% · Canada, China, South Korea
- Languages at home
- 75% English-only · Spanish 10% Other Indo-European 5% Chinese 3%
Political lean MEDSL · Alachua
- 2024 margin
- Strong D (+21.0) · D 59.7% · R 38.8% · Other 1.5%
- 2008→2024 swing
- -0.6pp no change · 2008: 21.6pp · 2024: 21.0pp
- All cycles
- 2024: D+21.0 2020: D+27.2 2016: D+22.5 2012: D+17.3 2008: D+21.6
Not yet ingested
- Civics
- —
Market trends
- HPI YoY
- ▼ -150.91%
- Current HPI
- 253.0629
- Rent YoY
- ▲ 2.89%
- Metro
- Gainesville, FL
- State GDP YoY
- ▲ 3.28%
- F500 in state
- 36
Industry mix (Fortune 500 HQ in FL)
| Industry | F500 HQs | Revenue |
|---|---|---|
| Industrial Technology | 2 | $29B |
|
||
| Insurance | 2 | $17B |
|
||
| Retail | 1 | $60B |
|
||
| Technology Distribution | 1 | $58B |
|
||
| Homebuilding | 1 | $35B |
|
||
| Technology Manufacturing | 1 | $35B |
|
||
Price history
+117.2% since first listed4 events — show timeline
- 2026-06-03 Listed $69,500 Stellar MLS as Distributed by MLS Grid
- 2004-01-30 Sold (Public Records) $164,000 Public Records
- 2003-01-16 Sold (Public Records) $638,000 Public Records
- 2002-01-03 Sold (Public Records) $32,000 Public Records
Property tax history
+5.8%/yrLatest (2025): $1,543 · -14.9% YoY. Source: county tax records.
Cash-flow waterfall
monthlySold comps — $/sqft
last 12 mo · ≤1 miLoading sold comps…