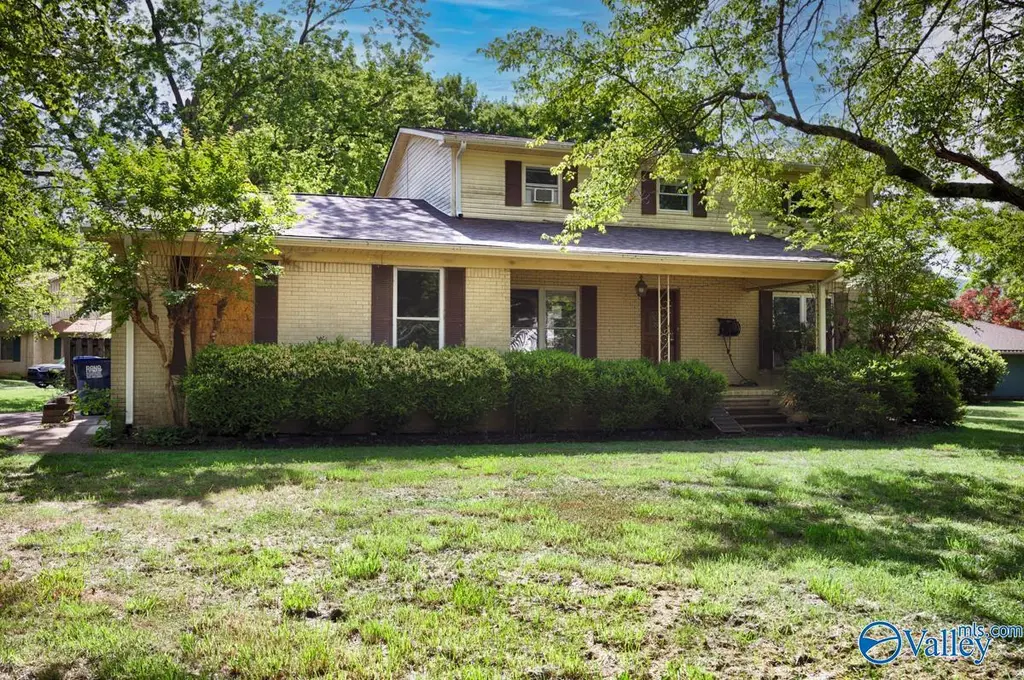
2100 Aftonbrae Dr · Huntsville, AL
Flood risk 1/10 · Minimal
- FEMA flood zone
- X (unshaded)
- Chance of flooding over 30 yrs
- 0.0%
- Est. flood insurance / yr
- $507 – $1,088
Fire risk 2/10 · Minimal
- Est. fire insurance / yr
- $916 – $1,700
Heat risk 6/10 · Moderate
- Hot days now (above 104°F)
- 7 days/yr
- Hot days in 30 yrs
- 20 days/yr
Wind risk 4/10 · Minor
- Chance of severe wind over 30 yrs
- 19.0%
Air-quality risk 1/10 · Minimal
- Unhealthy air days now
- 0 days/yr
- Unhealthy air days in 30 yrs
- 0 days/yr
Risk factors via First Street. Map © Google.
Why this score? — see what drove the B- grade
The composite is a weighted blend of 9 inputs, each scored 0–100. Each bar is that input's sub-score; the figure is the points it added to the 100-point composite (weight × sub-score).
- Cash flow +25.3/30.0
- ARV discount +15.0/15.0
- DSCR +8.3/10.0
- 1% rule +5.8/10.0
- Livability +4.1/5.0
- Rent growth +3.4/5.0
- Schools +2.9/10.0
- Condition / age +2.5/5.0
- Appreciation +0.0/10.0
$200,000
🖨 Deal sheet 📄 Offer letter ✓ Due diligence
Listing remarks
Investor special with strong upside potential. This property offers a rare opportunity to renovate and build equity in a convenient location near major amenities, shopping, and commuter routes. Ideal for investors or buyers looking to customize a home from the ground up that are looking for an amazing lot. Sold as-is.
Key facts
- Commuter routes
- Shopping
- Convenient location
Tags
Property features AI
Finance
- HOA & community: No homeowners association; Subdivision: Willow Park Estates; Community curbs
Exterior
- Parking: Garage faces side
- Utilities: Public water; Public sewer
- Home design: Single family residence; Two levels; Built in 1965; Not new construction
- Construction: Vinyl siding
- Exterior features: Treed lot; Curb and gutters; Concrete driveway
Interior
- Bathrooms: 2 full bathrooms
- Heating & cooling: Central heating; Central cooling
- Interior features: Crawl space basement
Neighborhood map
What this means for you Summary
Snapshot
- This is a 4-bed/3.0-bath single-family listed at $200k.
Deal economics
- At list price, monthly cash flow is $452 ($5k/yr) — positive.
- The deal already cash-flows at list — no discount required.
- Meets the 1% rule at list price ($2k rent vs $200k).
- Cap rate 9.0% vs local median 3.8% in Huntsville — top-decile yield for the area; either an underpriced asset or a hidden risk that comps aren't pricing in. Stress-test before assuming the spread holds.
Location & tenants
- Location reads 82/100 on livability (#3 in AL, #1,082 nationally) — a professional / high-income tenant draw. Strengths: commute A+, cost of living A+, housing A+; Watch: crime F.
- Huntsville City (urban): math 21% / reading 46% proficiency, ranked #48 of 129 in AL (top 37%) — families likely to look elsewhere, expect single-tenant / working-renter base with shorter leases.
- Zoned schools: Weatherly Heights Elementary School (math 27% / reading 62%, grade F, #171 of 627 statewide, top 31%, 481 students, 42% FRL); Mountain Gap Middle School (math 27% / reading 63%, grade D, #38 of 257 statewide, top 14%, 419 students, 44% FRL); Virgil Grissom High School (math 34% / reading 40%, grade F, #39 of 305 statewide, top 13%, 1,974 students, 43% FRL) — zoned schools at 43% FRL track the district average.
- Market conditions: Rents rising (+3.7%/yr); 280 active listings in the ZIP; 6 comparable units currently listed for rent nearby; rentals lingering (median 44d on market — plan ~5-8 weeks vacancy on turnover, expect pricing pressure); 83% of comp listings sitting > 30 days — soft ceiling on asking rent; solid renter incomes; 4,709 units permitted in Madison County in 2024 (1,186 in 5+ unit buildings).
Forward outlook
- Local home prices are declining (-3.0%/yr); year-one equity from $1k of loan paydown is wiped out by about $6k of value loss. Plan a longer hold.
- Madison County population projected at +18% by 2050 — long-run rental-demand tailwind backs the buy-and-hold thesis.
- At projected returns (-3.0% appreciation + 3.7% rent growth), your $56k cash investment doubles in ~10 years — after that, you're playing with house money.
Negotiation context
- Only 10 days on market — expect competitive offers; lowballing is unlikely to land.
- Current owner paid $152k; 31% above their basis — modest negotiation headroom, anchor on the comps not their cost.
Risks & watch-outs
- Climate carrying-cost: extreme-heat days projected 7→20/yr by 2055 (HVAC capex compounding) — expect insurance premiums to compound above CPI over the hold.
Questions for the listing agent
- Built in 1965 — when were the roof, HVAC, electrical panel, plumbing, and water heater last replaced?
- Is there a deadline driving the sale (1031 exchange, divorce, estate, relocation)? That informs how much negotiation room exists.
- Crime grade is F in this area — have there been break-ins, vandalism, or insurance claims at this property in the last 3 years? What carrier currently insures it and at what premium?
- What's the average days-on-market for RENTAL listings here right now (not sales)? A rising rental-DOM trend means longer vacancies and softer asking-rent achievability than the comps imply.
- What's the recent tenant-quality profile in this submarket — average credit score on applications, eviction rate, late-payment / NSF rate, and stable-employment percentage? A property-management company in the area should have these aggregated.
- How much new for-sale + rental construction is in the pipeline within 1–3 miles? Heavy new supply typically softens prices + rents 12–24 months out; constrained supply supports both.
Investment metrics
- 1% rule
- 1.08% ✓
- Cap rate
- 9.00%
- Cash-on-cash
- 9.69%
- DSCR
- 1.43
- GRM
- 7.7
CMA / ARV
- ARV (median comp)
- $342,711
- List price
- $200,000
- Delta
- -41.64%
- Verdict
- UNDERPRICED
- Comps
- 20 within 1.0 mi
Show comp detail 12 sales within ~0.75 mi
| Address | Dist | Beds/Ba | Sqft | Sold | Price | $/sf | Match |
|---|---|---|---|---|---|---|---|
| 9410 Valley Ln | 0.33mi | 4/3.0 | 2,204 (+3%) | 7mo | $343,000 | $156 | 73 |
| 2509 SE Box Canyon Rd SE | 0.33mi | 4/2.5 | 2,233 (+5%) | 7mo | $345,500 | $155 | 69 |
| 10012 Allison Dr | 0.17mi | 5/2.5 (+1) | 2,342 (+10%) | 7mo | $330,000 | $141 | 63 |
| 9700 Welch Cir SE | 0.50mi | 3/2.5 (-1) | 2,233 (+5%) | 1mo | $345,000 | $155 | 61 |
| 9628 Waldrop Dr SE | 0.53mi | 4/2.5 | 2,231 (+4%) | 6mo | $370,000 | $166 | 61 |
| 9403 Ojay Dr SE | 0.52mi | 4/2.5 | 2,290 (+7%) | 6mo | $350,000 | $153 | 57 |
| 9606 Dortmund Dr SE | 0.69mi | 4/2.5 | 2,230 (+4%) | 4mo | $240,500 | $108 | 55 |
| 9408 Ojay Dr | 0.52mi | 4/2.5 | 2,407 (+13%) | 6mo | $376,000 | $156 | 48 |
| 1906 Spanish Oaks Dr | 0.68mi | 3/2.5 (-1) | 2,301 (+8%) | 2mo | $314,500 | $137 | 47 |
| 9702 Dortmund Dr SE | 0.61mi | 4/2.5 | 1,821 (-15%) | 2mo | $340,000 | $187 | 44 |
| 9413 Lynns Ter SE | 0.62mi | 4/2.5 | 2,430 (+14%) | 4mo | $325,000 | $134 | 43 |
| 2703 Box Canyon Rd SE | 0.65mi | 4/2.5 | 2,380 (+12%) | 8mo | $330,000 | $139 | 42 |
Match score weights: distance 35% · size 25% · config 20% · recency 20%. Top-matched comps best support the ARV.
Projected returns pro-forma
-3.0% appreciation · 3.72% rent growth · sell at horizon
- IRR
- -1.0%
- Equity multiple
- 0.96×
- Total profit
- $-2,080
- Equity at exit
- $29,821
- IRR
- 9.4%
- Equity multiple
- 1.74×
- Total profit
- $41,681
- Equity at exit
- $17,292
Cash invested: $56,000 (down + closing). Projections, not guarantees.
Landlord ↔ Tenant lean methodology
- Overall (STATE)
- 90 Strongly Landlord-Friendly
- State Alabama
- 90 Strongly Landlord-Friendly · R+15
- County
- — inherits STATE
- City
- — inherits STATE
ZIP-level market 35803
- Home prices YoY
- -22.9%
- Rents YoY
- 3.7%
- Active inventory
- 280
- Price-to-rent
- 7.7×
Monthly cashflow live
- Estimated rent
- $2,169 high interval (Pro) →
- Mortgage (P&I)
- −$1,049
- Tax from tax record
- −$130 /mo · $1,555/yr
- Insurance
- −$83
- HOA
- −$0
- Vacancy / Maint / Mgmt
- −$456
- Net cashflow
- $452
Break-even live
UW: 25.0% down · 7.5% · 30yr · 1.5% tax · 5.0% vac · 8.0% maint · 8.0% mgmt
Financing live
Cash to close
- Down payment
- $50,000
- Closing costs
- $6,000
- Reserves months
- —
- Total cash needed
- —
Loan-product check · same deal, 3 products live
Conventional
25% down · 7.5% · 30yr
- Down + closing
- —
- Monthly P&I
- —
- Monthly cashflow
- —
- DSCR
- —
- Eligible?
- —
Personal DTI + credit; lowest rate.
DSCR
20% down · 8.5% · 30yr
- Down + closing
- —
- Monthly P&I
- —
- Monthly cashflow
- —
- DSCR
- —
- Eligible?
- —
No personal income docs; deal must DSCR.
Hard money
10% down · 12.0% · 12mo
- Down + closing
- —
- Monthly P&I
- —
- Monthly cashflow
- —
- DSCR
- —
- Eligible?
- —
Short-term bridge; refi at stabilization.
Rent comps 6 comps
| Address | Beds | Baths | Sqft | Rent | $/sqft | DOM | Units | Dist |
|---|---|---|---|---|---|---|---|---|
| 9802 Dolphin Dr SE Huntsville, AL | 4.0 | 2.0 | 2160 | $2,175 | $1.01 | 43d | 1 | 0.82mi |
| 1225 Willowbrook Dr SE Huntsville, AL | 1.0–3.0 | 1.0–2.5 | 1132 | $1,238 | $1.09 | 23d | 21 | 1.05mi |
| 8711 Edgehill Dr SE Huntsville, AL | 3.0 | 2.5 | 2263 | $2,250 | $0.99 | 43d | 1 | 1.18mi |
| 2624 Excalibur Dr SE Huntsville, AL | 4.0 | 2.5 | 2350 | $2,300 | $0.98 | 43d | 1 | 1.25mi |
| 912 Mountain Gap Rd SE Huntsville, AL | 3.0 | 2.0 | 1500 | $1,700 | $1.13 | 43d | 1 | 1.44mi |
| 1305 Hiwan Trl SE Huntsville, AL | 4.0 | 2.5 | 2656 | $2,500 | $0.94 | 43d | 1 | 1.48mi |
Listing history 3 events
-
2026-05-15status Pending 319-char remark
-
2026-05-05$200,000 Active 319-char remark
-
2005-08-16soldstatus $152,100
ⓘ Source: listings_history table (triggers on properties + properties_extension) + one-shot
backfill from property_details.listing_events for pre-trigger history.
Tax reassessment forecast AL · Resets to sale price
- Current annual tax
- $1,555 · $130/mo
- Projected year-2 tax
- $1,555 · $130/mo
- Expected delta
- $0/yr ($0/mo · 0.0%)
ⓘ Screening estimate from a state-policy table — verify with the county assessor before closing.
Climate risk First Street
- Flood 1/10 Low FEMA zone X (unshaded) · 0% chance over 30 yrs
- Wildfire 2/10 Low
- Heat 6/10 Major 7 d/yr ≥104°F today · 20 d/yr by 30 yrs out
- Wind 4/10 Moderate 19% chance of damaging wind over 30 yrs
- Air quality 1/10 Low 0 unhealthy d/yr today · 0 by 30 yrs out
Nearby sold comps map
Loading sold comps map…
Walkable amenities ~0.75 mi
Loading nearby amenities…
Taxation est. · year 1
- Rental income
- $26,031
- − Mortgage interest
- −$11,203
- − Property taxes
- −$1,555
- − Insurance
- −$1,000
- − Repairs & maintenance
- −$2,083
- − Management
- −$2,083
- − Depreciation
- −$5,818
- Taxable income
- $2,290
- Est. tax owed @ 24.0%
- −$550
- After-tax cash flow
- $4,874/yr
For passive investors: Depreciation is non-cash, so a rental often shows a tax loss while cash-flowing — sheltering income. Rental losses are passive: they offset passive income freely, and up to $25,000/yr can offset ordinary (W-2) income if you actively participate and your MAGI is under $100k (phasing out to $0 by $150k); unused losses carry forward. On sale, claimed depreciation is recaptured at up to 25%, and gains may owe capital-gains tax (a 1031 exchange can defer both). Figures are a year-1 estimate at your 24.0% rate — not tax advice; consult a CPA.
Schools (NCES district)
- District
- Huntsville City
- NCES district ID
- 0101800
- Math proficiency
- 21% ▼ -23.00%
- Reading proficiency
- 46% ▬ 0.00%
- Median HH income
- $48,264
- Composite
- 28.84/100
- National rank
- #6647
- State rank
- #48 of 129 in AL
Livability — Huntsville
- Score
- 82/100
- State rank
- #3
- US rank
- #1082
Category grades
Schools grade is shown separately in the Schools card above.
Census & demographics
- Census place
- Huntsville, AL
- County
- Madison County · 380,832 people
- City population
- 220,435
- Metro
- Huntsville, AL
- Population (ZIP)
- 29,197
- Household income
- $100,846
- Rent vs Own
- Severe rent burden
- 411.0
Population outlook (Madison County) Hauer SSP2
- Today (2025)
- 392,086 people
- By 2030
- 409,788 · +4.5%
- By 2040
- 440,557 · +12.4%
- By 2050
- 460,990 · +17.6%
- By 2075
- 502,872 · +28.3%
- By 2100
- 513,623 · +31.0%
Race, ethnicity, and origin ACS 2023
- Neighborhood character
- Predominantly White (82%)
- Race & ethnicity
- White 82% Hispanic / Latino 7% Two or more races 7% Black 4% Asian 3%
- Hispanic origin (detail)
- Mexican 4% Puerto Rican 1%
- Common ancestry
- Slovak 3% Italian 2% Lithuanian 2%
- Foreign-born
- 6% · Canada, China, South Korea
- Languages at home
- 92% English-only · Spanish 3% Chinese 2% German/W. Germanic 1%
Political lean MEDSL · Madison
- 2024 margin
- Lean R (+9.0) · D 44.7% · R 53.7% · Other 1.6%
- 2008→2024 swing
- +6.0pp toward D · 2008: -14.9pp · 2024: -9.0pp
- All cycles
- 2024: R+9.0 2020: R+8.0 2016: R+16.8 2012: R+18.7 2008: R+14.9
Not yet ingested
- Civics
- —
Market trends
- HPI YoY
- ▼ -110.53%
- Current HPI
- 372.1842
- Rent YoY
- ▲ 3.72%
- Metro
- Huntsville, AL
- State GDP YoY
- ▲ 2.94%
- F500 in state
- 4
Industry mix (Fortune 500 HQ in AL)
| Industry | F500 HQs | Revenue |
|---|---|---|
| Financial Services | 1 | $8B |
|
||
| Healthcare | 1 | $5B |
|
||
Price history
+31.5% since first listed3 events — show timeline
- 2026-05-15 Pending — VMLS
- 2026-05-05 Listed $200,000 VMLS
- 2005-08-16 Sold (Public Records) $152,100 Public Records
Property tax history
-3.1%/yrLatest (2024): $1,555 · +6.7% YoY. Source: county tax records.
Cash-flow waterfall
monthlySold comps — $/sqft
last 12 mo · ≤1 miLoading sold comps…