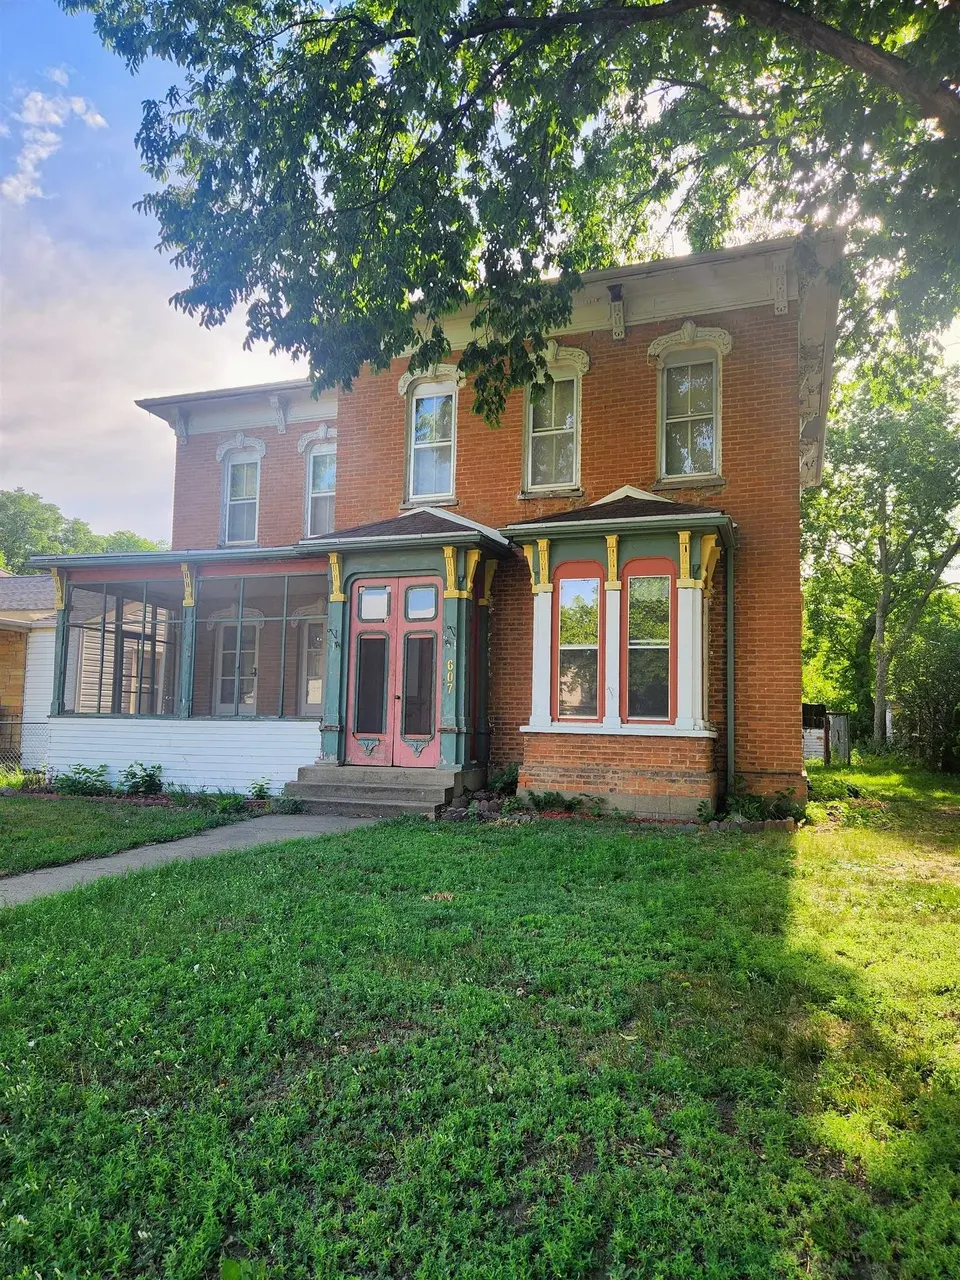
607 Douglas Ave · Yankton, SD
Flood risk 1/10 · Minimal
- FEMA flood zone
- X (shaded)
- Chance of flooding over 30 yrs
- 0.0%
- Est. flood insurance / yr
- $473 – $860
Fire risk 2/10 · Minimal
- Est. fire insurance / yr
- $1,342 – $2,492
Heat risk 3/10 · Minor
- Hot days now (above 102°F)
- 7 days/yr
- Hot days in 30 yrs
- 14 days/yr
Wind risk 2/10 · Minimal
- Chance of severe wind over 30 yrs
- —
Air-quality risk 2/10 · Minimal
- Unhealthy air days now
- 1 days/yr
- Unhealthy air days in 30 yrs
- 1 days/yr
Risk factors via First Street. Map © Google.
Why this score? — see what drove the B grade
The composite is a weighted blend of 9 inputs, each scored 0–100. Each bar is that input's sub-score; the figure is the points it added to the 100-point composite (weight × sub-score).
- Cash flow +30.0/30.0
- 1% rule +10.0/10.0
- DSCR +10.0/10.0
- ARV discount +7.5/15.0
- Schools +4.6/10.0
- Livability +3.8/5.0
- Rent growth +2.5/5.0
- Condition / age +2.5/5.0
- Appreciation +0.0/10.0
$49,900
🖨 Deal sheet (PDF) 📄 Offer letter ✓ Due diligence
Key facts
- 7,405 sq ft lot
- Built 1878
- Listed 9 days
Property features AI
Finance
- Other: Frontage length: 48 feet; Lot size: 0.17 acres
Exterior
- Utilities: Public water; Public sewer
- Home design: Single family residence; Residential property; Two-story home
- Construction: Brick construction; Built area above grade: 2,910
- Exterior features: Asphalt shingle roof
Interior
- Bathrooms: 1 full bathroom; 1 three-quarter bathroom
- Heating & cooling: Natural gas heating; Hot water heating
- Interior features: Full basement with crawl space
Neighborhood map
What this means for you Summary
Snapshot
- This is a 7-bed/2.0-bath single-family listed at $50k.
Deal economics
- At list price, monthly cash flow is $817 ($10k/yr) — positive.
- The deal already cash-flows at list — no discount required.
- Meets the 1% rule at list price ($1k rent vs $50k).
Location & tenants
- Location reads 76/100 on livability (#23 in SD, #3,454 nationally) — a middle-class / working-renter tenant base. Strengths: cost of living A+, housing A+, health & safety A; Watch: amenities F, commute F.
- Yankton School District 63-3 (town): math 49% / reading 60% proficiency, ranked #17 of 59 in SD (top 29%) — acceptable for families but not a draw, mixed tenant base, ~2y average lease.
- Zoned schools: Yankton Middle School - 02 (math 52% / reading 60%, grade B-, #34 of 143 statewide, top 23%, 606 students, 33% FRL); Yankton High School - 01 (math 42% / reading 75%, grade C, #50 of 151 statewide, top 33%, 942 students, 24% FRL) — zoned schools at 28% FRL track the district average.
- Market conditions: 193 active listings in the ZIP; 179 units permitted in Yankton County in 2024 (130 in 5+ unit buildings).
Forward outlook
- Local home prices are declining (-3.0%/yr); year-one equity from $345 of loan paydown is wiped out by about $1k of value loss. Plan a longer hold.
- Yankton County population projected at +4% by 2050 — modest demand growth; plan on rents tracking national, not racing it.
- At projected returns (-3.0% appreciation + 3.0% rent growth), your $14k cash investment doubles in ~2 years — after that, you're playing with house money.
Negotiation context
- Only 9 days on market — expect competitive offers; lowballing is unlikely to land.
Risks & watch-outs
- Watch-outs: built in 1878 — expect roof / HVAC / electrical / plumbing capex.
Questions for the listing agent
- Built in 1878 — when were the roof, HVAC, electrical panel, plumbing, and water heater last replaced?
- Is there a deadline driving the sale (1031 exchange, divorce, estate, relocation)? That informs how much negotiation room exists.
- What's the average days-on-market for RENTAL listings here right now (not sales)? A rising rental-DOM trend means longer vacancies and softer asking-rent achievability than the comps imply.
- What's the recent tenant-quality profile in this submarket — average credit score on applications, eviction rate, late-payment / NSF rate, and stable-employment percentage? A property-management company in the area should have these aggregated.
- How much new for-sale + rental construction is in the pipeline within 1–3 miles? Heavy new supply typically softens prices + rents 12–24 months out; constrained supply supports both.
Investment metrics
- 1% rule
- 2.95% ✓
- Cap rate
- 25.94%
- Cash-on-cash
- 70.15%
- DSCR
- 4.12
- GRM
- 2.8
CMA / ARV
No comps found within radius.
Projected returns pro-forma
-3.0% appreciation · 3.0% rent growth · sell at horizon
- IRR
- 69.7%
- Equity multiple
- 4.15×
- Total profit
- $43,960
- Equity at exit
- $7,440
- IRR
- 73.7%
- Equity multiple
- 8.54×
- Total profit
- $105,359
- Equity at exit
- $4,314
Cash invested: $13,972 (down + closing). Projections, not guarantees.
Landlord ↔ Tenant lean methodology
- Overall (STATE)
- 83 Strongly Landlord-Friendly
- State South Dakota
- 83 Strongly Landlord-Friendly · R+16
- County
- — inherits STATE
- City
- — inherits STATE
ZIP-level market 57078
- Active inventory
- 193
- Price-to-rent
- 2.8×
Monthly cashflow live
- Estimated rent
- $1,470 medium interval (Pro) →
- Mortgage (P&I)
- −$262
- Tax est. 1.5%
- −$62 /mo · $748/yr
- Insurance
- −$21
- HOA
- −$0
- Vacancy / Maint / Mgmt
- −$309
- Net cashflow
- $817
Break-even live
Sensitivity live
| Price | -10% $851 | -5% $834 | +0% $817 | +5% $800 | +10% $782 |
|---|---|---|---|---|---|
| Rent | -10% $701 | -5% $759 | +0% $817 | +5% $875 | +10% $933 |
| Rate | -1.0pp $842 | -0.5pp $830 | base $817 | +0.5pp $804 | +1.0pp $791 |
UW: 25.0% down · 7.5% · 30yr · 1.5% tax · 5.0% vac · 8.0% maint · 8.0% mgmt
Financing live
Cash to close
- Down payment
- $12,475
- Closing costs
- $1,497
- Reserves months
- —
- Total cash needed
- —
Loan-product check · same deal, 3 products live
Conventional
25% down · 7.5% · 30yr
- Down + closing
- —
- Monthly P&I
- —
- Monthly cashflow
- —
- DSCR
- —
- Eligible?
- —
Personal DTI + credit; lowest rate.
DSCR
20% down · 8.5% · 30yr
- Down + closing
- —
- Monthly P&I
- —
- Monthly cashflow
- —
- DSCR
- —
- Eligible?
- —
No personal income docs; deal must DSCR.
Hard money
10% down · 12.0% · 12mo
- Down + closing
- —
- Monthly P&I
- —
- Monthly cashflow
- —
- DSCR
- —
- Eligible?
- —
Short-term bridge; refi at stabilization.
Listing history 7 events
-
2026-06-21days on market $49,900 Active 9 DOM
-
2026-06-21days on market $49,900 Active 8 DOM
-
2026-06-18days on market $49,900 Active 6 DOM
-
2026-06-17days on market $49,900 Active 5 DOM
-
2026-06-16days on market $49,900 Active 4 DOM
-
2026-06-15days on market $49,900 Active 3 DOM
-
2026-06-12$49,900 Active 1 DOM
ⓘ Source: listings_history table (triggers on properties + properties_extension) + one-shot
backfill from property_details.listing_events for pre-trigger history.
Climate risk First Street
- Flood 1/10 Low FEMA zone X (shaded) · 0% chance over 30 yrs
- Wildfire 2/10 Low
- Heat 3/10 Moderate 7 d/yr ≥102°F today · 14 d/yr by 30 yrs out
- Wind 2/10 Low
- Air quality 2/10 Low 1 unhealthy d/yr today · 1 by 30 yrs out
Nearby sold comps map
Loading sold comps map…
Walkable amenities ~0.75 mi
Loading nearby amenities…
Taxation est. · year 1
- Rental income
- $17,646
- − Mortgage interest
- −$2,795
- − Property taxes
- −$748
- − Insurance
- −$250
- − Repairs & maintenance
- −$1,412
- − Management
- −$1,412
- − Depreciation
- −$1,452
- Taxable income
- $9,578
- Est. tax owed @ 24.0%
- −$2,299
- After-tax cash flow
- $7,503/yr
For passive investors: Depreciation is non-cash, so a rental often shows a tax loss while cash-flowing — sheltering income. Rental losses are passive: they offset passive income freely, and up to $25,000/yr can offset ordinary (W-2) income if you actively participate and your MAGI is under $100k (phasing out to $0 by $150k); unused losses carry forward. On sale, claimed depreciation is recaptured at up to 25%, and gains may owe capital-gains tax (a 1031 exchange can defer both). Figures are a year-1 estimate at your 24.0% rate — not tax advice; consult a CPA.
Schools (NCES district)
- District
- Yankton School District 63-3
- NCES district ID
- 4680430
- Math proficiency
- 49% ▼ -3.00%
- Reading proficiency
- 60% ▼ -1.00%
- Median HH income
- $48,788
- Composite
- 46.36/100
- National rank
- #2463
- State rank
- #17 of 59 in SD
Livability — Yankton
- Score
- 76/100
- State rank
- #23
- US rank
- #3454
Category grades
Schools grade is shown separately in the Schools card above.
Census & demographics
- Census place
- Yankton, SD
- Population (ZIP)
- 20,547
Population outlook (Yankton County) Hauer SSP2
- Today (2025)
- 23,495 people
- By 2030
- 23,705 · +0.9%
- By 2040
- 24,037 · +2.3%
- By 2050
- 24,561 · +4.5%
- By 2075
- 28,069 · +19.5%
- By 2100
- 33,542 · +42.8%
Race, ethnicity, and origin ACS 2023
- Neighborhood character
- Predominantly White (86%)
- Race & ethnicity
- White 86% Two or more races 7% Hispanic / Latino 6% Native American 3% Black 2%
- Hispanic origin (detail)
- Mexican 3% Cuban 2%
- Common ancestry
- Portuguese 7% Iranian 3% Lithuanian 3%
- Foreign-born
- 3% · Canada
- Languages at home
- 94% English-only · Spanish 4%
Political lean MEDSL · Yankton
- 2024 margin
- Strong R (+25.5) · D 35.9% · R 61.4% · Other 2.8%
- 2008→2024 swing
- -23.6pp toward R · 2008: -2.0pp · 2024: -25.5pp
- All cycles
- 2024: R+25.5 2020: R+23.5 2016: R+24.5 2012: R+12.7 2008: R+2.0
Not yet ingested
- Civics
- —
Market trends
- HPI YoY
- ▼ -113.11%
- Current HPI
- 193.4576
- Rent YoY
- —
- Metro
- —
- State GDP YoY
- ▲ 0.70%
- F500 in state
- 2
Industry mix (Fortune 500 HQ in SD)
| Industry | F500 HQs | Revenue |
|---|---|---|
| Utilities | 1 | $1B |
|
||
Price history
1 event — show timeline
- 2026-06-09 Listed $49,900 MARMLS
Property tax history
+4.9%/yrLatest (2025): $3,210 · +23.0% YoY. Source: county tax records.
Cash-flow waterfall
monthlySold comps — $/sqft
last 12 mo · ≤1 miLoading sold comps…