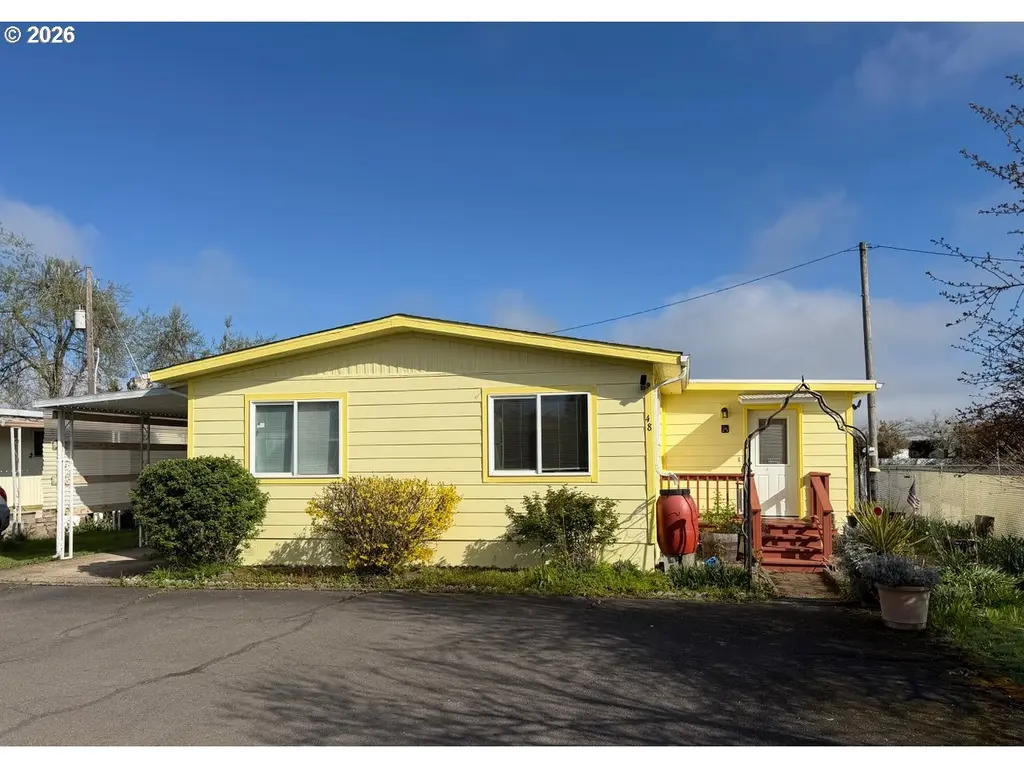
400 N Mill St #48 · Creswell, OR
Flood risk 1/10 · Minimal
- FEMA flood zone
- X (unshaded)
- Chance of flooding over 30 yrs
- 0.0%
- Est. flood insurance / yr
- $507 – $1,088
Fire risk 4/10 · Minor
- Est. fire insurance / yr
- $498 – $926
Heat risk 4/10 · Minor
- Hot days now (above 92°F)
- 7 days/yr
- Hot days in 30 yrs
- 15 days/yr
Wind risk 1/10 · Minimal
- Chance of severe wind over 30 yrs
- —
Air-quality risk 10/10 · Severe
- Unhealthy air days now
- 14 days/yr
- Unhealthy air days in 30 yrs
- 15 days/yr
Risk factors via First Street. Map © Google.
Why this score? — see what drove the C+ grade
The composite is a weighted blend of 9 inputs, each scored 0–100. Each bar is that input's sub-score; the figure is the points it added to the 100-point composite (weight × sub-score).
- Cash flow +17.8/30.0
- ARV discount +15.0/15.0
- 1% rule +10.0/10.0
- DSCR +5.6/10.0
- Schools +4.0/10.0
- Livability +3.8/5.0
- Rent growth +2.5/5.0
- Condition / age +2.5/5.0
- Appreciation +0.0/10.0
$64,950
🖨 Deal sheet 📄 Offer letter ✓ Due diligence
Listing remarks
Great condition, 2 bedrooms, 1 full bathroom, approx 1172 square foot home in quiet location in park. Fresh exterior paint, larger primary bedroom with large closet and ensuite bathroom. Good sized bonus room, washer & dryer included. Nice backyard with deck and area to garden. Covered carport, big tool/garden shed, 55+ park.
Key facts
- Covered carport
- Bonus room
- Area to garden
Tags
Property features AI
Finance
- Other: Unit dimensions: 40' x 24'; Located on leased park land (lot rent/monthly)
- HOA & community: Monthly association fee covers water, sewer and trash; Association/lot rent paid monthly ($600)
Exterior
- Parking: Covered carport; Attached carport
- Utilities: Public water; Public sewer; Electricity
- Home design: Manufactured home in a park; Single-story (main living on one level); No notable view
- Construction: Built in 1979; Composition and membrane roofing; Taped interior finish
- Exterior features: Deck; Garden; Rain barrel/cistern; Tool shed; Lap siding; Paved road access; Leased land (park lot)
Interior
- Kitchen: Free-standing gas range; Free-standing refrigerator
- Bedrooms: Primary bedroom on main level with ensuite and closet; Second bedroom on main level with closet
- Flooring: Vinyl flooring; Wall-to-wall carpet
- Bathrooms: One full bathroom on the main level
- Heating & cooling: Forced air heating; Window unit(s) for cooling; Electric water heater
- Interior features: One-level accessibility; Laundry area with washer/dryer hookups; Vinyl flooring and wall-to-wall carpet; Vinyl window frames; Crawl space foundation
- Laundry & utility: Washer/Dryer (hookups included)
Neighborhood map
What this means for you Summary
Snapshot
- This is a 2-bed/2.0-bath manufactured listed at $65k.
Deal economics
- At list price, monthly cash flow is $54 ($648/yr) — positive.
- The deal already cash-flows at list — no discount required.
- Meets the 1% rule at list price ($1k rent vs $65k).
- Recommended offer: $64k (1.5% below list) — sets the bar for market timing.
- Cap rate 7.3% vs local median 2.7% in Creswell — top-decile yield for the area; either an underpriced asset or a hidden risk that comps aren't pricing in. Stress-test before assuming the spread holds.
Location & tenants
- Location reads 76/100 on livability (#80 in OR, #3,631 nationally) — a middle-class / working-renter tenant base. Strengths: employment A+, housing A+, health & safety A+; Watch: amenities D+, commute F.
- Creswell SD 40 (town): math 37% / reading 51% proficiency, ranked #78 of 183 in OR (top 43%) — families likely to look elsewhere, expect single-tenant / working-renter base with shorter leases.
- Zoned schools: Creslane Elementary School (math 15% / reading 34%, grade F, #309 of 412 statewide, top 77%, 509 students, 68% FRL); Creswell Middle School (math 22% / reading 47%, grade F, #61 of 128 statewide, top 54%, 265 students, 43% FRL); Creswell High School (360 students, 37% FRL) — zoned schools at 49% FRL track the district average.
- Zoned-school proficiency averages 30% at this address vs 44% district-wide (-14 pts) — the specific schools serving this property underperform the Creswell SD 40 average; the district grade overstates school quality for this exact location.
- Market conditions: 65 active listings in the ZIP; 5 comparable units currently listed for rent nearby; rentals lingering (median 44d on market — plan ~5-8 weeks vacancy on turnover, expect pricing pressure); 60% of comp listings sitting > 30 days — soft ceiling on asking rent; 1,808 units permitted in Lane County in 2024 (972 in 5+ unit buildings).
Forward outlook
- Local home prices are declining (-3.0%/yr); year-one equity from $450 of loan paydown is wiped out by about $2k of value loss. Plan a longer hold.
- Lane County population projected at +15% by 2050 — long-run rental-demand tailwind backs the buy-and-hold thesis.
Negotiation context
- It's been on market 17 days — a 2% lower offer ($64k) is reasonable based on typical stale-listing flexibility.
Risks & watch-outs
- Watch-outs: HOA is 45% of rent.
Questions for the listing agent
- Built in 1979 — when were the roof, HVAC, electrical panel, plumbing, and water heater last replaced?
- What does the HOA fee cover, when was the last increase, and are there any pending special assessments or reserve-fund shortfalls?
- Is there a deadline driving the sale (1031 exchange, divorce, estate, relocation)? That informs how much negotiation room exists.
- What's the average days-on-market for RENTAL listings here right now (not sales)? A rising rental-DOM trend means longer vacancies and softer asking-rent achievability than the comps imply.
- What's the recent tenant-quality profile in this submarket — average credit score on applications, eviction rate, late-payment / NSF rate, and stable-employment percentage? A property-management company in the area should have these aggregated.
- How much new for-sale + rental construction is in the pipeline within 1–3 miles? Heavy new supply typically softens prices + rents 12–24 months out; constrained supply supports both.
Investment metrics
- 1% rule
- 2.07% ✓
- Cap rate
- 7.29%
- Cash-on-cash
- 3.56%
- DSCR
- 1.16
- GRM
- 4.0
CMA / ARV
- ARV (on-the-fly)
- $91,200
- Comps found
- 6
Show comp detail 6 sales within ~0.75 mi
| Address | Dist | Beds/Ba | Sqft | Sold | Price | $/sf | Match |
|---|---|---|---|---|---|---|---|
| 400 N Mill St #1 | 0.00mi | 3/2.0 (+1) | 962 (+0%) | 8mo | $17,800 | $19 | 88 |
| 700 N Mill St #56 | 0.18mi | 3/2.0 (+1) | 950 (-1%) | 7mo | $90,000 | $95 | 79 |
| 700 N Mill St #21 | 0.18mi | 3/2.0 (+1) | 1,000 (+4%) | 1mo | $126,500 | $127 | 79 |
| 400 N Mill St | 0.00mi | 2/2.0 | 1,008 (+5%) | 22mo | $35,000 | $35 | 74 |
| 700 N Mill St #107 | 0.19mi | 2/1.0 | 840 (-12%) | 2mo | $63,900 | $76 | 64 |
| 700 N Mill St #75 | 0.18mi | 3/2.0 (+1) | 1,080 (+12%) | 9mo | $107,000 | $99 | 58 |
Match score weights: distance 35% · size 25% · config 20% · recency 20%. Top-matched comps best support the ARV.
Projected returns pro-forma
-3.0% appreciation · 3.0% rent growth · sell at horizon
- IRR
- -10.1%
- Equity multiple
- 0.63×
- Total profit
- $-6,724
- Equity at exit
- $9,684
- IRR
- 0.0%
- Equity multiple
- 1.00×
- Total profit
- $48
- Equity at exit
- $5,616
Cash invested: $18,186 (down + closing). Projections, not guarantees.
Landlord ↔ Tenant lean methodology
- Overall (STATE)
- 28 Tenant-Leaning
- State Oregon
- 28 Tenant-Leaning · D+6
- County
- — inherits STATE
- City
- — inherits STATE
ZIP-level market 97426
- Home prices YoY
- -29.1%
- Active inventory
- 65
- Price-to-rent
- 4.0×
Monthly cashflow live
- Estimated rent
- $1,343 high interval (Pro) →
- Mortgage (P&I)
- −$341
- Tax from tax record
- −$40 /mo · $476/yr
- Insurance
- −$27
- HOA
- −$600
- Vacancy / Maint / Mgmt
- −$282
- Net cashflow
- $54
Break-even live
UW: 25.0% down · 7.5% · 30yr · 1.5% tax · 5.0% vac · 8.0% maint · 8.0% mgmt
Financing live
Cash to close
- Down payment
- $16,238
- Closing costs
- $1,948
- Reserves months
- —
- Total cash needed
- —
Loan-product check · same deal, 3 products live
Conventional
25% down · 7.5% · 30yr
- Down + closing
- —
- Monthly P&I
- —
- Monthly cashflow
- —
- DSCR
- —
- Eligible?
- —
Personal DTI + credit; lowest rate.
DSCR
20% down · 8.5% · 30yr
- Down + closing
- —
- Monthly P&I
- —
- Monthly cashflow
- —
- DSCR
- —
- Eligible?
- —
No personal income docs; deal must DSCR.
Hard money
10% down · 12.0% · 12mo
- Down + closing
- —
- Monthly P&I
- —
- Monthly cashflow
- —
- DSCR
- —
- Eligible?
- —
Short-term bridge; refi at stabilization.
Rent comps 5 comps
| Address | Beds | Baths | Sqft | Rent | $/sqft | DOM | Units | Dist |
|---|---|---|---|---|---|---|---|---|
| 92 N 8th St Unit 97 Creswell, OR | 2.0 | 1.0 | 988 | $1,295 | $1.31 | 43d | 1 | 0.63mi |
| 101 N 10th St Apt 4 Creswell, OR | 2.0 | 1.0 | 950 | $1,295 | $1.36 | 43d | 1 | 0.73mi |
| 703 Kings Row Creswell, OR | 2.0 | 1.0 | 936 | $1,395 | $1.49 | 43d | 1 | 0.75mi |
| 703 Kings Row Creswell, OR | 2.0 | 1.0 | 936 | $1,395 | $1.49 | 13d | 1 | 0.75mi |
| 101 N 10th St Unit 15 Creswell, OR | 2.0 | 1.0 | 770 | $1,350 | $1.75 | 21d | 1 | 0.76mi |
HOA detail
- Monthly dues
- $600 · $7,200/yr
Listing history 2 events
-
2026-04-18status Pending
-
2026-04-01$64,950 Active
ⓘ Source: listings_history table (triggers on properties + properties_extension) + one-shot
backfill from property_details.listing_events for pre-trigger history.
Tax reassessment forecast OR · Resets to sale price
- Current annual tax
- $476 · $40/mo
- Projected year-2 tax
- $630 · $53/mo
- Expected delta
- +$154/yr (+$13/mo · 32.4%)
ⓘ Screening estimate from a state-policy table — verify with the county assessor before closing.
Climate risk First Street
- Flood 1/10 Low FEMA zone X (unshaded) · 0% chance over 30 yrs
- Wildfire 4/10 Moderate
- Heat 4/10 Moderate 7 d/yr ≥92°F today · 15 d/yr by 30 yrs out
- Wind 1/10 Low
- Air quality 10/10 Extreme 14 unhealthy d/yr today · 15 by 30 yrs out
Nearby sold comps map
Loading sold comps map…
Walkable amenities ~0.75 mi
Loading nearby amenities…
Taxation est. · year 1
- Rental income
- $16,121
- − Mortgage interest
- −$3,638
- − Property taxes
- −$476
- − Insurance
- −$325
- − Repairs & maintenance
- −$1,290
- − Management
- −$1,290
- − HOA
- −$7,200
- − Depreciation
- −$1,889
- Taxable income
- $13
- Est. tax owed @ 24.0%
- −$3
- After-tax cash flow
- $644/yr
For passive investors: Depreciation is non-cash, so a rental often shows a tax loss while cash-flowing — sheltering income. Rental losses are passive: they offset passive income freely, and up to $25,000/yr can offset ordinary (W-2) income if you actively participate and your MAGI is under $100k (phasing out to $0 by $150k); unused losses carry forward. On sale, claimed depreciation is recaptured at up to 25%, and gains may owe capital-gains tax (a 1031 exchange can defer both). Figures are a year-1 estimate at your 24.0% rate — not tax advice; consult a CPA.
Schools (NCES district)
- District
- Creswell SD 40
- NCES district ID
- 4103690
- Math proficiency
- 37% ▼ -6.00%
- Reading proficiency
- 51% ▼ -5.00%
- Median HH income
- $53,499
- Composite
- 40.38/100
- National rank
- #7748
- State rank
- #78 of 183 in OR
Livability — Creswell
- Score
- 76/100
- State rank
- #80
- US rank
- #3631
Category grades
Schools grade is shown separately in the Schools card above.
Census & demographics
- Census place
- Creswell, OR
- Population (ZIP)
- 10,384
Population outlook (Lane County) Hauer SSP2
- Today (2025)
- 391,933 people
- By 2030
- 405,860 · +3.6%
- By 2040
- 429,386 · +9.6%
- By 2050
- 452,016 · +15.3%
- By 2075
- 508,825 · +29.8%
- By 2100
- 531,208 · +35.5%
Race, ethnicity, and origin ACS 2023
- Neighborhood character
- Predominantly White (88%)
- Race & ethnicity
- White 88% Two or more races 8% Hispanic / Latino 3% Asian 1% Native American 1%
- Common ancestry
- Italian 6% Portuguese 3% Lithuanian 3%
- Foreign-born
- 1% · Canada
- Languages at home
- 97% English-only · Spanish 2%
Political lean MEDSL · Lane
- 2024 margin
- Strong D (+23.1) · D 60.0% · R 36.9% · Other 3.1%
- 2008→2024 swing
- -4.3pp toward R · 2008: 27.4pp · 2024: 23.1pp
- All cycles
- 2024: D+23.1 2020: D+24.3 2016: D+18.9 2012: D+23.4 2008: D+27.4
Not yet ingested
- Civics
- —
Market trends
- HPI YoY
- ▼ -127.51%
- Current HPI
- 311.4445
- Rent YoY
- —
- Metro
- —
- State GDP YoY
- ▲ 2.05%
- F500 in state
- 2
Industry mix (Fortune 500 HQ in OR)
| Industry | F500 HQs | Revenue |
|---|---|---|
| Consumer Goods | 1 | $51B |
|
||
Price history
2 events — show timeline
- 2026-04-18 Pending — RMLS
- 2026-04-01 Listed $64,950 RMLS
Property tax history
+3.3%/yrLatest (2025): $476 · +32.7% YoY. Source: county tax records.
Cash-flow waterfall
monthlySold comps — $/sqft
last 12 mo · ≤1 miLoading sold comps…