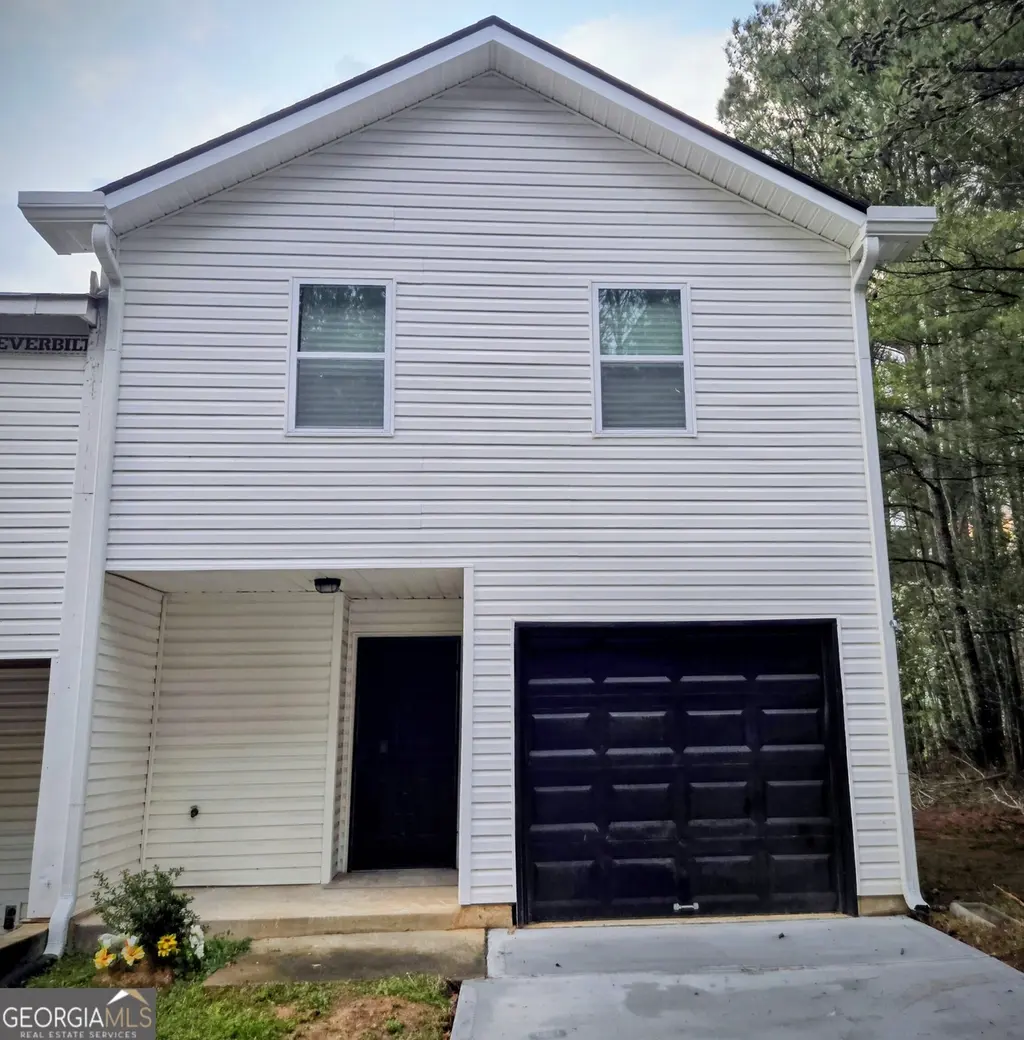
2113 Pine Tree Trl · South Fulton, GA
Flood risk 1/10 · Minimal
- FEMA flood zone
- X (unshaded)
- Chance of flooding over 30 yrs
- 0.0%
- Est. flood insurance / yr
- $507 – $1,088
Fire risk 3/10 · Minor
- Est. fire insurance / yr
- $963 – $1,789
Heat risk 6/10 · Moderate
- Hot days now (above 104°F)
- 7 days/yr
- Hot days in 30 yrs
- 18 days/yr
Wind risk 6/10 · Moderate
- Chance of severe wind over 30 yrs
- 27.0%
Air-quality risk 4/10 · Minor
- Unhealthy air days now
- 4 days/yr
- Unhealthy air days in 30 yrs
- 6 days/yr
Risk factors via First Street. Map © Google.
Why this score? — see what drove the C- grade
The composite is a weighted blend of 9 inputs, each scored 0–100. Each bar is that input's sub-score; the figure is the points it added to the 100-point composite (weight × sub-score).
- Cash flow +14.3/30.0
- Appreciation +10.0/10.0
- ARV discount +7.5/15.0
- 1% rule +5.8/10.0
- Schools +4.5/10.0
- DSCR +4.4/10.0
- Rent growth +2.7/5.0
- Livability +2.5/5.0
- Condition / age +2.5/5.0
$175,000
🖨 Deal sheet 📄 Offer letter ✓ Due diligence
Listing remarks
Renovated 3BR/2.5BA fee simple townhome in South Fulton! 1,466 sq ft corner unit at end of cul-de-sac with 1-car garage. New roof, HVAC, flooring, kitchen, baths & windows. Across from Creel Park with tennis, basketball, trails & playground. Bus stop at community entrance. $300/month HOA. No rental restrictions - investor friendly!
Key facts
- New kitchen
- New hvac
- New flooring
Tags
Property features AI
Finance
- Other: Conventional or cash offers accepted; Listing marketed with agent/seller relationship
- HOA & community: Association present; annual fee $3,600; HOA covers insurance, structure maintenance, and grounds maintenance; Community clubhouse; Near public transport; Within walking distance to schools
Exterior
- Parking: Garage; Attached garage; Off-street parking; Kitchen-level parking; Garage door opener
- Utilities: Public water; Public sewer; Electricity available; Natural gas available; High-speed internet available; Cable available; Sewer connected; Water available
- Home design: Residential condominium; Two levels; Updated/remodeled; Other structure type
- Construction: Built in 1990; Aluminum siding; Composition roof; Slab foundation
- Exterior features: Patio; Corner lot; Cul-de-sac; Level lot
Interior
- Kitchen: Trash compactor
- Bedrooms: 3 bedrooms
- Flooring: Carpet; Laminate
- Bathrooms: 2 full bathrooms; 1 half bathroom
- Heating & cooling: Central heating; Central air conditioning
- Interior features: Tile bathrooms; Walk-in closet(s); Dining room and living room combo; Family room
- Laundry & utility: Laundry in hall on upper level
Neighborhood map
What this means for you Summary
Snapshot
- This is a 3-bed/2.5-bath condo listed at $175k.
Deal economics
- At list price, monthly cash flow is $33 ($392/yr) — positive.
- The deal already cash-flows at list — no discount required.
- Meets the 1% rule at list price ($2k rent vs $175k).
- Recommended offer: $159k (9.0% below list) — sets the bar for market timing.
- Cap rate 6.5% vs local median 4.6% in South Fulton — top-decile yield for the area; either an underpriced asset or a hidden risk that comps aren't pricing in. Stress-test before assuming the spread holds.
Location & tenants
- Location reads: area grade C — affects rentability + tenant quality, not the cash-flow math above.
- Fulton County (suburban): math 49% / reading 53% proficiency, ranked #12 of 174 in GA (top 7%) — acceptable for families but not a draw, mixed tenant base, ~2y average lease.
- Zoned schools: Nolan Elementary School (math 24% / reading 22%, grade F, #796 of 1,228 statewide, top 65%, 710 students, 100% FRL) — zoned schools average 100% FRL vs 41% district-wide (59 pts higher); higher-poverty schools than district average — tighter screening recommended.
- Zoned-school proficiency averages 23% at this address vs 51% district-wide (-28 pts) — the specific schools serving this property underperform the Fulton County average; the district grade overstates school quality for this exact location.
- Market conditions: Rents flat; 651 active listings in the ZIP; 40 comparable units currently listed for rent nearby; rentals at typical pace (median 24d on market — plan ~3-4 weeks tenant-placement turnaround); 11,565 units permitted in Fulton County in 2024 (8,159 in 5+ unit buildings).
Forward outlook
- In year one you build about $19k of equity ($1k loan paydown + $18k appreciation (10.0% local appreciation)).
- Fulton County population projected at +38% by 2050 — long-run rental-demand tailwind backs the buy-and-hold thesis.
- At projected returns (10.0% appreciation + 0.9% rent growth), your $49k cash investment doubles in ~3 years — after that, you're playing with house money.
- By year 2, paydown + projected appreciation supports a ~$30k cash-out refi (75% LTV) — recoverable capital for the next deal without selling this one.
Negotiation context
- It's been on market 94 days — a 9% lower offer ($159k) is reasonable based on typical stale-listing flexibility.
- 6 sale attempts since 4y ago with the ask held roughly flat each time — persistent listings suggest the price (not the market) is what's stuck; bring a comps-based counter.
Risks & watch-outs
- Climate carrying-cost: major wind risk, 27% chance of damaging wind over 30y; extreme-heat days projected 7→18/yr by 2055 (HVAC capex compounding) — expect insurance premiums to compound above CPI over the hold.
Questions for the listing agent
- It's been on market 94 days. Have you received any prior offers? Is the seller open to a 9% concession, seller financing, or rate buy-down credit?
- What does the HOA fee cover, when was the last increase, and are there any pending special assessments or reserve-fund shortfalls?
- Any open or pending special assessments — roof, HVAC, plumbing, elevator, façade? What's the per-unit balance and payoff schedule, and is the seller paying it off at close or rolling it to the buyer?
- Why hasn't it sold? Are there any deal-killer items the seller is aware of (foundation, flood, title, zoning, code violations)?
- Is there a deadline driving the sale (1031 exchange, divorce, estate, relocation)? That informs how much negotiation room exists.
- What's the average days-on-market for RENTAL listings here right now (not sales)? A rising rental-DOM trend means longer vacancies and softer asking-rent achievability than the comps imply.
- What's the recent tenant-quality profile in this submarket — average credit score on applications, eviction rate, late-payment / NSF rate, and stable-employment percentage? A property-management company in the area should have these aggregated.
- How much new apartment / multifamily construction is in the pipeline within 1–3 miles? Heavy new supply (>2% of stock underway) typically softens rents 12–24 months out; light construction supports rent growth.
Investment metrics
- 1% rule
- 1.08% ✓
- Cap rate
- 6.52%
- Cash-on-cash
- 0.80%
- DSCR
- 1.04
- GRM
- 7.7
CMA / ARV
No comps found within radius.
Projected returns pro-forma
10.0% appreciation · 0.95% rent growth · sell at horizon
- IRR
- 24.1%
- Equity multiple
- 2.91×
- Total profit
- $93,755
- Equity at exit
- $157,654
- IRR
- 20.8%
- Equity multiple
- 6.46×
- Total profit
- $267,701
- Equity at exit
- $339,987
Cash invested: $49,000 (down + closing). Projections, not guarantees.
Landlord ↔ Tenant lean methodology
- Overall (STATE)
- 90 Strongly Landlord-Friendly
- State Georgia
- 90 Strongly Landlord-Friendly · R+3
- County
- — inherits STATE
- City
- — inherits STATE
ZIP-level market 30349
- Home prices YoY
- 4.6%
- Rents YoY
- 0.9%
- Active inventory
- 651
- Price-to-rent
- 7.7×
Monthly cashflow live
- Estimated rent
- $1,889 high interval (Pro) →
- Mortgage (P&I)
- −$918
- Tax from tax record
- −$169 /mo · $2,031/yr
- Insurance
- −$73
- HOA
- −$300
- Vacancy / Maint / Mgmt
- −$397
- Net cashflow
- $33
Break-even live
UW: 25.0% down · 7.5% · 30yr · 1.5% tax · 5.0% vac · 8.0% maint · 8.0% mgmt
Financing live
Cash to close
- Down payment
- $43,750
- Closing costs
- $5,250
- Reserves months
- —
- Total cash needed
- —
Loan-product check · same deal, 3 products live
Conventional
25% down · 7.5% · 30yr
- Down + closing
- —
- Monthly P&I
- —
- Monthly cashflow
- —
- DSCR
- —
- Eligible?
- —
Personal DTI + credit; lowest rate.
DSCR
20% down · 8.5% · 30yr
- Down + closing
- —
- Monthly P&I
- —
- Monthly cashflow
- —
- DSCR
- —
- Eligible?
- —
No personal income docs; deal must DSCR.
Hard money
10% down · 12.0% · 12mo
- Down + closing
- —
- Monthly P&I
- —
- Monthly cashflow
- —
- DSCR
- —
- Eligible?
- —
Short-term bridge; refi at stabilization.
Rent comps 40 comps
| Address | Beds | Baths | Sqft | Rent | $/sqft | DOM | Units | Dist |
|---|---|---|---|---|---|---|---|---|
| 3206 Pine Tree Trl Unit 15C Atlanta, GA | 3.0 | 2.5 | 1466 | $1,950 | $1.33 | 4d | 1 | 0.07mi |
| 2550 Hallie Mill Rd Atlanta, GA | 3.0 | 2.0 | 1372 | $1,600 | $1.17 | 12d | 1 | 0.25mi |
| 110 Fruitwood Trce Unit A Riverdale, GA | 3.0 | 2.0 | 1100 | $1,800 | $1.64 | 20d | 1 | 0.29mi |
| 7060 Kimberly Mill Rd Atlanta, GA | 3.0 | 1.0 | 1056 | $1,425 | $1.35 | 5d | 1 | 0.36mi |
| 7025 Brentwood Ct Riverdale, GA | 2.0 | 1.5 | 1124 | $1,425 | $1.27 | 43d | 1 | 0.37mi |
| 2529 Wood Bend Ln Riverdale, GA | 3.0 | 2.5 | 1508 | $1,945 | $1.29 | 43d | 1 | 0.37mi |
| 2590 South Hills Riverdale, GA | 3.0 | 2.5 | 1850 | $2,005 | $1.08 | 12d | 1 | 0.39mi |
| 2722 South Hills Riverdale, GA | 3.0 | 2.5 | 1722 | $2,200 | $1.28 | 5d | 1 | 0.40mi |
| 145 W Village Ct Riverdale, GA | 3.0 | 2.5 | 1284 | $1,865 | $1.45 | 5d | 1 | 0.41mi |
| 2820 Greenbower Ct Atlanta, GA | 3.0 | 2.0 | 1338 | $1,730 | $1.29 | 3d | 1 | 0.52mi |
| 7045 Birling Dr Atlanta, GA | 4.0 | 3.0 | 1488 | $1,765 | $1.19 | 43d | 1 | 0.53mi |
| 2405 Wood Bend Ln Riverdale, GA | 3.0 | 2.5 | 1396 | $1,800 | $1.29 | 43d | 1 | 0.56mi |
| 6450 Peppermill Ln Atlanta, GA | 4.0 | 2.0 | 1188 | $1,531 | $1.29 | 24d | 1 | 0.89mi |
| 3105 Garnet Way Atlanta, GA | 3.0 | 2.0 | 1470 | $1,660 | $1.13 | 12d | 1 | 1.01mi |
| 2667 Rocky Ct Atlanta, GA | 3.0 | 2.5 | 1432 | $2,200 | $1.54 | 43d | 1 | 1.06mi |
| 3500 Keels Ln Atlanta, GA | 3.0 | 2.0 | 1272 | $1,755 | $1.38 | 1d | 1 | 1.07mi |
| 6345 Peppermill Ln Atlanta, GA | 3.0 | 2.5 | 1224 | $1,800 | $1.47 | 43d | 1 | 1.08mi |
| 2592 Rocky Ct Atlanta, GA | 2.0 | 2.5 | 1424 | $2,000 | $1.40 | 43d | 1 | 1.09mi |
| 2373 Bigwood Trl Atlanta, GA | 3.0 | 2.5 | 1566 | $1,845 | $1.18 | 24d | 1 | 1.11mi |
| 6575 Smoke Ridge Dr Atlanta, GA | 4.0 | 2.0 | 1808 | $1,815 | $1.00 | 43d | 1 | 1.13mi |
| 2184 Olmadison Vw Atlanta, GA | 2.0 | 2.0 | 1236 | $1,985 | $1.61 | 18d | 1 | 1.13mi |
| 2285 Bigwood Trl Atlanta, GA | 3.0 | 2.5 | 1580 | $1,740 | $1.10 | 1d | 1 | 1.14mi |
| 6500 Connell Rd Atlanta, GA | 3.0 | 2.0 | 1483 | $1,650 | $1.11 | 24d | 1 | 1.16mi |
| 855 Old Rocky Rd Atlanta, GA | 3.0 | 2.0 | 1310 | $1,710 | $1.31 | 24d | 1 | 1.17mi |
| 2310 Bigwood Trl Atlanta, GA | 3.0 | 2.5 | 1580 | $2,600 | $1.65 | 24d | 1 | 1.18mi |
| 6368 Olmadison Pl Atlanta, GA | 3.0 | 2.5 | 1428 | $1,656 | $1.16 | 11d | 1 | 1.20mi |
| 6370 Olmadison Pl Atlanta, GA | 3.0 | 2.5 | 1440 | $1,795 | $1.25 | 43d | 1 | 1.20mi |
| 6278 Rockaway Rd Atlanta, GA | 3.0 | 2.5 | 1524 | $2,000 | $1.31 | 43d | 1 | 1.22mi |
| 6440 Connell Rd Atlanta, GA | 3.0 | 2.0 | 1391 | $1,695 | $1.22 | 24d | 1 | 1.23mi |
| 6445 Connell Rd Atlanta, GA | 3.0 | 2.0 | 1357 | $1,856 | $1.37 | 43d | 1 | 1.25mi |
| 6560 Emerald Pointe Cir Atlanta, GA | 3.0 | 2.0 | 1309 | $1,500 | $1.15 | 22d | 1 | 1.27mi |
| 325 Pointer Ct Atlanta, GA | 3.0 | 2.0 | 1474 | $1,620 | $1.10 | 5d | 1 | 1.28mi |
| 7495 Royale Ct Riverdale, GA | 4.0 | 3.0 | 1284 | $2,150 | $1.67 | 1d | 1 | 1.32mi |
| 6684 Judy Ln Riverdale, GA | 3.0 | 2.0 | 1356 | $1,705 | $1.26 | 43d | 1 | 1.35mi |
| 2560 Foxlair Trl Atlanta, GA | 4.0 | 2.0 | 1485 | $1,795 | $1.21 | 24d | 1 | 1.38mi |
| 1973 Bethsaida Rd Riverdale, GA | 2.0 | 2.0 | 1000 | $2,650 | $2.65 | 1d | 1 | 1.38mi |
| 3800 Leisure Ln Atlanta, GA | 3.0 | 2.0 | 1198 | $2,350 | $1.96 | 22d | 1 | 1.39mi |
| 6090 Emerald Pointe Cir Atlanta, GA | 3.0 | 2.0 | 1200 | $1,875 | $1.56 | 18d | 1 | 1.39mi |
| 320 Emerald Green Ct Atlanta, GA | 3.0 | 2.0 | 1575 | $2,050 | $1.30 | 43d | 1 | 1.40mi |
| 7301 Fern Ct Riverdale, GA | 3.0 | 3.0 | 1325 | $1,909 | $1.44 | 4d | 1 | 1.41mi |
HOA detail condo
- Monthly dues
- $300 · $3,600/yr
- Assessments
- None detected in remarks — confirm with the listing agent.
Listing history 32 events
-
2026-06-18days on market $175,000 Active 94 DOM
-
2026-06-17days on market $175,000 Active 93 DOM
-
2026-06-16days on market $175,000 Active 92 DOM
-
2026-06-15days on market $175,000 Active 91 DOM
-
2026-06-13days on market $175,000 Active 89 DOM
-
2026-06-09days on market $175,000 Active 85 DOM
-
2026-06-08days on market $175,000 Active 84 DOM
-
2026-06-07days on market $175,000 Active 83 DOM
-
2026-06-04days on market $175,000 Active 80 DOM
-
2026-06-03days on market $175,000 Active 79 DOM
-
2026-06-01days on market $175,000 Active 77 DOM
-
2026-05-31days on market $175,000 Active 76 DOM
-
2026-05-18status Back On Market
-
2026-04-24status Under Contract
-
2026-02-19$175,000 New
-
2025-08-14historical
-
2025-06-12price $160,000
-
2025-03-13$175,000 Active
-
2025-03-12historical
-
2025-01-31historical
-
2024-09-21$195,000 Active
-
2022-12-20soldstatus $175,000
-
2022-06-03soldstatus $75,000
-
2022-05-31soldstatus $75,000 Closed
-
2022-05-31soldstatus $75,000 Sold
-
2022-05-10historical Active Under Contract
-
2022-05-09status Under Contract
-
2022-04-21price $54,900
-
2022-04-08$59,900 Active
-
2022-04-08$59,900 New
-
2002-10-15soldstatus $70,000
-
1990-07-24soldstatus $31,300
ⓘ Source: listings_history table (triggers on properties + properties_extension) + one-shot
backfill from property_details.listing_events for pre-trigger history.
Tax reassessment forecast GA · Resets to sale price
- Current annual tax
- $2,031 · $169/mo
- Projected year-2 tax
- $2,031 · $169/mo
- Expected delta
- $0/yr ($0/mo · 0.0%)
ⓘ Screening estimate from a state-policy table — verify with the county assessor before closing.
Climate risk First Street
- Flood 1/10 Low FEMA zone X (unshaded) · 0% chance over 30 yrs
- Wildfire 3/10 Moderate
- Heat 6/10 Major 7 d/yr ≥104°F today · 18 d/yr by 30 yrs out
- Wind 6/10 Major 27% chance of damaging wind over 30 yrs
- Air quality 4/10 Moderate 4 unhealthy d/yr today · 6 by 30 yrs out
Nearby sold comps map
Loading sold comps map…
Walkable amenities ~0.75 mi
Loading nearby amenities…
Taxation est. · year 1
- Rental income
- $22,672
- − Mortgage interest
- −$9,803
- − Property taxes
- −$2,031
- − Insurance
- −$875
- − Repairs & maintenance
- −$1,814
- − Management
- −$1,814
- − HOA
- −$3,600
- − Depreciation
- −$5,091
- Taxable loss
- −$2,355
- Est. tax savings @ 24.0%
- +$565
- After-tax cash flow
- $958/yr
For passive investors: Depreciation is non-cash, so a rental often shows a tax loss while cash-flowing — sheltering income. Rental losses are passive: they offset passive income freely, and up to $25,000/yr can offset ordinary (W-2) income if you actively participate and your MAGI is under $100k (phasing out to $0 by $150k); unused losses carry forward. On sale, claimed depreciation is recaptured at up to 25%, and gains may owe capital-gains tax (a 1031 exchange can defer both). Figures are a year-1 estimate at your 24.0% rate — not tax advice; consult a CPA.
Schools (NCES district)
- District
- Fulton County
- NCES district ID
- 1302280
- Math proficiency
- 49% ▼ -2.00%
- Reading proficiency
- 53% ▬ 0.00%
- Median HH income
- $68,035
- Composite
- 45.33/100
- National rank
- #2640
- State rank
- #12 of 174 in GA
Livability — South Fulton
No livability data for this city. (Only ~50 U.S. cities are tracked.)
Census & demographics
- Census place
- South Fulton, GA
- County
- Fulton County · 1,094,430 people
- City population
- 127,674
- Metro
- Atlanta-Sandy Springs-Alpharetta, GA
- Population (ZIP)
- 79,872
- Household income
- $67,023
- Rent vs Own
- Severe rent burden
- 4258.0
Population outlook (Fulton County) Hauer SSP2
- Today (2025)
- 1,203,707 people
- By 2030
- 1,299,706 · +8.0%
- By 2040
- 1,488,256 · +23.6%
- By 2050
- 1,664,580 · +38.3%
- By 2075
- 2,036,072 · +69.2%
- By 2100
- 2,222,402 · +84.6%
Race, ethnicity, and origin ACS 2023
- Neighborhood character
- Predominantly Black (89%)
- Race & ethnicity
- Black 89% Hispanic / Latino 5% Two or more races 4% White 3%
- Foreign-born
- 9% · Canada
- Languages at home
- 88% English-only · Spanish 6% French/Haitian/Cajun 1%
Political lean MEDSL · Fulton
- 2024 margin
- Solid D (+44.9) · D 71.9% · R 27.0% · Other 1.1%
- 2008→2024 swing
- +9.8pp toward D · 2008: 35.0pp · 2024: 44.9pp
- All cycles
- 2024: D+44.9 2020: D+46.4 2016: D+42.1 2012: D+29.6 2008: D+35.0
Not yet ingested
- Civics
- —
Market trends
- HPI YoY
- ▲ 18.01%
- Current HPI
- 407.99
- Rent YoY
- ▲ 0.95%
- Metro
- Atlanta-Sandy Springs-Alpharetta, GA
- State GDP YoY
- ▲ 2.66%
- F500 in state
- 28
Industry mix (Fortune 500 HQ in GA)
| Industry | F500 HQs | Revenue |
|---|---|---|
| Paper / Packaging | 2 | $29B |
|
||
| Retail | 1 | $160B |
|
||
| Transportation / Logistics | 1 | $91B |
|
||
| Airlines | 1 | $62B |
|
||
| Consumer Goods | 1 | $47B |
|
||
| Utilities | 1 | $25B |
|
||
Price history
+459.1% since first listed20 events — show timeline
- 2026-05-18 Relisted — GAMLS
- 2026-04-24 Pending — GAMLS
- 2026-02-19 Listed $175,000 GAMLS
- 2025-08-14 Listing Removed — FMLS
- 2025-06-12 Price Changed $160,000 FMLS
- 2025-03-13 Listed $175,000 FMLS
- 2025-03-12 Coming Soon — FMLS
- 2025-01-31 Listing Removed — FMLS
- 2024-09-21 Listed $195,000 FMLS
- 2022-12-20 Sold (Public Records) $175,000 Public Records
- 2022-06-03 Sold (Public Records) $75,000 Public Records
- 2022-05-31 Sold (MLS) $75,000 GAMLS
- 2022-05-31 Sold (MLS) $75,000 FMLS
- 2022-05-10 Contingent — FMLS
- 2022-05-09 Pending — GAMLS
- 2022-04-21 Price Changed $54,900 GAMLS
- 2022-04-08 Listed $59,900 GAMLS
- 2022-04-08 Listed $59,900 FMLS
- 2002-10-15 Sold (Public Records) $70,000 Public Records
- 1990-07-24 Sold (Public Records) $31,300 Public Records
Property tax history
+8.8%/yrLatest (2025): $2,031 · -6.1% YoY. Source: county tax records.
Cash-flow waterfall
monthlySold comps — $/sqft
last 12 mo · ≤1 miLoading sold comps…