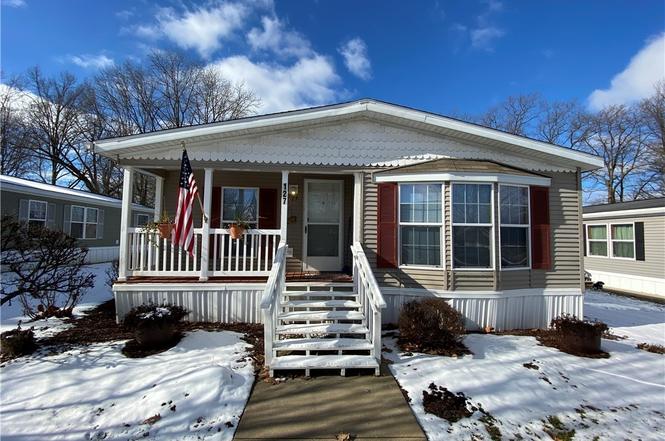
5852 Cleveland Rd #127 · Wooster, OH
Flood risk No data
- FEMA flood zone
- —
- Chance of flooding over 30 yrs
- —
- Est. flood insurance / yr
- —
Fire risk No data
- Est. fire insurance / yr
- —
Heat risk No data
- Hot days now (above threshold)
- —
- Hot days in 30 yrs
- —
Wind risk No data
- Chance of severe wind over 30 yrs
- —
Air-quality risk No data
- Unhealthy air days now
- —
- Unhealthy air days in 30 yrs
- —
Risk factors via First Street. Map © Google.
Why this score? — see what drove the A- grade
The composite is a weighted blend of 9 inputs, each scored 0–100. Each bar is that input's sub-score; the figure is the points it added to the 100-point composite (weight × sub-score).
- Cash flow +30.0/30.0
- ARV discount +15.0/15.0
- 1% rule +10.0/10.0
- DSCR +10.0/10.0
- Rent growth +4.6/5.0
- Schools +4.4/10.0
- Livability +3.9/5.0
- Condition / age +2.5/5.0
- Appreciation +0.0/10.0
$85,000
🖨 Deal sheet 📄 Offer letter ✓ Due diligence
Listing remarks MLS
Large, well maintained double wide mobile home in the 55+ community of Spruce Tree in the north end of Wooster. 3 bedrooms, 2 full bathrooms. Newer carpeting throughout. Handicap accessible master bathroom shower. Appliances remain, including washer and dryer. Front porch, side deck, carport, alley access, and a cute storage shed are some of the exterior features. This little street is a very desirable location, don't wait!
Key facts
- Spacious kitchen
- Extra storage shed
- 2 parking spots
Tags
Neighborhood map
What this means for you Summary
Snapshot
- This is a 3-bed/2.0-bath single-family listed at $85k.
Deal economics
- At list price, monthly cash flow is $628 ($8k/yr) — positive.
- The deal already cash-flows at list — no discount required.
- Meets the 1% rule at list price ($2k rent vs $85k).
- Cap rate 15.2% vs local median 3.2% in Wooster — top-decile yield for the area; either an underpriced asset or a hidden risk that comps aren't pricing in. Stress-test before assuming the spread holds.
Location & tenants
- Location reads 77/100 on livability (#195 in OH, #3,001 nationally) — a middle-class / working-renter tenant base. Strengths: cost of living A+, housing A+, health & safety A+; Watch: employment D+, amenities D-, commute F.
- Wooster City (town): math 47% / reading 57% proficiency, ranked #422 of 656 in OH (top 64%) — acceptable for families but not a draw, mixed tenant base, ~2y average lease.
- Market conditions: Rents rising fast (+8.4%/yr); 154 active listings in the ZIP; 1 comparable units currently listed for rent nearby; 284 units permitted in Wayne County in 2024 (42 in 5+ unit buildings).
Forward outlook
- Local home prices are declining (-3.0%/yr); year-one equity from $588 of loan paydown is wiped out by about $3k of value loss. Plan a longer hold.
- Wayne County population projected to shrink 6% by 2050 — rents likely to lag national; underwrite the cash flow, not the appreciation.
- At projected returns (-3.0% appreciation + 8.0% rent growth), your $24k cash investment doubles in ~4 years — after that, you're playing with house money.
Negotiation context
- Only 1 days on market — expect competitive offers; lowballing is unlikely to land.
- 4 sale attempts since 13y ago with the ask held roughly flat each time — persistent listings suggest the price (not the market) is what's stuck; bring a comps-based counter.
- Current owner paid $53k; list at $85k implies a 60% gain — meaningful room to come down on a strong offer.
Questions for the listing agent
- Is there a deadline driving the sale (1031 exchange, divorce, estate, relocation)? That informs how much negotiation room exists.
- Schools are B-rated — typically a magnet for longer-tenancy family renters. What's the average tenant stay here, and is there a school-zone premium baked into asking?
- What's the average days-on-market for RENTAL listings here right now (not sales)? A rising rental-DOM trend means longer vacancies and softer asking-rent achievability than the comps imply.
- What's the recent tenant-quality profile in this submarket — average credit score on applications, eviction rate, late-payment / NSF rate, and stable-employment percentage? A property-management company in the area should have these aggregated.
- How much new for-sale + rental construction is in the pipeline within 1–3 miles? Heavy new supply typically softens prices + rents 12–24 months out; constrained supply supports both.
Investment metrics
- 1% rule
- 1.81% ✓
- Cap rate
- 15.16%
- Cash-on-cash
- 31.66%
- DSCR
- 2.41
- GRM
- 4.6
CMA / ARV
- ARV (on-the-fly)
- $163,326
- Comps found
- 2
Show comp detail 2 sales within ~0.75 mi
| Address | Dist | Beds/Ba | Sqft | Sold | Price | $/sf | Match |
|---|---|---|---|---|---|---|---|
| 2330 Schellin Rd | 0.62mi | 3/1.5 | 1,120 (+12%) | 8mo | $159,900 | $143 | 42 |
| 4910 Cleveland Rd | 0.72mi | 2/1.0 (-1) | 918 (-8%) | 21mo | $150,000 | $163 | 26 |
Match score weights: distance 35% · size 25% · config 20% · recency 20%. Top-matched comps best support the ARV.
Projected returns pro-forma
-3.0% appreciation · 8.0% rent growth · sell at horizon
- IRR
- 32.1%
- Equity multiple
- 2.44×
- Total profit
- $34,371
- Equity at exit
- $12,674
- IRR
- 41.9%
- Equity multiple
- 5.98×
- Total profit
- $118,522
- Equity at exit
- $7,349
Cash invested: $23,800 (down + closing). Projections, not guarantees.
Landlord ↔ Tenant lean methodology
- Overall (STATE)
- 73 Landlord-Friendly
- State Ohio
- 73 Landlord-Friendly · R+6
- County
- — inherits STATE
- City
- — inherits STATE
ZIP-level market 44691
- Rents YoY
- 8.4%
- Active inventory
- 154
- Price-to-rent
- 4.6×
Monthly cashflow live
- Estimated rent
- $1,538 medium interval (Pro) →
- Mortgage (P&I)
- −$446
- Tax est. 1.5%
- −$106 /mo · $1,275/yr
- Insurance
- −$35
- HOA
- −$0
- Vacancy / Maint / Mgmt
- −$323
- Net cashflow
- $628
Break-even live
UW: 25.0% down · 7.5% · 30yr · 1.5% tax · 5.0% vac · 8.0% maint · 8.0% mgmt
Financing live
Cash to close
- Down payment
- $21,250
- Closing costs
- $2,550
- Reserves months
- —
- Total cash needed
- —
Loan-product check · same deal, 3 products live
Conventional
25% down · 7.5% · 30yr
- Down + closing
- —
- Monthly P&I
- —
- Monthly cashflow
- —
- DSCR
- —
- Eligible?
- —
Personal DTI + credit; lowest rate.
DSCR
20% down · 8.5% · 30yr
- Down + closing
- —
- Monthly P&I
- —
- Monthly cashflow
- —
- DSCR
- —
- Eligible?
- —
No personal income docs; deal must DSCR.
Hard money
10% down · 12.0% · 12mo
- Down + closing
- —
- Monthly P&I
- —
- Monthly cashflow
- —
- DSCR
- —
- Eligible?
- —
Short-term bridge; refi at stabilization.
Rent comps 1 comps
| Address | Beds | Baths | Sqft | Rent | $/sqft | DOM | Units | Dist |
|---|---|---|---|---|---|---|---|---|
| 4715 Young Dr Wooster, OH | 2.0 | 2.0 | 1000 | $1,550 | $1.55 | 43d | 1 | 0.86mi |
Listing history 3 events
-
2026-06-17status $85,000 Pending 1 DOM
-
2026-06-16remarks 695-char remark
-
2026-06-16$85,000 Active 1 DOM
ⓘ Source: listings_history table (triggers on properties + properties_extension) + one-shot
backfill from property_details.listing_events for pre-trigger history.
Nearby sold comps map
Loading sold comps map…
Walkable amenities ~0.75 mi
Loading nearby amenities…
Taxation est. · year 1
- Rental income
- $18,461
- − Mortgage interest
- −$4,761
- − Property taxes
- −$1,275
- − Insurance
- −$425
- − Repairs & maintenance
- −$1,477
- − Management
- −$1,477
- − Depreciation
- −$2,473
- Taxable income
- $6,573
- Est. tax owed @ 24.0%
- −$1,577
- After-tax cash flow
- $5,957/yr
For passive investors: Depreciation is non-cash, so a rental often shows a tax loss while cash-flowing — sheltering income. Rental losses are passive: they offset passive income freely, and up to $25,000/yr can offset ordinary (W-2) income if you actively participate and your MAGI is under $100k (phasing out to $0 by $150k); unused losses carry forward. On sale, claimed depreciation is recaptured at up to 25%, and gains may owe capital-gains tax (a 1031 exchange can defer both). Figures are a year-1 estimate at your 24.0% rate — not tax advice; consult a CPA.
Schools (NCES district)
- District
- Wooster City
- NCES district ID
- 3910032
- Math proficiency
- 47% ▼ -24.00%
- Reading proficiency
- 57% ▼ -11.00%
- Median HH income
- $43,805
- Composite
- 43.82/100
- National rank
- #2928
- State rank
- #422 of 656 in OH
Livability — Wooster
- Score
- 77/100
- State rank
- #195
- US rank
- #3001
Category grades
Schools grade is shown separately in the Schools card above.
Census & demographics
- County
- Wayne County · 44,344 people
- City population
- 44,344
- Metro
- Wooster, OH
- Population (ZIP)
- 44,344
- Household income
- $69,920
- Rent vs Own
- Severe rent burden
- 844.0
Population outlook (Wayne County) Hauer SSP2
- Today (2025)
- 116,616 people
- By 2030
- 116,214 · -0.3%
- By 2040
- 113,891 · -2.3%
- By 2050
- 109,009 · -6.5%
- By 2075
- 94,622 · -18.9%
- By 2100
- 70,577 · -39.5%
Race, ethnicity, and origin ACS 2023
- Neighborhood character
- Predominantly White (90%)
- Race & ethnicity
- White 90% Two or more races 5% Hispanic / Latino 2% Black 2% Asian 1%
- Common ancestry
- Romanian 3% Slovak 3% Lithuanian 2%
- Foreign-born
- 4% · Canada
- Languages at home
- 92% English-only · German/W. Germanic 3% Spanish 1% Other Indo-European 1%
Political lean MEDSL · Wayne
- 2024 margin
- Solid R (+39.3) · D 29.9% · R 69.2%
- 2008→2024 swing
- -24.6pp toward R · 2008: -14.6pp · 2024: -39.3pp
- All cycles
- 2024: R+39.3 2020: R+37.0 2016: R+34.9 2012: R+21.3 2008: R+14.6
Not yet ingested
- Civics
- —
Market trends
- HPI YoY
- ▼ -174.13%
- Current HPI
- 231.7627
- Rent YoY
- ▲ 8.42%
- Metro
- Wooster, OH
- State GDP YoY
- ▲ 1.98%
- F500 in state
- 48
Industry mix (Fortune 500 HQ in OH)
| Industry | F500 HQs | Revenue |
|---|---|---|
| Insurance | 3 | $145B |
|
||
| Industrial Machinery | 3 | $49B |
|
||
| Financial Services | 3 | $24B |
|
||
| Consumer Goods | 2 | $93B |
|
||
| Aerospace / Defense | 2 | $47B |
|
||
| Utilities | 2 | $33B |
|
||
Price history
+54.8% since first listed10 events — show timeline
- 2026-06-13 Listed $85,000 MLSNOW
- 2021-02-10 Sold (MLS) $53,000 MLSNOW
- 2021-02-03 Pending — MLSNOW
- 2021-01-25 Listed $55,900 MLSNOW
- 2018-04-30 Sold (MLS) $50,000 MLSNOW
- 2018-04-11 Pending — MLSNOW
- 2018-03-05 Contingent — MLSNOW
- 2018-01-26 Listed $55,000 MLSNOW
- 2013-09-25 Sold (MLS) $50,900 MLSNOW
- 2013-08-12 Listed $54,900 MLSNOW
Cash-flow waterfall
monthlySold comps — $/sqft
last 12 mo · ≤1 miLoading sold comps…