6421 Borasco Dr · Viera West, FL
Flood risk No data
- FEMA flood zone
- —
- Chance of flooding over 30 yrs
- —
- Est. flood insurance / yr
- —
Fire risk No data
- Est. fire insurance / yr
- —
Heat risk No data
- Hot days now (above threshold)
- —
- Hot days in 30 yrs
- —
Wind risk No data
- Chance of severe wind over 30 yrs
- —
Air-quality risk No data
- Unhealthy air days now
- —
- Unhealthy air days in 30 yrs
- —
Risk factors via First Street. Map © Google.
Why this score? — see what drove the F grade
The composite is a weighted blend of 9 inputs, each scored 0–100. Each bar is that input's sub-score; the figure is the points it added to the 100-point composite (weight × sub-score).
- ARV discount +7.5/15.0
- Appreciation +5.2/10.0
- Schools +4.7/10.0
- Condition / age +4.0/5.0
- Livability +3.5/5.0
- 1% rule +3.0/10.0
- Rent growth +3.0/5.0
- Cash flow +2.6/30.0
- DSCR +0.0/10.0
$249,900
🖨 Deal sheet (PDF) 📄 Offer letter ✓ Due diligence
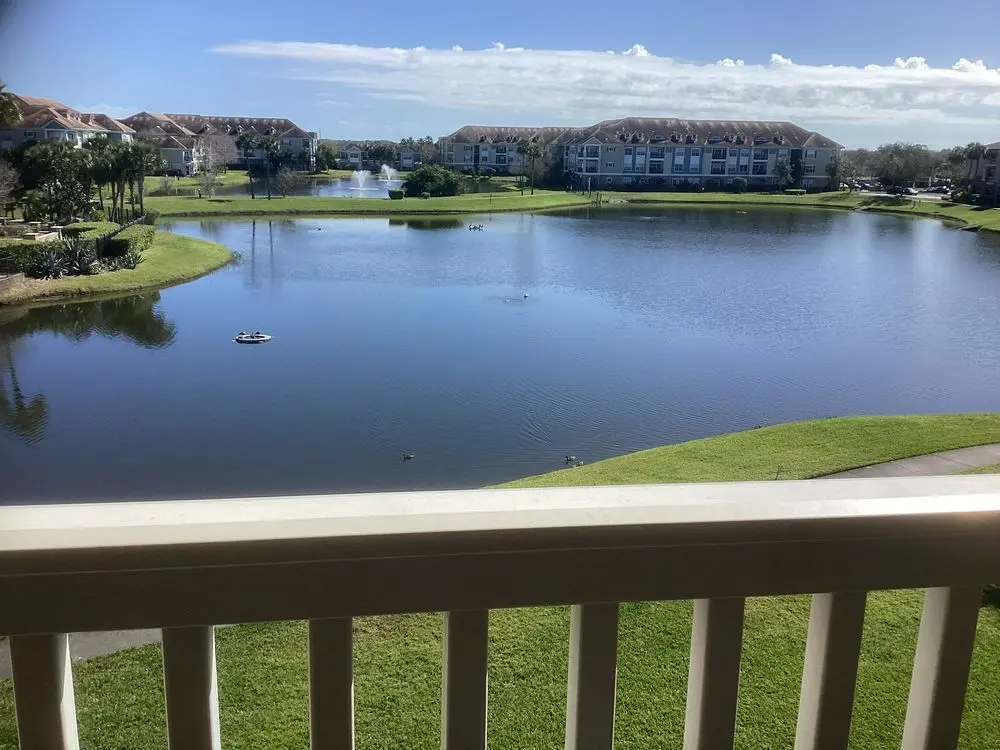
Listing remarks
3rd floor WATERFRONT with 3 lighted fountains at night with private entrance into the AVENUES OF VIERA where there is Restaurant, Bars, movie theatre, shops. Condo has been up dated, new lighting, new toilets, double oven for the cooks. New impact windows, new exterior paint and 30 year shingles, new water heater move in ready. Gated complex, with pool, hot tub, exercise facility, sitting room with internet and library, kitchen. New vanities in both bathrooms, 9 ft. Ceilings with crown molding. Will pay6 months of HOA fees and give up to 5,000 dollar floor allowance.
Key facts
- Gated complex
- New exterior paint
- New water heater
Tags
Neighborhood map
What this means for you Summary
Snapshot
- This is a 2-bed/2.0-bath condo listed at $250k. Condition is rated good.
Deal economics
- At list price, monthly cash flow is $-859 ($-10k/yr) — negative.
- To cash-flow at today's rent, offer at most $229k (8.4% below list).
- To meet the 1% rule (rent ≥ 1% of price), the offer needs to be $200k (19.9% below list).
- Recommended offer: $200k (19.9% below list) — sets the bar for 1% rule.
Location & tenants
- Location reads 70/100 on livability (#450 in FL) — a middle-class / working-renter tenant base. Strengths: crime A+, employment A, housing A; Watch: amenities F, commute F, cost of living F.
- Brevard (suburban): math 53% / reading 57% proficiency, ranked #19 of 73 in FL (top 26%) — acceptable for families but not a draw, mixed tenant base, ~2y average lease.
- Zoned schools: Quest Elementary School (math 83% / reading 80%, grade A+, #90 of 2,144 statewide, top 4%, 691 students, 20% FRL); John F. Kennedy Middle School (math 67% / reading 59%, grade B+, #111 of 571 statewide, top 20%, 673 students, 41% FRL); Viera High School (math 58% / reading 71%, grade B-, #78 of 667 statewide, top 13%, 2,289 students, 15% FRL) — zoned schools average 25% FRL vs 43% district-wide (18 pts lower); this property's tenant base skews higher-income than the district average.
- Zoned-school proficiency averages 70% at this address vs 55% district-wide (+15 pts) — the actual schools serving this property are materially stronger than the Brevard average implies; a family-tenant draw the district grade alone would hide.
- Market conditions: Rents rising (+2.0%/yr); 593 active listings in the ZIP; 19 comparable units currently listed for rent nearby; rentals at typical pace (median 16d on market — plan ~3-4 weeks tenant-placement turnaround); high-income renter base; 4,602 units permitted in Brevard County in 2024 (702 in 5+ unit buildings).
Forward outlook
- In year one you build about $3k of equity ($2k loan paydown + $1k appreciation (0.4% local appreciation)).
- Brevard County population projected at +15% by 2050 — modest demand growth; plan on rents tracking national, not racing it.
- By year 10, paydown + projected appreciation supports a ~$32k cash-out refi (75% LTV) — recoverable capital for the next deal without selling this one.
Negotiation context
- It's been on market 96 days — a 9% lower offer ($227k) is reasonable based on typical stale-listing flexibility.
- 5 sale attempts since 21y ago with the ask held roughly flat each time — persistent listings suggest the price (not the market) is what's stuck; bring a comps-based counter.
Risks & watch-outs
- Watch-outs: HOA is 36% of rent.
Questions for the listing agent
- What do current leases actually rent for vs. the listed asking? Can we see a recent rent roll and the last 12 months of T-12 income?
- It's been on market 96 days. Have you received any prior offers? Is the seller open to a 20% concession, seller financing, or rate buy-down credit?
- What does the HOA fee cover, when was the last increase, and are there any pending special assessments or reserve-fund shortfalls?
- Any open or pending special assessments — roof, HVAC, plumbing, elevator, façade? What's the per-unit balance and payoff schedule, and is the seller paying it off at close or rolling it to the buyer?
- Why hasn't it sold? Are there any deal-killer items the seller is aware of (foundation, flood, title, zoning, code violations)?
- Is there a deadline driving the sale (1031 exchange, divorce, estate, relocation)? That informs how much negotiation room exists.
- Schools are A-rated — typically a magnet for longer-tenancy family renters. What's the average tenant stay here, and is there a school-zone premium baked into asking?
- The area grade is low — what's the realistic commute time and amenity access for the typical tenant pool here? Any planned neighborhood developments (good or bad) we should know about?
- What's the average days-on-market for RENTAL listings here right now (not sales)? A rising rental-DOM trend means longer vacancies and softer asking-rent achievability than the comps imply.
- What's the recent tenant-quality profile in this submarket — average credit score on applications, eviction rate, late-payment / NSF rate, and stable-employment percentage? A property-management company in the area should have these aggregated.
- How much new apartment / multifamily construction is in the pipeline within 1–3 miles? Heavy new supply (>2% of stock underway) typically softens rents 12–24 months out; light construction supports rent growth.
Investment metrics
- 1% rule
- 0.80% ✗
- Cap rate
- 2.17%
- Cash-on-cash
- -14.73%
- DSCR
- 0.34
- GRM
- 10.4
CMA / ARV
No comps found within radius.
Projected returns pro-forma
0.4% appreciation · 1.96% rent growth · sell at horizon
- IRR
- -17.7%
- Equity multiple
- 0.16×
- Total profit
- $-58,843
- Equity at exit
- $77,642
- IRR
- -11.7%
- Equity multiple
- -0.28×
- Total profit
- $-89,832
- Equity at exit
- $97,485
Cash invested: $69,972 (down + closing). Projections, not guarantees.
Landlord ↔ Tenant lean methodology
- Overall (STATE)
- 87 Strongly Landlord-Friendly
- State Florida
- 87 Strongly Landlord-Friendly · R+3
- County
- — inherits STATE
- City
- — inherits STATE
ZIP-level market 32940
- Home prices YoY
- 0.1%
- Rents YoY
- 2.0%
- Active inventory
- 593
- Price-to-rent
- 10.4×
Monthly cashflow live
- Estimated rent
- $2,001 high interval (Pro) →
- Mortgage (P&I)
- −$1,311
- Tax est. 1.5%
- −$312 /mo · $3,748/yr
- Insurance
- −$104
- HOA est. from 2 same-building comps
- −$713
- Vacancy / Maint / Mgmt
- −$420
- Net cashflow
- $-859
Break-even live
Sensitivity live
| Price | -10% $-686 | -5% $-773 | +0% $-859 | +5% $-945 | +10% $-1,032 |
|---|---|---|---|---|---|
| Rent | -10% $-1,017 | -5% $-938 | +0% $-859 | +5% $-780 | +10% $-701 |
| Rate | -1.0pp $-733 | -0.5pp $-795 | base $-859 | +0.5pp $-924 | +1.0pp $-990 |
UW: 25.0% down · 7.5% · 30yr · 1.5% tax · 5.0% vac · 8.0% maint · 8.0% mgmt
Financing live
Cash to close
- Down payment
- $62,475
- Closing costs
- $7,497
- Reserves months
- —
- Total cash needed
- —
Loan-product check · same deal, 3 products live
Conventional
25% down · 7.5% · 30yr
- Down + closing
- —
- Monthly P&I
- —
- Monthly cashflow
- —
- DSCR
- —
- Eligible?
- —
Personal DTI + credit; lowest rate.
DSCR
20% down · 8.5% · 30yr
- Down + closing
- —
- Monthly P&I
- —
- Monthly cashflow
- —
- DSCR
- —
- Eligible?
- —
No personal income docs; deal must DSCR.
Hard money
10% down · 12.0% · 12mo
- Down + closing
- —
- Monthly P&I
- —
- Monthly cashflow
- —
- DSCR
- —
- Eligible?
- —
Short-term bridge; refi at stabilization.
Rent comps 19 comps
| Address | Beds | Baths | Sqft | Rent | $/sqft | DOM | Units | Dist |
|---|---|---|---|---|---|---|---|---|
| 6411 Borasco Dr Melbourne, FL | 2.0–3.0 | 2.0 | 1258 | $1,700 | $1.35 | 25d | 1 | 0.02mi |
| 6431 Borasco Dr Melbourne, FL | 1.0–2.0 | 1.0–2.0 | 869 | $1,950 | $2.24 | 21d | 2 | 0.07mi |
| 2185 Judge Fran Jamieson Way Melbourne, FL | 1.0–3.0 | 1.0–2.0 | 1192 | $2,008 | $1.68 | 15d | 17 | 0.11mi |
| 6451 Borasco Dr Melbourne, FL | 1.0 | 1.0 | 781 | $1,698 | $2.17 | 16d | 2 | 0.12mi |
| 6450 Borasco Dr #3707 Melbourne, FL | 1.0 | 1.0 | 868 | $1,600 | $1.84 | 16d | 1 | 0.15mi |
| 2560 Judge Fran Jamieson Way Melbourne, FL | 1.0–3.0 | 1.0–2.0 | 1091 | $2,186 | $2.00 | 15d | 14 | 0.27mi |
| 2992 Rodina Dr Melbourne, FL | 1.0–2.0 | 1.0–2.0 | 963 | $2,585 | $2.68 | 16d | 8 | 0.42mi |
| 6705 Shadow Creek Trl Melbourne, FL | 1.0–3.0 | 1.0–2.0 | 1123 | $2,242 | $2.00 | 15d | 25 | 0.45mi |
| 2439 Casona Ln Melbourne, FL | 1.0–2.0 | 1.0–2.0 | 964 | $2,251 | $2.34 | 15d | 14 | 0.69mi |
| 1622 Laramie Cir Melbourne, FL | 3.0 | 2.0 | 1390 | $2,600 | $1.87 | 16d | 1 | 0.79mi |
| 2301 Willet Pl Melbourne, FL | 1.0–3.0 | 1.0–2.0 | 1109 | $2,602 | $2.35 | 15d | 27 | 0.80mi |
| 1766 Sophias Dr #302 Melbourne, FL | 2.0 | 2.0 | 1020 | $1,750 | $1.72 | 25d | 1 | 1.12mi |
| 1747 Sophias Dr #202 Melbourne, FL | 3.0 | 2.0 | 1278 | $2,200 | $1.72 | 16d | 1 | 1.13mi |
| 1747 Sophias Dr Melbourne, FL | 2.0–3.0 | 2.0 | 1149 | $1,850 | $1.61 | 25d | 2 | 1.13mi |
| 5693 Star Rush Dr #207 Melbourne, FL | 2.0 | 2.0 | 1139 | $1,695 | $1.49 | 25d | 1 | 1.14mi |
| 6848 Toland Dr #406 Melbourne, FL | 2.0 | 2.0 | 1232 | $2,000 | $1.62 | 25d | 1 | 1.18mi |
| 6828 Toland Dr #402 Melbourne, FL | 2.0 | 2.0 | 1232 | $2,500 | $2.03 | 16d | 1 | 1.20mi |
| 6828 Toland Dr Melbourne, FL | 2.0 | 2.0 | 1232 | $2,248 | $1.82 | 21d | 2 | 1.22mi |
| 6828 Toland Dr Melbourne, FL | 2.0 | 2.0 | 1232 | $2,248 | $1.82 | 25d | 2 | 1.22mi |
HOA detail condo
- Monthly dues
- $0 · $0/yr
- Likely covers
- waterinternetpoolsecurity
- Assessments
- None detected in remarks — confirm with the listing agent.
Listing history 25 events
-
2026-06-22days on market $249,900 Active 96 DOM
-
2026-06-18days on market $249,900 Active 93 DOM
-
2026-06-17days on market $249,900 Active 92 DOM
-
2026-06-16days on market $249,900 Active 91 DOM
-
2026-06-15days on market $249,900 Active 90 DOM
-
2026-06-14days on market $249,900 Active 88 DOM
-
2026-06-10days on market $249,900 Active 85 DOM
-
2026-06-08days on market $249,900 Active 83 DOM
-
2026-06-07days on market $249,900 Active 82 DOM
-
2026-06-05remarks 575-char remark
-
2026-06-05days on market $249,900 Active 79 DOM
-
2026-06-03days on market $249,900 Active 78 DOM
-
2026-06-02days on market $249,900 Active 77 DOM
-
2026-06-01days on market $249,900 Active 76 DOM
-
2026-05-31days on market $249,900 Active 75 DOM
-
2026-03-17$249,900 Active
-
2025-01-05historical $2,195
-
2024-07-26price $2,195
-
2024-05-01$2,350
-
2016-08-16historical
-
2006-01-30soldstatus $280,000
-
2006-01-13soldstatus $263,400
-
2005-12-23$333,900
-
2005-12-23$259,900
-
2005-12-23$317,900
ⓘ Source: listings_history table (triggers on properties + properties_extension) + one-shot
backfill from property_details.listing_events for pre-trigger history.
Nearby sold comps map
Loading sold comps map…
Walkable amenities ~0.75 mi
Loading nearby amenities…
Taxation est. · year 1
- Rental income
- $24,017
- − Mortgage interest
- −$13,998
- − Property taxes
- −$3,748
- − Insurance
- −$1,250
- − Repairs & maintenance
- −$1,921
- − Management
- −$1,921
- − HOA
- −$8,556
- − Depreciation
- −$7,270
- Taxable loss
- −$14,648
- Est. tax savings @ 24.0%
- +$3,515
- After-tax cash flow
- $-6,791/yr
For passive investors: Depreciation is non-cash, so a rental often shows a tax loss while cash-flowing — sheltering income. Rental losses are passive: they offset passive income freely, and up to $25,000/yr can offset ordinary (W-2) income if you actively participate and your MAGI is under $100k (phasing out to $0 by $150k); unused losses carry forward. On sale, claimed depreciation is recaptured at up to 25%, and gains may owe capital-gains tax (a 1031 exchange can defer both). Figures are a year-1 estimate at your 24.0% rate — not tax advice; consult a CPA.
Condition & rehab AI · 13 photos
The home is in good condition with a good exterior and interior. It has a good curb appeal and is move-in ready. Some minor maintenance and updates can further enhance its value.
Value-add opportunities
- Resale Paint the exterior walls — Painting the exterior walls can enhance the curb appeal and make the home more attractive to potential buyers.
- Rental Clean the windows — Clean windows can make the home more appealing to renters and improve the overall living experience.
- Both Inspect and clean the HVAC system — A clean and functioning HVAC system is essential for both resale and rental value, as it ensures comfort and energy efficiency.
Renovation cost estimate screening
Value-add ROI direction
- Resale Paint the exterior walls — Painting the exterior walls can enhance the curb appeal and make the home more attractive to potential buyers. ↑
- Rental Clean the windows — Clean windows can make the home more appealing to renters and improve the overall living experience. ↑
- Both Inspect and clean the HVAC system — A clean and functioning HVAC system is essential for both resale and rental value, as it ensures comfort and energy efficiency. ↑
ⓘ Cost ranges are severity-bucket heuristics (US national rule-of-thumb). Get contractor quotes + a written scope before underwriting a rehab budget.
Schools (NCES district)
- District
- Brevard
- NCES district ID
- 1200150
- Math proficiency
- 53% ▼ -9.00%
- Reading proficiency
- 57% ▼ -4.00%
- Median HH income
- $49,426
- Composite
- 46.86/100
- National rank
- #2370
- State rank
- #19 of 73 in FL
Livability — Viera West
- Score
- 70/100
- State rank
- #450
- US rank
- #8106
Category grades
Schools grade is shown separately in the Schools card above.
Census & demographics
- Census place
- Viera West, FL
- County
- Brevard County · 602,871 people
- Metro
- Palm Bay-Melbourne-Titusville, FL
- Population (ZIP)
- 51,727
- Household income
- $110,495
- Rent vs Own
- Severe rent burden
- 873.0
Population outlook (Brevard County) Hauer SSP2
- Today (2025)
- 623,254 people
- By 2030
- 648,420 · +4.0%
- By 2040
- 690,009 · +10.7%
- By 2050
- 715,669 · +14.8%
- By 2075
- 775,744 · +24.5%
- By 2100
- 776,687 · +24.6%
Race, ethnicity, and origin ACS 2023
- Neighborhood character
- Predominantly White (77%)
- Race & ethnicity
- White 77% Hispanic / Latino 10% Two or more races 9% Asian 5% Black 3%
- Hispanic origin (detail)
- Mexican 1% Puerto Rican 3% Cuban 1%
- Common ancestry
- Romanian 4% Lithuanian 3% Slovak 2%
- Foreign-born
- 11% · Canada, Jamaica, China
- Languages at home
- 88% English-only · Spanish 6% Other Indo-European 2% German/W. Germanic 1%
Political lean MEDSL · Brevard
- 2024 margin
- Strong R (+20.8) · D 39.1% · R 59.9% · Other 1.0%
- 2008→2024 swing
- -10.4pp toward R · 2008: -10.4pp · 2024: -20.8pp
- All cycles
- 2024: R+20.8 2020: R+16.4 2016: R+19.8 2012: R+12.7 2008: R+10.4
Not yet ingested
- Civics
- —
Market trends
- HPI YoY
- ▲ 0.40%
- Current HPI
- 298.1023
- Rent YoY
- ▲ 1.96%
- Metro
- Palm Bay-Melbourne-Titusville, FL
- State GDP YoY
- ▲ 3.28%
- F500 in state
- 36
Industry mix (Fortune 500 HQ in FL)
| Industry | F500 HQs | Revenue |
|---|---|---|
| Industrial Technology | 2 | $29B |
|
||
| Insurance | 2 | $17B |
|
||
| Retail | 1 | $60B |
|
||
| Technology Distribution | 1 | $58B |
|
||
| Homebuilding | 1 | $35B |
|
||
| Technology Manufacturing | 1 | $35B |
|
||
Price history
-25.2% since first listed10 events — show timeline
- 2026-03-17 Listed $249,900 ForSaleByOwner.com
- 2025-01-05 Rental Removed $2,195 BUILDIUM
- 2024-07-26 Price Changed $2,195 BUILDIUM
- 2024-05-01 Listed for Rent $2,350 BUILDIUM
- 2016-08-16 Listing Removed — SCMLS
- 2006-01-30 Sold (MLS) $280,000 SCMLS
- 2006-01-13 Sold (MLS) $263,400 SCMLS
- 2005-12-23 Listed $317,900 SCMLS
- 2005-12-23 Listed $259,900 SCMLS
- 2005-12-23 Listed $333,900 SCMLS
Cash-flow waterfall
monthlySold comps — $/sqft
last 12 mo · ≤1 miLoading sold comps…