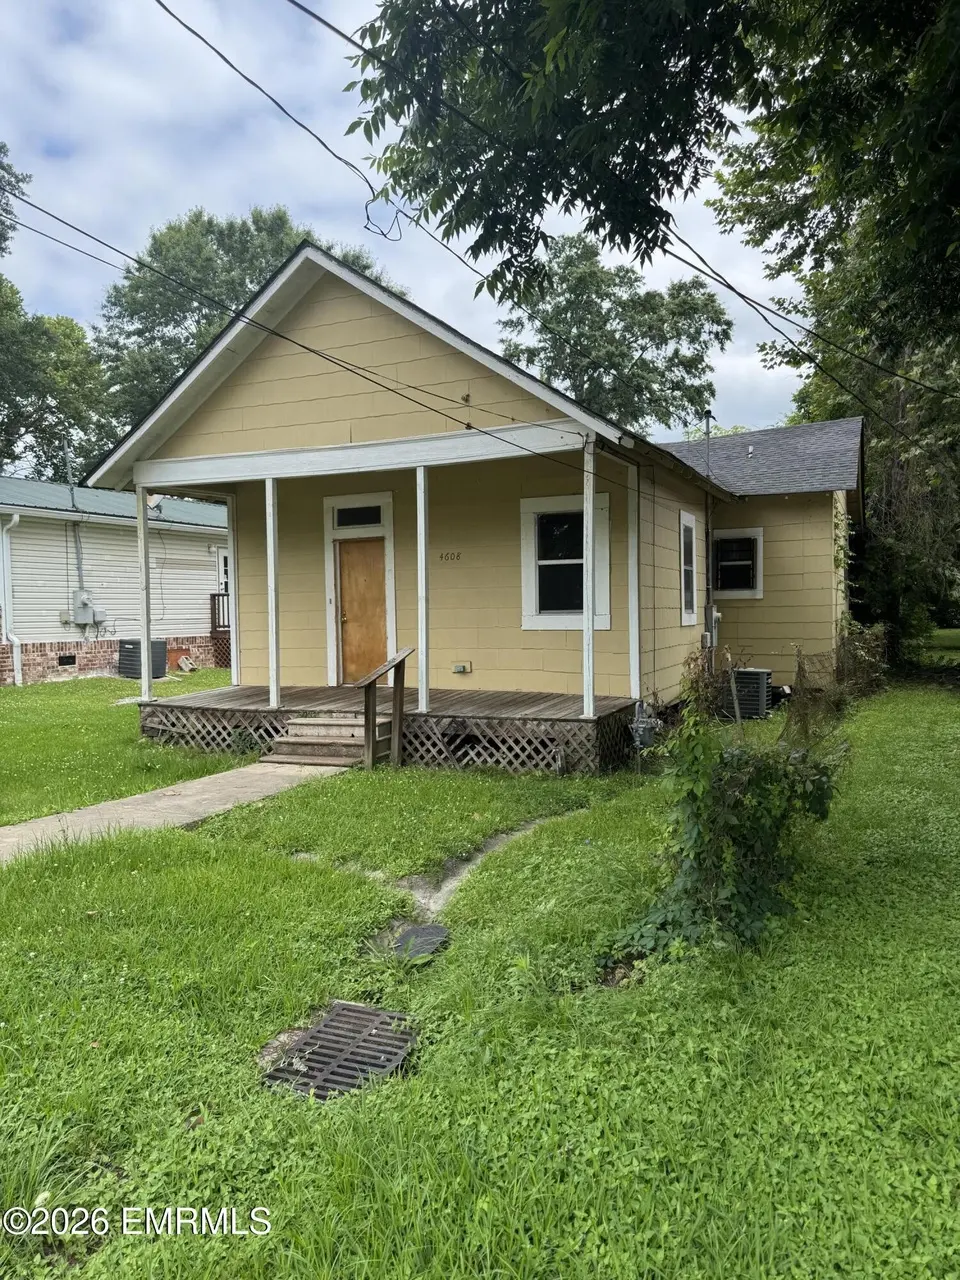
4608 3rd St · Meridian, MS
Flood risk 8/10 · Major
- FEMA flood zone
- X (unshaded)
- Chance of flooding over 30 yrs
- 0.96%
- Est. flood insurance / yr
- $507 – $1,088
Fire risk 1/10 · Minimal
- Est. fire insurance / yr
- $1,241 – $2,305
Heat risk 7/10 · Major
- Hot days now (above 107°F)
- 7 days/yr
- Hot days in 30 yrs
- 21 days/yr
Wind risk 8/10 · Major
- Chance of severe wind over 30 yrs
- 80.0%
Air-quality risk 1/10 · Minimal
- Unhealthy air days now
- 0 days/yr
- Unhealthy air days in 30 yrs
- 0 days/yr
Risk factors via First Street. Map © Google.
Why this score? — see what drove the B- grade
The composite is a weighted blend of 9 inputs, each scored 0–100. Each bar is that input's sub-score; the figure is the points it added to the 100-point composite (weight × sub-score).
- Cash flow +30.0/30.0
- 1% rule +10.0/10.0
- DSCR +10.0/10.0
- ARV discount +7.5/15.0
- Livability +3.2/5.0
- Rent growth +2.5/5.0
- Condition / age +2.5/5.0
- Schools +1.2/10.0
- Appreciation +0.0/10.0
$34,500
🖨 Deal sheet 📄 Offer letter ✓ Due diligence
Listing remarks
MODEST 2BR/1BA BUNGALOW! ALL ELECTRIC WITH CH/A.
Key facts
- 2,340 sq ft lot
- Built 1940
- Listed 13 days
Property features AI
Exterior
- Utilities: Public water; Public sewer
- Home design: Single-family residence; Single story
- Construction: Wood siding
- Exterior features: Composition roof
Interior
- Kitchen: Electric range; Refrigerator
- Bathrooms: 1 full bathroom
- Heating & cooling: Central heating; Central air
- Interior features: Electric range; Refrigerator; Electric water heater; Central heating; Central air
- Laundry & utility: Electric water heater
Neighborhood map
What this means for you Summary
Snapshot
- This is a 2-bed/1.0-bath single-family listed at $34k.
Deal economics
- At list price, monthly cash flow is $587 ($7k/yr) — positive.
- The deal already cash-flows at list — no discount required.
- Meets the 1% rule at list price ($1k rent vs $34k).
Location & tenants
- Location reads 64/100 on livability (#141 in MS) — a middle-class / working-renter tenant base. Strengths: cost of living A+, housing A; Watch: schools D, amenities F, commute F.
- Meridian Public Schools (town): math 13% / reading 17% proficiency, ranked #109 of 130 in MS (top 84%) — low school quality limits family demand, transient renter base, plan for 1-2y turnover; 85% free/reduced lunch — lower-income household profile, screen leases tightly.
- Market conditions: 29 active listings in the ZIP; 18 units permitted in Lauderdale County in 2024 (0 in 5+ unit buildings).
Forward outlook
- Local home prices are declining (-3.0%/yr); year-one equity from $239 of loan paydown is wiped out by about $1k of value loss. Plan a longer hold.
- Lauderdale County population projected at -18% by 2050 — secular population decline; favor cash flow + early exit over multi-decade hold.
- At projected returns (-3.0% appreciation + 3.0% rent growth), your $10k cash investment doubles in ~2 years — after that, you're playing with house money.
Negotiation context
- Only 14 days on market — expect competitive offers; lowballing is unlikely to land.
Risks & watch-outs
- Watch-outs: flood insurance adds $66/mo; built in 1940 — expect roof / HVAC / electrical / plumbing capex.
- Climate carrying-cost: severe flood risk; severe wind risk, 80% chance of damaging wind over 30y; extreme-heat days projected 7→21/yr by 2055 (HVAC capex compounding) — expect insurance premiums to compound above CPI over the hold.
Questions for the listing agent
- Built in 1940 — when were the roof, HVAC, electrical panel, plumbing, and water heater last replaced?
- What's the actual annual flood-insurance premium (NFIP or private), and is the property in a SFHA with mandatory coverage?
- Is there a deadline driving the sale (1031 exchange, divorce, estate, relocation)? That informs how much negotiation room exists.
- Schools are D-rated, which usually means shorter tenancies and higher turnover. Who's the typical renter profile here, and what's been the actual vacancy rate?
- What's the average days-on-market for RENTAL listings here right now (not sales)? A rising rental-DOM trend means longer vacancies and softer asking-rent achievability than the comps imply.
- What's the recent tenant-quality profile in this submarket — average credit score on applications, eviction rate, late-payment / NSF rate, and stable-employment percentage? A property-management company in the area should have these aggregated.
- How much new for-sale + rental construction is in the pipeline within 1–3 miles? Heavy new supply typically softens prices + rents 12–24 months out; constrained supply supports both.
Investment metrics
- 1% rule
- 3.20% ✓
- Cap rate
- 29.01%
- Cash-on-cash
- 81.12%
- DSCR
- 4.61
- GRM
- 2.6
CMA / ARV
- ARV (on-the-fly)
- $14,272
- Comps found
- 1
Show comp detail 1 sale within ~0.75 mi
| Address | Dist | Beds/Ba | Sqft | Sold | Price | $/sf | Match |
|---|---|---|---|---|---|---|---|
| 1116 46th Avenue Ave | 0.70mi | 3/1.0 (+1) | 965 (+8%) | 19mo | $15,000 | $16 | 33 |
Match score weights: distance 35% · size 25% · config 20% · recency 20%. Top-matched comps best support the ARV.
Projected returns pro-forma
-3.0% appreciation · 3.0% rent growth · sell at horizon
- IRR
- 72.6%
- Equity multiple
- 4.29×
- Total profit
- $31,811
- Equity at exit
- $5,144
- IRR
- 76.5%
- Equity multiple
- 8.87×
- Total profit
- $75,987
- Equity at exit
- $2,983
Cash invested: $9,660 (down + closing). Projections, not guarantees.
Landlord ↔ Tenant lean methodology
- Overall (STATE)
- 90 Strongly Landlord-Friendly
- State Mississippi
- 90 Strongly Landlord-Friendly · R+11
- County
- — inherits STATE
- City
- — inherits STATE
ZIP-level market 39307
- Home prices YoY
- -21.6%
- Active inventory
- 29
- Price-to-rent
- 2.6×
Monthly cashflow live
- Estimated rent
- $1,104 medium interval (Pro) →
- Mortgage (P&I)
- −$181
- Tax from tax record
- −$23 /mo · $282/yr
- Insurance
- −$14
- Flood insurance flood zone
- −$66 /mo · $798/yr
- HOA
- −$0
- Vacancy / Maint / Mgmt
- −$232
- Net cashflow
- $587
Break-even live
UW: 25.0% down · 7.5% · 30yr · 1.5% tax · 5.0% vac · 8.0% maint · 8.0% mgmt
Financing live
Cash to close
- Down payment
- $8,625
- Closing costs
- $1,035
- Reserves months
- —
- Total cash needed
- —
Loan-product check · same deal, 3 products live
Conventional
25% down · 7.5% · 30yr
- Down + closing
- —
- Monthly P&I
- —
- Monthly cashflow
- —
- DSCR
- —
- Eligible?
- —
Personal DTI + credit; lowest rate.
DSCR
20% down · 8.5% · 30yr
- Down + closing
- —
- Monthly P&I
- —
- Monthly cashflow
- —
- DSCR
- —
- Eligible?
- —
No personal income docs; deal must DSCR.
Hard money
10% down · 12.0% · 12mo
- Down + closing
- —
- Monthly P&I
- —
- Monthly cashflow
- —
- DSCR
- —
- Eligible?
- —
Short-term bridge; refi at stabilization.
Listing history 9 events
-
2026-06-17days on market $34,500 Active 14 DOM
-
2026-06-16days on market $34,500 Active 13 DOM
-
2026-06-15days on market $34,500 Active 12 DOM
-
2026-06-14days on market $34,500 Active 10 DOM
-
2026-06-12days on market $34,500 Active 9 DOM
-
2026-06-09days on market $34,500 Active 6 DOM
-
2026-06-08days on market $34,500 Active 5 DOM
-
2026-06-07remarks 49-char remark
-
2026-06-07$34,500 Active 4 DOM
ⓘ Source: listings_history table (triggers on properties + properties_extension) + one-shot
backfill from property_details.listing_events for pre-trigger history.
Tax reassessment forecast MS · Resets to sale price
- Current annual tax
- $282 · $23/mo
- Projected year-2 tax
- $282 · $23/mo
- Expected delta
- $0/yr ($0/mo · 0.0%)
ⓘ Screening estimate from a state-policy table — verify with the county assessor before closing.
Climate risk First Street
- Flood 8/10 Severe FEMA zone X (unshaded) · 96% chance over 30 yrs
- Wildfire 1/10 Low
- Heat 7/10 Severe 7 d/yr ≥107°F today · 21 d/yr by 30 yrs out
- Wind 8/10 Severe 80% chance of damaging wind over 30 yrs
- Air quality 1/10 Low 0 unhealthy d/yr today · 0 by 30 yrs out
Nearby sold comps map
Loading sold comps map…
Walkable amenities ~0.75 mi
Loading nearby amenities…
Taxation est. · year 1
- Rental income
- $13,242
- − Mortgage interest
- −$1,933
- − Property taxes
- −$282
- − Insurance
- −$970
- − Repairs & maintenance
- −$1,059
- − Management
- −$1,059
- − Depreciation
- −$1,004
- Taxable income
- $6,935
- Est. tax owed @ 24.0%
- −$1,664
- After-tax cash flow
- $5,374/yr
For passive investors: Depreciation is non-cash, so a rental often shows a tax loss while cash-flowing — sheltering income. Rental losses are passive: they offset passive income freely, and up to $25,000/yr can offset ordinary (W-2) income if you actively participate and your MAGI is under $100k (phasing out to $0 by $150k); unused losses carry forward. On sale, claimed depreciation is recaptured at up to 25%, and gains may owe capital-gains tax (a 1031 exchange can defer both). Figures are a year-1 estimate at your 24.0% rate — not tax advice; consult a CPA.
Schools (NCES district)
- District
- Meridian Public Schools
- NCES district ID
- 2802910
- Math proficiency
- 13% ▼ -12.00%
- Reading proficiency
- 17% ▼ -4.00%
- Median HH income
- $30,236
- Composite
- 11.87/100
- National rank
- #9673
- State rank
- #109 of 130 in MS
Livability — Meridian
- Score
- 64/100
- State rank
- #141
- US rank
- #14839
Category grades
Schools grade is shown separately in the Schools card above.
Census & demographics
- Census place
- Meridian, MS
- City population
- 42,445
- Population (ZIP)
- 15,636
Population outlook (Lauderdale County) Hauer SSP2
- Today (2025)
- 75,158 people
- By 2030
- 72,770 · -3.2%
- By 2040
- 67,309 · -10.4%
- By 2050
- 61,797 · -17.8%
- By 2075
- 49,790 · -33.8%
- By 2100
- 39,797 · -47.0%
Race, ethnicity, and origin ACS 2023
- Neighborhood character
- Predominantly Black (69%)
- Race & ethnicity
- Black 69% White 26% Two or more races 4%
- Common ancestry
- Serbian 1% Slovak 1%
- Foreign-born
- 1% · Canada
- Languages at home
- 98% English-only · Other Asian/Pacific 1%
Political lean MEDSL · Lauderdale
- 2024 margin
- Strong R (+21.2) · D 39.0% · R 60.2%
- 2008→2024 swing
- -2.3pp toward R · 2008: -18.9pp · 2024: -21.2pp
- All cycles
- 2024: R+21.2 2020: R+16.0 2016: R+23.0 2012: R+15.5 2008: R+18.9
Not yet ingested
- Civics
- —
Market trends
- HPI YoY
- ▼ -33.34%
- Current HPI
- 121.0078
- Rent YoY
- —
- Metro
- —
- State GDP YoY
- —
- F500 in state
- 0
Price history
3 events — show timeline
- 2026-06-03 Listed $34,500 EMR
- 2021-03-24 Sold (Public Records) — Public Records
- 2004-12-31 Sold (Public Records) — Public Records
Property tax history
-1.1%/yrLatest (2025): $282 · +0.1% YoY. Source: county tax records.
Cash-flow waterfall
monthlySold comps — $/sqft
last 12 mo · ≤1 miLoading sold comps…