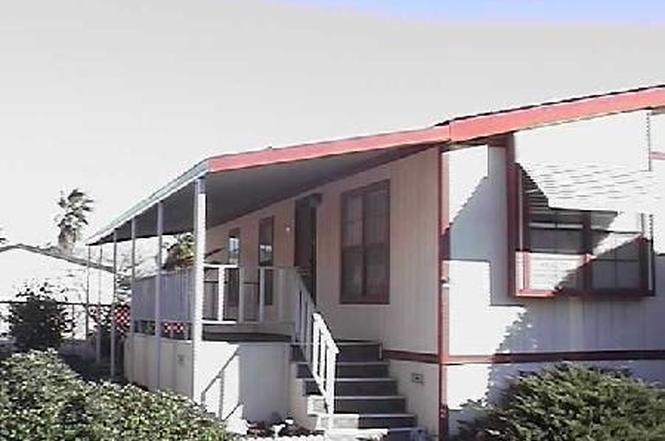
2598 Ayala · Rialto, CA
Flood risk 3/10 · Minor
- FEMA flood zone
- X (unshaded)
- Chance of flooding over 30 yrs
- 0.2%
- Est. flood insurance / yr
- $507 – $1,088
Fire risk 7/10 · Major
- Est. fire insurance / yr
- $659 – $1,223
Heat risk 8/10 · Major
- Hot days now (above 102°F)
- 6 days/yr
- Hot days in 30 yrs
- 16 days/yr
Wind risk 1/10 · Minimal
- Chance of severe wind over 30 yrs
- —
Air-quality risk 10/10 · Severe
- Unhealthy air days now
- 27 days/yr
- Unhealthy air days in 30 yrs
- 32 days/yr
Risk factors via First Street. Map © Google.
Why this score? — see what drove the B- grade
The composite is a weighted blend of 9 inputs, each scored 0–100. Each bar is that input's sub-score; the figure is the points it added to the 100-point composite (weight × sub-score).
- Cash flow +30.0/30.0
- 1% rule +10.0/10.0
- DSCR +10.0/10.0
- ARV discount +8.9/15.0
- Schools +3.1/10.0
- Livability +3.0/5.0
- Rent growth +2.5/5.0
- Condition / age +2.5/5.0
- Appreciation +0.0/10.0
$160,000
🖨 Deal sheet (PDF) 📄 Offer letter ✓ Due diligence
Listing remarks MLS
IN SENIOR PARK. GREAT SHAPE THIS 2BDRM. , 2BA. , MOBILE HOME, OFFERS LAUNDRY OFF KITCHEN. LOW MAINTENANCE FRONT AND BACK YARD. STORAGE SHED IN BK. YARD AND STORAGE AREA. CALL FIRST FOR APPT. IF, NO ANSWER LOCK BOX ON FRONT DOOR.
Key facts
- 1,440 sq ft lot
- Community pool
- Built 1988
Property features AI
Finance
- Other: Lot reported as 0-1 unit/acre (assessor's data); Living area reported from assessor's data
- Financial info: Lease/rental details include a land lease; no additional financial operating data provided
- HOA & community: Senior community; Land lease of $696.64 (land lease applies)
Exterior
- Parking: Park name: El Rancho Verde
- Security: Manager approval required for residency
- Utilities: Public sewer; Water: District/Public (see remarks)
- Home design: Mobile home (24 ft. x 60 ft.) — mobile home remains on site; Single-story
- Construction: Year built information from public records (specific year not provided)
- Exterior features: Community pool; Street lighting
Interior
- Kitchen: Kitchen details not provided
- Bedrooms: Information about bedroom count or levels not provided
- Flooring: Flooring details not provided
- Bathrooms: 2 full bathrooms
- Heating & cooling: Central furnace heating
- Interior features: One-level home with street-level entry; Entry located on the street; Individual laundry room
- Laundry & utility: Washer/dryer hook-ups in an individual laundry room
Neighborhood map
What this means for you Summary
Snapshot
- This is a 2-bed/2.0-bath land listed at $160k.
Deal economics
- At list price, monthly cash flow is $1k ($14k/yr) — positive.
- The deal already cash-flows at list — no discount required.
- Meets the 1% rule at list price ($3k rent vs $160k).
- Cap rate 15.0% vs local median 3.5% in Rialto — top-decile yield for the area; either an underpriced asset or a hidden risk that comps aren't pricing in. Stress-test before assuming the spread holds.
Location & tenants
- Location reads 60/100 on livability (#598 in CA) — a middle-class / working-renter tenant base. Strengths: housing A+, commute A-; Watch: schools F, crime F, amenities D-.
- Rialto Unified (suburban): math 25% / reading 46% proficiency, ranked #268 of 517 in CA (top 52%) — families likely to look elsewhere, expect single-tenant / working-renter base with shorter leases; 74% free/reduced lunch — lower-income household profile, screen leases tightly.
- Market conditions: 32 active listings in the ZIP; high-income renter base; 5,458 units permitted in San Bernardino County in 2024 (1,500 in 5+ unit buildings).
Forward outlook
- Local home prices are declining (-3.0%/yr); year-one equity from $1k of loan paydown is wiped out by about $5k of value loss. Plan a longer hold.
- San Bernardino County population projected at +15% by 2050 — modest demand growth; plan on rents tracking national, not racing it.
- At projected returns (-3.0% appreciation + 3.0% rent growth), your $45k cash investment doubles in ~4 years — after that, you're playing with house money.
Negotiation context
- Only 5 days on market — expect competitive offers; lowballing is unlikely to land.
Risks & watch-outs
- Climate carrying-cost: major wildfire risk; extreme-heat days projected 6→16/yr by 2055 (HVAC capex compounding) — expect insurance premiums to compound above CPI over the hold.
Questions for the listing agent
- Is there a deadline driving the sale (1031 exchange, divorce, estate, relocation)? That informs how much negotiation room exists.
- Schools are F-rated, which usually means shorter tenancies and higher turnover. Who's the typical renter profile here, and what's been the actual vacancy rate?
- Crime grade is F in this area — have there been break-ins, vandalism, or insurance claims at this property in the last 3 years? What carrier currently insures it and at what premium?
- What's the average days-on-market for RENTAL listings here right now (not sales)? A rising rental-DOM trend means longer vacancies and softer asking-rent achievability than the comps imply.
- What's the recent tenant-quality profile in this submarket — average credit score on applications, eviction rate, late-payment / NSF rate, and stable-employment percentage? A property-management company in the area should have these aggregated.
- How much new for-sale + rental construction is in the pipeline within 1–3 miles? Heavy new supply typically softens prices + rents 12–24 months out; constrained supply supports both.
Investment metrics
- 1% rule
- 1.80% ✓
- Cap rate
- 15.03%
- Cash-on-cash
- 31.22%
- DSCR
- 2.39
- GRM
- 4.6
CMA / ARV
- ARV (median comp)
- $165,023
- List price
- $160,000
- Delta
- -3.04%
- Verdict
- FAIR
- Comps
- 6 within 1.0 mi
Projected returns pro-forma
-3.0% appreciation · 3.0% rent growth · sell at horizon
- IRR
- 26.1%
- Equity multiple
- 2.08×
- Total profit
- $48,343
- Equity at exit
- $23,857
- IRR
- 33.7%
- Equity multiple
- 4.08×
- Total profit
- $137,852
- Equity at exit
- $13,834
Cash invested: $44,800 (down + closing). Projections, not guarantees.
Landlord ↔ Tenant lean methodology
- Overall (STATE)
- 18 Strongly Tenant-Friendly
- State California
- 18 Strongly Tenant-Friendly · D+13
- County
- — inherits STATE
- City
- — inherits STATE
ZIP-level market 92377
- Home prices YoY
- -25.7%
- Active inventory
- 32
- Price-to-rent
- 4.6×
Monthly cashflow live
- Estimated rent
- $2,875 medium interval (Pro) →
- Mortgage (P&I)
- −$839
- Tax est. 1.5%
- −$200 /mo · $2,400/yr
- Insurance
- −$67
- HOA
- −$0
- Vacancy / Maint / Mgmt
- −$604
- Net cashflow
- $1,165
Break-even live
Sensitivity live
| Price | -10% $1,276 | -5% $1,221 | +0% $1,165 | +5% $1,110 | +10% $1,055 |
|---|---|---|---|---|---|
| Rent | -10% $938 | -5% $1,052 | +0% $1,165 | +5% $1,279 | +10% $1,393 |
| Rate | -1.0pp $1,246 | -0.5pp $1,206 | base $1,165 | +0.5pp $1,124 | +1.0pp $1,082 |
UW: 25.0% down · 7.5% · 30yr · 1.5% tax · 5.0% vac · 8.0% maint · 8.0% mgmt
Financing live
Cash to close
- Down payment
- $40,000
- Closing costs
- $4,800
- Reserves months
- —
- Total cash needed
- —
Loan-product check · same deal, 3 products live
Conventional
25% down · 7.5% · 30yr
- Down + closing
- —
- Monthly P&I
- —
- Monthly cashflow
- —
- DSCR
- —
- Eligible?
- —
Personal DTI + credit; lowest rate.
DSCR
20% down · 8.5% · 30yr
- Down + closing
- —
- Monthly P&I
- —
- Monthly cashflow
- —
- DSCR
- —
- Eligible?
- —
No personal income docs; deal must DSCR.
Hard money
10% down · 12.0% · 12mo
- Down + closing
- —
- Monthly P&I
- —
- Monthly cashflow
- —
- DSCR
- —
- Eligible?
- —
Short-term bridge; refi at stabilization.
Listing history 6 events
-
2026-06-15statusdays on market $160,000 Active 5 DOM
-
2026-05-07status Active
-
2026-05-04$160,000 Active
-
2006-09-25soldstatus $5,650,000
-
2004-02-24soldstatus $35,000 228-char remark
Show marketing remark (228 chars)
IN SENIOR PARK. GREAT SHAPE THIS 2BDRM. , 2BA. , MOBILE HOME, OFFERS LAUNDRY OFF KITCHEN. LOW MAINTENANCE FRONT AND BACK YARD. STORAGE SHED IN BK. YARD AND STORAGE AREA. CALL FIRST FOR APPT. IF, NO ANSWER LOCK BOX ON FRONT DOOR.
-
2004-01-14$39,500 228-char remark
Show marketing remark (228 chars)
IN SENIOR PARK. GREAT SHAPE THIS 2BDRM. , 2BA. , MOBILE HOME, OFFERS LAUNDRY OFF KITCHEN. LOW MAINTENANCE FRONT AND BACK YARD. STORAGE SHED IN BK. YARD AND STORAGE AREA. CALL FIRST FOR APPT. IF, NO ANSWER LOCK BOX ON FRONT DOOR.
ⓘ Source: listings_history table (triggers on properties + properties_extension) + one-shot
backfill from property_details.listing_events for pre-trigger history.
Climate risk First Street
- Flood 3/10 Moderate FEMA zone X (unshaded) · 20% chance over 30 yrs
- Wildfire 7/10 Severe
- Heat 8/10 Severe 6 d/yr ≥102°F today · 16 d/yr by 30 yrs out
- Wind 1/10 Low
- Air quality 10/10 Extreme 27 unhealthy d/yr today · 32 by 30 yrs out
Nearby sold comps map
Loading sold comps map…
Walkable amenities ~0.75 mi
Loading nearby amenities…
Taxation est. · year 1
- Rental income
- $34,499
- − Mortgage interest
- −$8,962
- − Property taxes
- −$2,400
- − Insurance
- −$800
- − Repairs & maintenance
- −$2,760
- − Management
- −$2,760
- − Depreciation
- −$4,655
- Taxable income
- $12,162
- Est. tax owed @ 24.0%
- −$2,919
- After-tax cash flow
- $11,066/yr
For passive investors: Depreciation is non-cash, so a rental often shows a tax loss while cash-flowing — sheltering income. Rental losses are passive: they offset passive income freely, and up to $25,000/yr can offset ordinary (W-2) income if you actively participate and your MAGI is under $100k (phasing out to $0 by $150k); unused losses carry forward. On sale, claimed depreciation is recaptured at up to 25%, and gains may owe capital-gains tax (a 1031 exchange can defer both). Figures are a year-1 estimate at your 24.0% rate — not tax advice; consult a CPA.
Schools (NCES district)
- District
- Rialto Unified
- NCES district ID
- 0632370
- Math proficiency
- 25% ▲ 3.00%
- Reading proficiency
- 46% ▲ 10.00%
- Median HH income
- $50,916
- Composite
- 30.77/100
- National rank
- #6154
- State rank
- #268 of 517 in CA
Livability — Rialto
- Score
- 60/100
- State rank
- #598
- US rank
- #19283
Category grades
Schools grade is shown separately in the Schools card above.
Census & demographics
- Census place
- Rialto, CA
- County
- San Bernardino County · 2,030,291 people
- City population
- 105,208
- Metro
- Riverside-San Bernardino-Ontario, CA
- Population (ZIP)
- 20,814
- Household income
- $116,223
- Rent vs Own
- Severe rent burden
- 130.0
Population outlook (San Bernardino County) Hauer SSP2
- Today (2025)
- 2,300,329 people
- By 2030
- 2,378,907 · +3.4%
- By 2040
- 2,523,137 · +9.7%
- By 2050
- 2,642,388 · +14.9%
- By 2075
- 2,880,769 · +25.2%
- By 2100
- 2,909,436 · +26.5%
Race, ethnicity, and origin ACS 2023
- Neighborhood character
- Diverse neighborhood (Simpson 0.56)
- Race & ethnicity
- Hispanic / Latino 62% Two or more races 19% Black 17% White 13% Asian 3%
- Hispanic origin (detail)
- Mexican 54%
- Common ancestry
- Slovak 2% Portuguese 1% Iranian 1%
- Foreign-born
- 18% · Canada
- Languages at home
- 61% English-only · Spanish 36% Tagalog/Filipino 1%
Political lean MEDSL · San Bernardino
- 2024 margin
- Toss-up / Even · D 47.5% · R 49.7% · Other 2.8%
- 2008→2024 swing
- -8.5pp toward R · 2008: 6.3pp · 2024: -2.1pp
- All cycles
- 2024: R+2.1 2020: D+10.7 2016: D+9.8 2012: D+5.4 2008: D+6.3
Not yet ingested
- Civics
- —
Market trends
- HPI YoY
- ▼ -140.24%
- Current HPI
- 406.0219
- Rent YoY
- —
- Metro
- Riverside-San Bernardino-Ontario, CA
- State GDP YoY
- ▲ 3.21%
- F500 in state
- 116
Industry mix (Fortune 500 HQ in CA)
| Industry | F500 HQs | Revenue |
|---|---|---|
| Technology | 27 | $1,492B |
|
||
| Financial Services | 3 | $174B |
|
||
| Retail | 3 | $44B |
|
||
| Insurance | 3 | $26B |
|
||
| Media / Entertainment | 2 | $115B |
|
||
| Pharmaceuticals / Biotech | 2 | $62B |
|
||
Price history
+14203.8% since first listed3 events — show timeline
- 2006-09-25 Sold (Public Records) $5,650,000 Public Records
- 2004-02-24 Sold (MLS) $35,000 CRMLS
- 2004-01-14 Listed $39,500 CRMLS
Property tax history
+1.3%/yrLatest (2025): $97,016 · +3.6% YoY. Source: county tax records.
Cash-flow waterfall
monthlySold comps — $/sqft
last 12 mo · ≤1 miLoading sold comps…