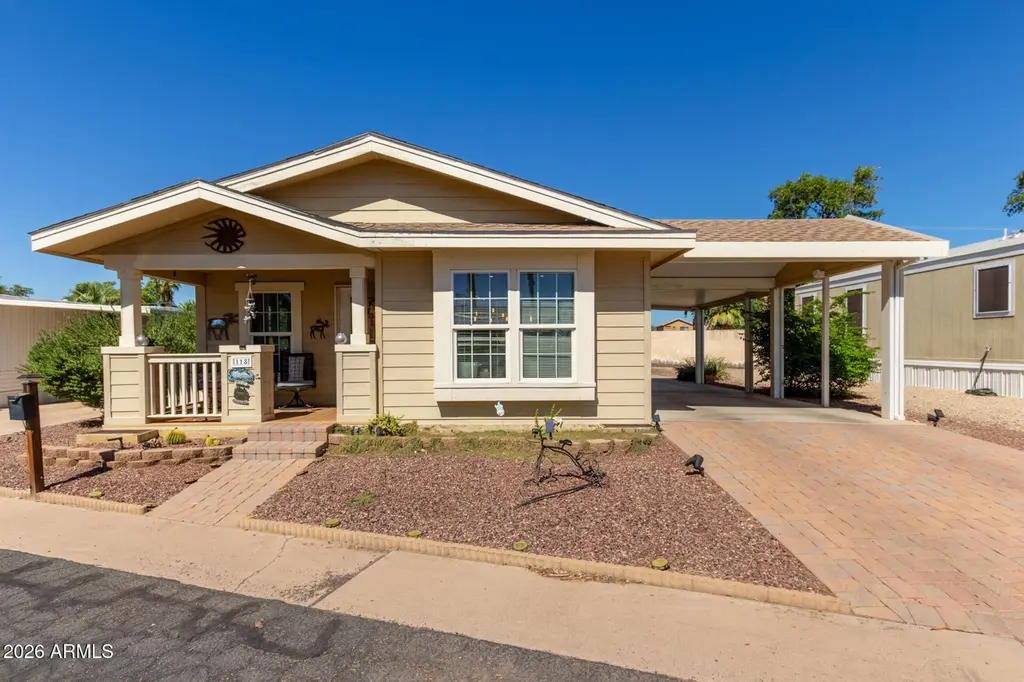
7300 N 51st Ave #118 · Glendale, AZ
Flood risk 1/10 · Minimal
- FEMA flood zone
- X (shaded)
- Chance of flooding over 30 yrs
- 0.0%
- Est. flood insurance / yr
- $507 – $1,088
Fire risk 1/10 · Minimal
- Est. fire insurance / yr
- $610 – $1,132
Heat risk 9/10 · Severe
- Hot days now (above 112°F)
- 6 days/yr
- Hot days in 30 yrs
- 17 days/yr
Wind risk 1/10 · Minimal
- Chance of severe wind over 30 yrs
- —
Air-quality risk 2/10 · Minimal
- Unhealthy air days now
- 0 days/yr
- Unhealthy air days in 30 yrs
- 1 days/yr
Risk factors via First Street. Map © Google.
Why this score? — see what drove the B- grade
The composite is a weighted blend of 9 inputs, each scored 0–100. Each bar is that input's sub-score; the figure is the points it added to the 100-point composite (weight × sub-score).
- Cash flow +30.0/30.0
- DSCR +10.0/10.0
- 1% rule +9.2/10.0
- ARV discount +7.5/15.0
- Condition / age +4.0/5.0
- Livability +3.8/5.0
- Schools +2.3/10.0
- Rent growth +1.8/5.0
- Appreciation +0.0/10.0
$105,000
🖨 Deal sheet (PDF) 📄 Offer letter ✓ Due diligence
Listing remarks
Beautifully maintained 2-bedroom, 2-bath home plus den in the desirable active adult community of Palm Shadows! Built in 2006 and offering approximately 1,300 sq ft, this charming home features vaulted ceilings, abundant natural light, and a spacious open floor plan perfect for comfortable living and entertaining. The eat-in kitchen includes a breakfast bar, refrigerator, dishwasher, built-in microwave, and electric range. The primary suite offers dual sinks, a walk-in shower, and a large walk-in closet. Washer and dryer convey! Enjoy great curb appeal and resort-style community amenities including a recreation center, fitness center, shuffleboard courts, sparkling pool, and spa. Convenient
Key facts
- Open eat-in kitchen
- Shuffleboard courts
- Spa
Tags
Property features AI
Finance
- HOA & community: Land lease with monthly fee; Land lease amount $819 monthly; Association fees include other items (see remarks); Community pool; Near bus stop; Biking/walking path
Exterior
- Parking: 2 covered parking spaces; 1 open parking space; 2 carport spaces
- Utilities: City water; Public sewer
- Home design: Manufactured/mobile housing; Leasehold property
- Construction: Painted and other construction materials; Composition roof
- Exterior features: Shed(s); Storage; Block and partial fencing; Gravel/stone front and back; City-maintained road
Interior
- Kitchen: Built-in microwave; Non-laminate countertops; Refrigerator; Dishwasher; Disposal
- Bedrooms: Up to 3 bedrooms
- Flooring: Carpet; Laminate; Tile; Wood
- Bathrooms: 2 full bathrooms
- Heating & cooling: Electric heating; Central air conditioning
- Interior features: Double vanity; No interior steps; Vaulted ceilings; 3/4 bath in master bedroom; Dual-pane windows; Storage
- Laundry & utility: Inside laundry
Neighborhood map
What this means for you Summary
Snapshot
- This is a 2-bed/2.0-bath manufactured listed at $105k. Condition is rated good.
Deal economics
- At list price, monthly cash flow is $455 ($5k/yr) — positive.
- The deal already cash-flows at list — no discount required.
- Meets the 1% rule at list price ($1k rent vs $105k).
- Recommended offer: $102k (3.0% below list) — sets the bar for market timing.
- Cap rate 11.5% vs local median 3.5% in Glendale — top-decile yield for the area; either an underpriced asset or a hidden risk that comps aren't pricing in. Stress-test before assuming the spread holds.
Location & tenants
- Location reads 76/100 on livability (#12 in AZ, #3,235 nationally) — a middle-class / working-renter tenant base. Strengths: commute A+, housing A+, amenities B; Watch: health & safety D+, crime F.
- Glendale Union High School District (4285) (urban): math 23% / reading 31% proficiency, ranked #130 of 249 in AZ (top 52%) — low school quality limits family demand, transient renter base, plan for 1-2y turnover.
- Zoned schools: Glendale High School (math 13% / reading 22%, grade F, #245 of 381 statewide, top 65%, 1,816 students, 76% FRL).
- Market conditions: Rents soft (-3.0%/yr); 215 active listings in the ZIP; 40 comparable units currently listed for rent nearby; rentals leasing fast (median 2d on market — plan ~1-2 weeks tenant-placement turnaround); 36,011 units permitted in Maricopa County in 2024 (12,801 in 5+ unit buildings).
- This rent runs 33% of the median local income ($54k/yr) — at the standard rent-burdened threshold; future hikes will face affordability resistance.
Forward outlook
- Local home prices are declining (-3.0%/yr); year-one equity from $726 of loan paydown is wiped out by about $3k of value loss. Plan a longer hold.
- Maricopa County population projected at +38% by 2050 — long-run rental-demand tailwind backs the buy-and-hold thesis.
- At projected returns (-3.0% appreciation + 0.0% rent growth), your $29k cash investment doubles in ~9 years — after that, you're playing with house money.
Negotiation context
- It's been on market 35 days — a 3% lower offer ($102k) is reasonable based on typical stale-listing flexibility.
Risks & watch-outs
- Climate carrying-cost: extreme-heat days projected 6→17/yr by 2055 (HVAC capex compounding) — expect insurance premiums to compound above CPI over the hold.
Questions for the listing agent
- It's been on market 35 days. Have you received any prior offers? Is the seller open to a 3% concession, seller financing, or rate buy-down credit?
- Is there a deadline driving the sale (1031 exchange, divorce, estate, relocation)? That informs how much negotiation room exists.
- Crime grade is F in this area — have there been break-ins, vandalism, or insurance claims at this property in the last 3 years? What carrier currently insures it and at what premium?
- What's the average days-on-market for RENTAL listings here right now (not sales)? A rising rental-DOM trend means longer vacancies and softer asking-rent achievability than the comps imply.
- What's the recent tenant-quality profile in this submarket — average credit score on applications, eviction rate, late-payment / NSF rate, and stable-employment percentage? A property-management company in the area should have these aggregated.
- How much new for-sale + rental construction is in the pipeline within 1–3 miles? Heavy new supply typically softens prices + rents 12–24 months out; constrained supply supports both.
Investment metrics
- 1% rule
- 1.42% ✓
- Cap rate
- 11.49%
- Cash-on-cash
- 18.57%
- DSCR
- 1.83
- GRM
- 5.9
CMA / ARV
- ARV (on-the-fly)
- $46,800
- Comps found
- 7
Show comp detail 7 sales within ~0.75 mi
| Address | Dist | Beds/Ba | Sqft | Sold | Price | $/sf | Match |
|---|---|---|---|---|---|---|---|
| 7300 N 51st Ave Unit G106 | 0.10mi | 2/2.0 | 1,248 (-4%) | 18mo | $45,000 | $36 | 74 |
| 7300 N 51st Ave Unit G132 | 0.10mi | 2/2.0 | 1,248 (-4%) | 24mo | $46,000 | $37 | 69 |
| 7300 N 51st Ave Unit G130 | 0.00mi | 2/2.0 | 1,152 (-11%) | 15mo | $71,000 | $62 | 69 |
| 7300 N 51st Ave Unit A259 | 0.08mi | 2/2.0 | 1,144 (-12%) | 10mo | $95,000 | $83 | 68 |
| 4800 W Ocotillo Rd #68 | 0.74mi | 2/2.0 | 1,440 (+11%) | 1mo | $37,000 | $26 | 47 |
| 4800 W Ocotillo Rd #73 | 0.73mi | 2/2.0 | 1,200 (-8%) | 11mo | $28,000 | $23 | 44 |
| 4800 W Ocotillo Rd #74 | 0.73mi | 2/2.0 | 1,200 (-8%) | 14mo | $25,000 | $21 | 42 |
Match score weights: distance 35% · size 25% · config 20% · recency 20%. Top-matched comps best support the ARV.
Projected returns pro-forma
-3.0% appreciation · 0.0% rent growth · sell at horizon
- IRR
- 6.9%
- Equity multiple
- 1.26×
- Total profit
- $7,609
- Equity at exit
- $15,656
- IRR
- 13.4%
- Equity multiple
- 1.92×
- Total profit
- $27,108
- Equity at exit
- $9,078
Cash invested: $29,400 (down + closing). Projections, not guarantees.
Landlord ↔ Tenant lean methodology
- Overall (STATE)
- 87 Strongly Landlord-Friendly
- State Arizona
- 87 Strongly Landlord-Friendly · R+3
- County
- — inherits STATE
- City
- — inherits STATE
ZIP-level market 85301
- Home prices YoY
- -10.6%
- Rents YoY
- -3.0%
- Active inventory
- 215
- Price-to-rent
- 5.9×
Monthly cashflow live
- Estimated rent
- $1,494 high interval (Pro) →
- Mortgage (P&I)
- −$551
- Tax est. 1.5%
- −$131 /mo · $1,575/yr
- Insurance
- −$44
- HOA
- −$0
- Vacancy / Maint / Mgmt
- −$314
- Net cashflow
- $455
Break-even live
Sensitivity live
| Price | -10% $528 | -5% $491 | +0% $455 | +5% $419 | +10% $382 |
|---|---|---|---|---|---|
| Rent | -10% $337 | -5% $396 | +0% $455 | +5% $514 | +10% $573 |
| Rate | -1.0pp $508 | -0.5pp $482 | base $455 | +0.5pp $428 | +1.0pp $400 |
UW: 25.0% down · 7.5% · 30yr · 1.5% tax · 5.0% vac · 8.0% maint · 8.0% mgmt
Financing live
Cash to close
- Down payment
- $26,250
- Closing costs
- $3,150
- Reserves months
- —
- Total cash needed
- —
Loan-product check · same deal, 3 products live
Conventional
25% down · 7.5% · 30yr
- Down + closing
- —
- Monthly P&I
- —
- Monthly cashflow
- —
- DSCR
- —
- Eligible?
- —
Personal DTI + credit; lowest rate.
DSCR
20% down · 8.5% · 30yr
- Down + closing
- —
- Monthly P&I
- —
- Monthly cashflow
- —
- DSCR
- —
- Eligible?
- —
No personal income docs; deal must DSCR.
Hard money
10% down · 12.0% · 12mo
- Down + closing
- —
- Monthly P&I
- —
- Monthly cashflow
- —
- DSCR
- —
- Eligible?
- —
Short-term bridge; refi at stabilization.
Rent comps 40 comps
| Address | Beds | Baths | Sqft | Rent | $/sqft | DOM | Units | Dist |
|---|---|---|---|---|---|---|---|---|
| 7211 N 54th Ave Apt 4 Glendale, AZ | 2.0 | 2.0 | 1000 | $1,450 | $1.45 | 2d | 1 | 0.23mi |
| 5136 W Glenn Dr Glendale, AZ | 2.0–3.0 | 1.5 | 1090 | $1,475 | $1.35 | 2d | 5 | 0.25mi |
| 4911 W Myrtle Ave Glendale, AZ | 2.0 | 2.0 | 1360 | $1,925 | $1.42 | 2d | 3 | 0.41mi |
| 7959 N 53rd Ave Glendale, AZ | 3.0 | 2.5 | 1414 | $2,500 | $1.77 | 2d | 4 | 0.45mi |
| 4919 W Glenn Dr Glendale, AZ | 2.0 | 1.0 | 936 | $995 | $1.06 | 2d | 1 | 0.45mi |
| 5547 W Gardenia Ave Glendale, AZ | 3.0 | 1.0 | 1084 | $1,329 | $1.23 | 22d | 1 | 0.49mi |
| 4776 W Via Cynthia Glendale, AZ | 3.0 | 2.0 | 1484 | $2,000 | $1.35 | 2d | 1 | 0.53mi |
| 4828 W Orangewood Ave Glendale, AZ | 1.0 | 1.0 | 875 | $1,395 | $1.59 | 2d | 1 | 0.56mi |
| 4828 W Orangewood Ave Glendale, AZ | 3.0 | 2.5 | 1168 | $1,375 | $1.18 | 15d | 1 | 0.56mi |
| 5024 W Krall St Glendale, AZ | 3.0 | 2.0 | 1196 | $1,749 | $1.46 | 2d | 1 | 0.68mi |
| 5046 W Tuckey Ln Glendale, AZ | 3.0 | 2.0 | 1321 | $1,400 | $1.06 | 17d | 1 | 0.73mi |
| 5047 W Tuckey Ln Glendale, AZ | 3.0 | 2.0 | 1396 | $1,765 | $1.26 | 2d | 1 | 0.74mi |
| 5012 W McLellan Rd Glendale, AZ | 3.0 | 2.0 | 1058 | $1,595 | $1.51 | 18d | 1 | 0.79mi |
| 5044 W Maryland Ave Glendale, AZ | 3.0 | 1.0 | 1065 | $1,295 | $1.22 | 3d | 1 | 0.88mi |
| 4748 W Sierra Vista Dr Glendale, AZ | 2.0 | 2.0 | 875 | $1,262 | $1.44 | 22d | 1 | 0.90mi |
| 4748 W Sierra Vista Dr Glendale, AZ | 2.0 | 2.0 | 875 | $1,185 | $1.35 | 4d | 1 | 0.90mi |
| 5908 W Myrtle Ave Unit 5908 Glendale, AZ | 3.0 | 2.0 | 1053 | $1,375 | $1.31 | 2d | 1 | 0.90mi |
| 4730 W Northern Ave Glendale, AZ | 1.0–2.0 | 1.0–2.0 | 841 | $1,200 | $1.43 | 25d | 2 | 0.92mi |
| 6551 N 49th Ave Glendale, AZ | 2.0–3.0 | 2.0 | 1165 | $1,875 | $1.61 | 2d | 6 | 0.92mi |
| 4748 W Sierra Vista Dr Unit B1 Glendale, AZ | 2.0 | 2.0 | 875 | $1,170 | $1.34 | 2d | 1 | 0.92mi |
| 6550 N 47th Ave Phoenix, AZ | 2.0 | 2.0 | 1044 | $1,400 | $1.34 | 2d | 1 | 0.99mi |
| 7631 N 59th Ln Glendale, AZ | 3.0 | 1.0 | 1750 | $1,980 | $1.13 | 2d | 1 | 1.00mi |
| 7519 N 59th Ln Glendale, AZ | 3.0 | 2.0 | 1856 | $2,099 | $1.13 | 25d | 1 | 1.00mi |
| 8114 N 57th Dr Glendale, AZ | 3.0 | 2.0 | 1490 | $2,600 | $1.74 | 3d | 1 | 1.01mi |
| 4443 W Palmaire Ave Glendale, AZ | 2.0–3.0 | 2.0 | 987 | $1,595 | $1.62 | 2d | 1 | 1.01mi |
| 4439 W Palmaire Ave Glendale, AZ | 2.0–3.0 | 2.0 | 933 | $1,495 | $1.60 | 2d | 5 | 1.01mi |
| 4439 W Palmaire Ave Unit 236 Glendale, AZ | 3.0 | 2.0 | 1101 | $1,695 | $1.54 | 24d | 1 | 1.01mi |
| 4439 W Palmaire Ave Unit 245 Glendale, AZ | 3.0 | 2.0 | 995 | $1,695 | $1.70 | 4d | 1 | 1.02mi |
| 7801 N 44th Dr #1030 Glendale, AZ | 3.0 | 2.5 | 1386 | $1,695 | $1.22 | 8d | 1 | 1.06mi |
| 7801 N 44th Dr #1030 Glendale, AZ | 3.0 | 2.5 | 1386 | $1,695 | $1.22 | 2d | 1 | 1.06mi |
| 7801 N 44th Dr #1028 Glendale, AZ | 2.0 | 2.5 | 1080 | $1,395 | $1.29 | 2d | 1 | 1.07mi |
| 7801 N 44th Dr #1028 Glendale, AZ | 2.0 | 2.5 | 1080 | $1,395 | $1.29 | 5d | 1 | 1.07mi |
| 7801 N 44th Dr #1062 Glendale, AZ | 2.0 | 1.5 | 960 | $1,500 | $1.56 | 2d | 1 | 1.07mi |
| 7801 N 44th Dr Glendale, AZ | 2.0 | 2.5 | 1080 | $1,395 | $1.29 | 3d | 1 | 1.08mi |
| 7801 N 44th Dr Glendale, AZ | 2.0 | 3.0 | 1080 | $1,595 | $1.48 | 12d | 1 | 1.08mi |
| 4530 W McLellan Rd Glendale, AZ | 1.0–3.0 | 1.0 | 782 | $1,374 | $1.76 | 1d | 6 | 1.09mi |
| 6850 N 44th Ave #4 Glendale, AZ | 2.0 | 1.5 | 980 | $1,436 | $1.47 | 3d | 1 | 1.09mi |
| 6741 N 45th Ave Unit 29 Glendale, AZ | 2.0 | 1.0 | 900 | $1,195 | $1.33 | 1d | 1 | 1.10mi |
| 6814 N 44th Ave #2 Glendale, AZ | 2.0 | 1.5 | 980 | $1,436 | $1.47 | 3d | 1 | 1.11mi |
| 7801 N 44th Dr #1133 Glendale, AZ | 2.0 | 1.5 | 960 | $1,550 | $1.61 | 2d | 1 | 1.11mi |
Listing history 15 events
-
2026-06-18days on market $105,000 Active 35 DOM
-
2026-06-17pricedays on market $105,000 Active 34 DOM
-
2026-06-16days on market $108,000 Active 33 DOM
-
2026-06-15days on market $108,000 Active 32 DOM
-
2026-06-13days on market $108,000 Active 30 DOM
-
2026-06-13days on market $108,000 Active 29 DOM
-
2026-06-09days on market $108,000 Active 26 DOM
-
2026-06-08days on market $108,000 Active 25 DOM
-
2026-06-07days on market $108,000 Active 24 DOM
-
2026-06-04days on market $108,000 Active 21 DOM
-
2026-06-03days on market $108,000 Active 20 DOM
-
2026-06-02days on market $108,000 Active 19 DOM
-
2026-06-01days on market $108,000 Active 18 DOM
-
2026-05-31days on market $108,000 Active 17 DOM
-
2026-05-06$108,000 Active
ⓘ Source: listings_history table (triggers on properties + properties_extension) + one-shot
backfill from property_details.listing_events for pre-trigger history.
Climate risk First Street
- Flood 1/10 Low FEMA zone X (shaded) · 0% chance over 30 yrs
- Wildfire 1/10 Low
- Heat 9/10 Extreme 6 d/yr ≥112°F today · 17 d/yr by 30 yrs out
- Wind 1/10 Low
- Air quality 2/10 Low 0 unhealthy d/yr today · 1 by 30 yrs out
Nearby sold comps map
Loading sold comps map…
Walkable amenities ~0.75 mi
Loading nearby amenities…
Taxation est. · year 1
- Rental income
- $17,934
- − Mortgage interest
- −$5,882
- − Property taxes
- −$1,575
- − Insurance
- −$525
- − Repairs & maintenance
- −$1,435
- − Management
- −$1,435
- − Depreciation
- −$3,055
- Taxable income
- $4,028
- Est. tax owed @ 24.0%
- −$967
- After-tax cash flow
- $4,493/yr
For passive investors: Depreciation is non-cash, so a rental often shows a tax loss while cash-flowing — sheltering income. Rental losses are passive: they offset passive income freely, and up to $25,000/yr can offset ordinary (W-2) income if you actively participate and your MAGI is under $100k (phasing out to $0 by $150k); unused losses carry forward. On sale, claimed depreciation is recaptured at up to 25%, and gains may owe capital-gains tax (a 1031 exchange can defer both). Figures are a year-1 estimate at your 24.0% rate — not tax advice; consult a CPA.
Condition & rehab AI · 28 photos
This well-maintained 2-bedroom, 2-bath home in Palm Shadows offers a good condition with minimal repairs needed. It's move-in ready with a good curb appeal and potential for value increases through minor exterior updates and landscaping improvements.
Value-add opportunities
- Resale Paint exterior trim — Fresh paint can enhance curb appeal and home value.
- Rental Replace air filters — Clean air filters improve air quality and reduce HVAC maintenance costs.
- Both Landscaping improvements — Enhanced landscaping can boost curb appeal and attract more potential buyers/tenants.
Renovation cost estimate screening
Value-add ROI direction
- Resale Paint exterior trim — Fresh paint can enhance curb appeal and home value. ↑
- Rental Replace air filters — Clean air filters improve air quality and reduce HVAC maintenance costs. ↑
- Both Landscaping improvements — Enhanced landscaping can boost curb appeal and attract more potential buyers/tenants. ↑
ⓘ Cost ranges are severity-bucket heuristics (US national rule-of-thumb). Get contractor quotes + a written scope before underwriting a rehab budget.
Schools (NCES district)
- District
- Glendale Union High School District (4285)
- NCES district ID
- 0403450
- Math proficiency
- 23% ▼ -38.00%
- Reading proficiency
- 31% ▼ -19.00%
- Median HH income
- $40,846
- Composite
- 22.81/100
- National rank
- #8020
- State rank
- #130 of 249 in AZ
Livability — Glendale
- Score
- 76/100
- State rank
- #12
- US rank
- #3235
Category grades
Schools grade is shown separately in the Schools card above.
Census & demographics
- Census place
- Glendale, AZ
- County
- Maricopa County · 4,537,380 people
- City population
- 294,586
- Metro
- Phoenix-Mesa-Chandler, AZ
- Population (ZIP)
- 68,178
- Household income
- $53,827
- Rent vs Own
- Severe rent burden
- 3741.0
Population outlook (Maricopa County) Hauer SSP2
- Today (2025)
- 4,979,203 people
- By 2030
- 5,378,229 · +8.0%
- By 2040
- 6,156,598 · +23.6%
- By 2050
- 6,872,376 · +38.0%
- By 2075
- 8,401,270 · +68.7%
- By 2100
- 9,247,439 · +85.7%
Race, ethnicity, and origin ACS 2023
- Neighborhood character
- Majority Hispanic (63%)
- Race & ethnicity
- Hispanic / Latino 63% Two or more races 37% White 22% Black 8% Asian 2% Native American 2%
- Hispanic origin (detail)
- Mexican 57% Cuban 1%
- Common ancestry
- Slovak 1% Italian 1%
- Foreign-born
- 26% · Canada, Vietnam, Philippines
- Languages at home
- 46% English-only · Spanish 48% Arabic 1% Other Indo-European 1%
Political lean MEDSL · Maricopa
- 2024 margin
- Toss-up / Even · D 47.7% · R 51.2% · Other 1.1%
- 2008→2024 swing
- +7.1pp toward D · 2008: -10.6pp · 2024: -3.5pp
- All cycles
- 2024: R+3.5 2020: D+2.2 2016: R+3.5 2012: R+12.0 2008: R+10.6
Not yet ingested
- Civics
- —
Market trends
- HPI YoY
- ▼ -50.49%
- Current HPI
- 427.3069
- Rent YoY
- ▼ -2.98%
- Metro
- Phoenix-Mesa-Chandler, AZ
- State GDP YoY
- ▲ 4.54%
- F500 in state
- 20
Industry mix (Fortune 500 HQ in AZ)
| Industry | F500 HQs | Revenue |
|---|---|---|
| Technology | 2 | $13B |
|
||
| Mining / Metals | 1 | $23B |
|
||
| Environmental Services | 1 | $16B |
|
||
| Metals / Steel | 1 | $14B |
|
||
| Technology Distribution | 1 | $9B |
|
||
| Homebuilding | 1 | $8B |
|
||
Price history
1 event — show timeline
- 2026-05-06 Listed $108,000 ARMLS
Cash-flow waterfall
monthlySold comps — $/sqft
last 12 mo · ≤1 miLoading sold comps…