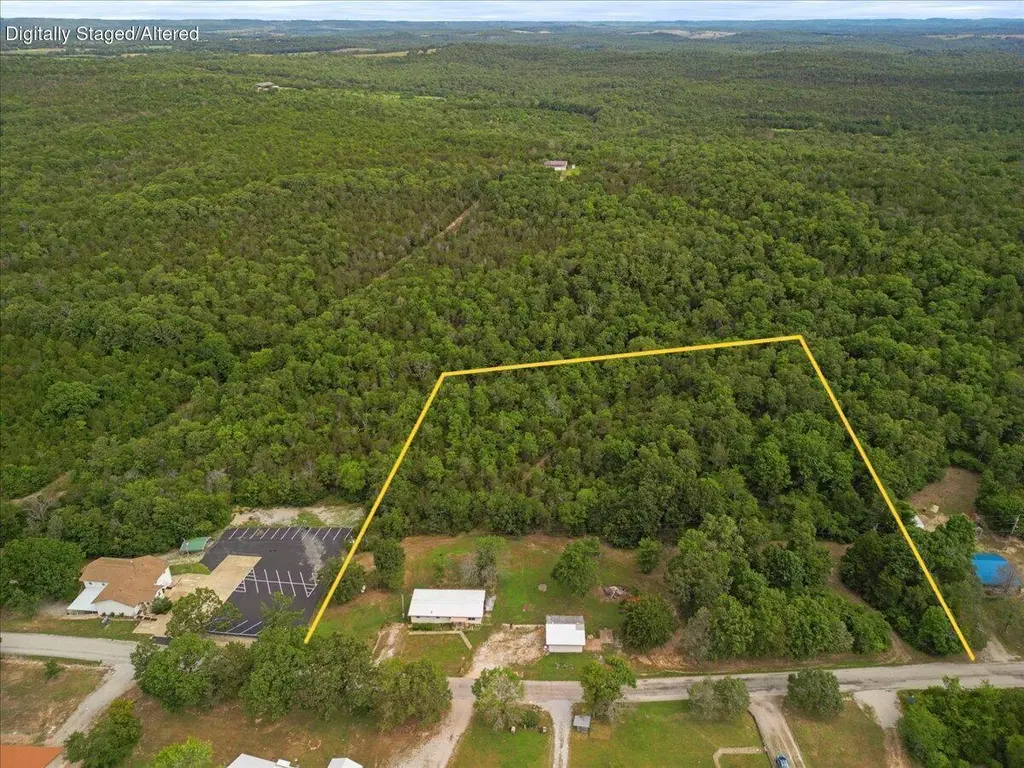
225 Clarkson Rd · Diamond City, AR
Flood risk 1/10 · Minimal
- FEMA flood zone
- X (unshaded)
- Chance of flooding over 30 yrs
- 0.0%
- Est. flood insurance / yr
- $473 – $860
Fire risk 3/10 · Minor
- Est. fire insurance / yr
- $1,054 – $1,958
Heat risk 4/10 · Minor
- Hot days now (above 107°F)
- 7 days/yr
- Hot days in 30 yrs
- 19 days/yr
Wind risk 2/10 · Minimal
- Chance of severe wind over 30 yrs
- 1.0%
Air-quality risk 1/10 · Minimal
- Unhealthy air days now
- 0 days/yr
- Unhealthy air days in 30 yrs
- 0 days/yr
Risk factors via First Street. Map © Google.
Why this score? — see what drove the B grade
The composite is a weighted blend of 9 inputs, each scored 0–100. Each bar is that input's sub-score; the figure is the points it added to the 100-point composite (weight × sub-score).
- Cash flow +28.2/30.0
- DSCR +10.0/10.0
- ARV discount +7.5/15.0
- 1% rule +6.5/10.0
- Appreciation +5.9/10.0
- Schools +5.6/10.0
- Livability +3.4/5.0
- Rent growth +2.5/5.0
- Condition / age +2.5/5.0
$99,900
🖨 Deal sheet 📄 Offer letter ✓ Due diligence
Listing remarks MLS
Great location for a vacation or rental property or for a permanent residence. Zoned agriculture, this property located less than 2 miles from Bull Shoals Lake and a public boat landing, is the perfect getaway investment. There is a manufactured home on the property that is livable but needs lots of work, Land has a slight roll with enough open land for a cow or horse and there is already a chicken coop in place. The garage has electric as well as there is an additional power pole and electric on the adjoining lot. The property has a private well and septic and is located beside a church with woods on 2 sides. Easy access on blacktop road. Call for showing. Motivated seller.
Key facts
- Private well
- 4.39 acres ml
- Private septic
Tags
Property features AI
Exterior
- Parking: 2-car garage; Driveway with gravel surface
- Utilities: Private water source; Private sewer (septic tank); Propane for home utilities
- Home design: Manufactured home on land; Single-story
- Construction: Block foundation; Manufactured house
- Exterior features: Rain gutters; Deck; Few trees on the lot; Chip-and-seal road frontage on a county road; Horses allowed
Interior
- Kitchen: Gas oven; Microwave; Refrigerator
- Bathrooms: 1 full bathroom
- Heating & cooling: Propane forced-air heating; Central air conditioning
- Interior features: Gas water heater; Microwave; Refrigerator
Neighborhood map
What this means for you Summary
Snapshot
- This is a 3-bed/1.0-bath manufactured listed at $100k.
Deal economics
- At list price, monthly cash flow is $317 ($4k/yr) — positive.
- The deal already cash-flows at list — no discount required.
- Meets the 1% rule at list price ($1k rent vs $100k).
- Cap rate 10.1% vs local median 2.4% in Diamond City — top-decile yield for the area; either an underpriced asset or a hidden risk that comps aren't pricing in. Stress-test before assuming the spread holds.
Location & tenants
- Location reads 67/100 on livability (#107 in AR) — a middle-class / working-renter tenant base. Strengths: crime A+, cost of living A+, housing A+; Watch: amenities F, commute F, employment F.
- Mark Twain R-VIII (rural): math 80% / reading 50% proficiency, ranked #26 of 535 in MO (top 5%) — acceptable for families but not a draw, mixed tenant base, ~2y average lease.
- Zoned schools: Mark Twain Elem. (math 70% / reading 70%, grade A-, #28 of 1,115 statewide, top 3%, 60 students, 62% FRL).
- Market conditions: 22 active listings in the ZIP; 331 units permitted in Taney County in 2024 (50 in 5+ unit buildings).
Forward outlook
- In year one you build about $2k of equity ($691 loan paydown + $2k appreciation (1.8% local appreciation)).
- Taney County population projected at +17% by 2050 — long-run rental-demand tailwind backs the buy-and-hold thesis.
- At projected returns (1.8% appreciation + 3.0% rent growth), your $28k cash investment doubles in ~5 years — after that, you're playing with house money.
Negotiation context
- Only 9 days on market — expect competitive offers; lowballing is unlikely to land.
- 3 sale attempts since 2y ago with the ask held roughly flat each time — persistent listings suggest the price (not the market) is what's stuck; bring a comps-based counter.
Questions for the listing agent
- Built in 1975 — when were the roof, HVAC, electrical panel, plumbing, and water heater last replaced?
- Is there a deadline driving the sale (1031 exchange, divorce, estate, relocation)? That informs how much negotiation room exists.
- Schools are F-rated, which usually means shorter tenancies and higher turnover. Who's the typical renter profile here, and what's been the actual vacancy rate?
- What's the average days-on-market for RENTAL listings here right now (not sales)? A rising rental-DOM trend means longer vacancies and softer asking-rent achievability than the comps imply.
- What's the recent tenant-quality profile in this submarket — average credit score on applications, eviction rate, late-payment / NSF rate, and stable-employment percentage? A property-management company in the area should have these aggregated.
- How much new for-sale + rental construction is in the pipeline within 1–3 miles? Heavy new supply typically softens prices + rents 12–24 months out; constrained supply supports both.
Investment metrics
- 1% rule
- 1.15% ✓
- Cap rate
- 10.10%
- Cash-on-cash
- 13.59%
- DSCR
- 1.60
- GRM
- 7.2
CMA / ARV
No comps found within radius.
Projected returns pro-forma
1.78% appreciation · 3.0% rent growth · sell at horizon
- IRR
- 17.4%
- Equity multiple
- 1.92×
- Total profit
- $25,872
- Equity at exit
- $38,223
- IRR
- 19.8%
- Equity multiple
- 3.57×
- Total profit
- $72,021
- Equity at exit
- $54,150
Cash invested: $27,972 (down + closing). Projections, not guarantees.
Landlord ↔ Tenant lean methodology
- Overall (STATE)
- 92 Strongly Landlord-Friendly
- State Arkansas
- 92 Strongly Landlord-Friendly · R+14
- County
- — inherits STATE
- City
- — inherits STATE
ZIP-level market 65733
- Home prices YoY
- 0.5%
- Active inventory
- 22
- Price-to-rent
- 7.2×
Monthly cashflow live
- Estimated rent
- $1,152 medium interval (Pro) →
- Mortgage (P&I)
- −$524
- Tax from tax record
- −$28 /mo · $334/yr
- Insurance
- −$42
- HOA
- −$0
- Vacancy / Maint / Mgmt
- −$242
- Net cashflow
- $317
Break-even live
UW: 25.0% down · 7.5% · 30yr · 1.5% tax · 5.0% vac · 8.0% maint · 8.0% mgmt
Financing live
Cash to close
- Down payment
- $24,975
- Closing costs
- $2,997
- Reserves months
- —
- Total cash needed
- —
Loan-product check · same deal, 3 products live
Conventional
25% down · 7.5% · 30yr
- Down + closing
- —
- Monthly P&I
- —
- Monthly cashflow
- —
- DSCR
- —
- Eligible?
- —
Personal DTI + credit; lowest rate.
DSCR
20% down · 8.5% · 30yr
- Down + closing
- —
- Monthly P&I
- —
- Monthly cashflow
- —
- DSCR
- —
- Eligible?
- —
No personal income docs; deal must DSCR.
Hard money
10% down · 12.0% · 12mo
- Down + closing
- —
- Monthly P&I
- —
- Monthly cashflow
- —
- DSCR
- —
- Eligible?
- —
Short-term bridge; refi at stabilization.
Listing history 7 events
-
2026-06-18days on market $99,900 Active 9 DOM
-
2026-06-17days on market $99,900 Active 8 DOM
-
2026-06-16days on market $99,900 Active 7 DOM
-
2026-06-15days on market $99,900 Active 6 DOM
-
2026-06-13days on market $99,900 Active 4 DOM
-
2026-06-12remarks 699-char remark
-
2026-06-12$99,900 Active 3 DOM
ⓘ Source: listings_history table (triggers on properties + properties_extension) + one-shot
backfill from property_details.listing_events for pre-trigger history.
Tax reassessment forecast AR · Resets to sale price
- Current annual tax
- $334 · $28/mo
- Projected year-2 tax
- $639 · $53/mo
- Expected delta
- +$305/yr (+$25/mo · 91.3%)
ⓘ Screening estimate from a state-policy table — verify with the county assessor before closing.
Climate risk First Street
- Flood 1/10 Low FEMA zone X (unshaded) · 0% chance over 30 yrs
- Wildfire 3/10 Moderate
- Heat 4/10 Moderate 7 d/yr ≥107°F today · 19 d/yr by 30 yrs out
- Wind 2/10 Low 100% chance of damaging wind over 30 yrs
- Air quality 1/10 Low 0 unhealthy d/yr today · 0 by 30 yrs out
Nearby sold comps map
Loading sold comps map…
Walkable amenities ~0.75 mi
Loading nearby amenities…
Taxation est. · year 1
- Rental income
- $13,825
- − Mortgage interest
- −$5,596
- − Property taxes
- −$334
- − Insurance
- −$500
- − Repairs & maintenance
- −$1,106
- − Management
- −$1,106
- − Depreciation
- −$2,906
- Taxable income
- $2,277
- Est. tax owed @ 24.0%
- −$546
- After-tax cash flow
- $3,255/yr
For passive investors: Depreciation is non-cash, so a rental often shows a tax loss while cash-flowing — sheltering income. Rental losses are passive: they offset passive income freely, and up to $25,000/yr can offset ordinary (W-2) income if you actively participate and your MAGI is under $100k (phasing out to $0 by $150k); unused losses carry forward. On sale, claimed depreciation is recaptured at up to 25%, and gains may owe capital-gains tax (a 1031 exchange can defer both). Figures are a year-1 estimate at your 24.0% rate — not tax advice; consult a CPA.
Schools (NCES district)
- District
- Mark Twain R-VIII
- NCES district ID
- 2920340
- Math proficiency
- 80% ▲ 50.00%
- Reading proficiency
- 50% ▲ 20.00%
- Median HH income
- $39,169
- Composite
- 55.65/100
- National rank
- #2644
- State rank
- #26 of 535 in MO
Livability — Diamond City
- Score
- 67/100
- State rank
- #107
- US rank
- #10788
Category grades
Schools grade is shown separately in the Schools card above.
Census & demographics
- City population
- 123
- Population (ZIP)
- 725
Population outlook (Taney County) Hauer SSP2
- Today (2025)
- 59,017 people
- By 2030
- 61,235 · +3.8%
- By 2040
- 65,225 · +10.5%
- By 2050
- 68,842 · +16.6%
- By 2075
- 77,705 · +31.7%
- By 2100
- 82,002 · +38.9%
Race, ethnicity, and origin ACS 2023
- Neighborhood character
- Predominantly White (97%)
- Race & ethnicity
- White 97% Two or more races 2%
- Common ancestry
- Lithuanian 3% Slovak 2% Serbian 1%
- Foreign-born
- 0%
Political lean MEDSL · Taney
- 2024 margin
- Solid R (+59.3) · D 19.9% · R 79.2%
- 2008→2024 swing
- -22.2pp toward R · 2008: -37.2pp · 2024: -59.3pp
- All cycles
- 2024: R+59.3 2020: R+57.7 2016: R+59.3 2012: R+47.4 2008: R+37.2
Not yet ingested
- Civics
- —
Market trends
- HPI YoY
- ▲ 1.78%
- Current HPI
- 331.8995
- Rent YoY
- —
- Metro
- —
- State GDP YoY
- ▲ 3.80%
- F500 in state
- 10
Industry mix (Fortune 500 HQ in AR)
| Industry | F500 HQs | Revenue |
|---|---|---|
| Retail | 1 | $681B |
|
||
| Food / Agriculture | 1 | $53B |
|
||
| Retail / Energy | 1 | $22B |
|
||
| Transportation / Logistics | 1 | $12B |
|
||
| Energy | 1 | $4B |
|
||
Price history
+25.0% since first listed9 events — show timeline
- 2026-06-08 Listed $99,900 SOMO
- 2024-08-26 Sold (MLS) — SOMO
- 2024-08-26 Sold (MLS) — MARIS as Distributed by MLS Grid
- 2024-08-07 Pending — SOMO
- 2024-08-07 Pending — MARIS as Distributed by MLS Grid
- 2024-07-15 Listed $79,900 MARIS as Distributed by MLS Grid
- 2024-07-13 Listed $79,900 SOMO
- 2017-02-03 Sold (Public Records) — Public Records
- 1977-04-26 Sold (Public Records) — Public Records
Property tax history
+2.0%/yrLatest (2025): $334 · -6.0% YoY. Source: county tax records.
Cash-flow waterfall
monthlySold comps — $/sqft
last 12 mo · ≤1 miLoading sold comps…