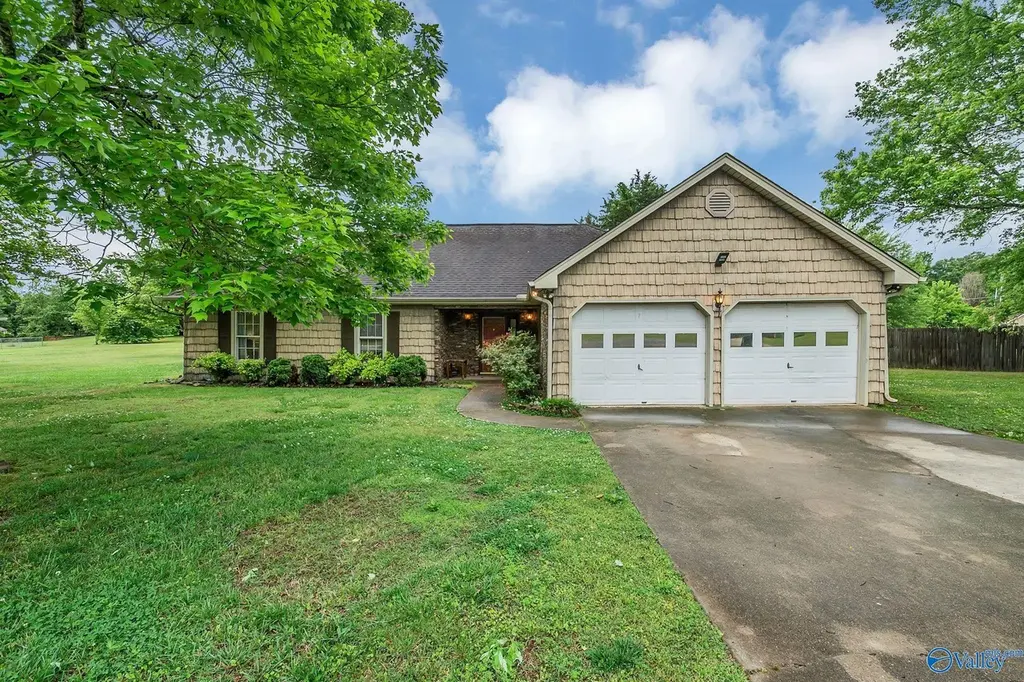
108 Willowvalley Dr · Harvest, AL
Flood risk 1/10 · Minimal
- FEMA flood zone
- X (unshaded)
- Chance of flooding over 30 yrs
- 0.0%
- Est. flood insurance / yr
- $507 – $1,088
Fire risk 3/10 · Minor
- Est. fire insurance / yr
- $916 – $1,700
Heat risk 5/10 · Moderate
- Hot days now (above 105°F)
- 7 days/yr
- Hot days in 30 yrs
- 19 days/yr
Wind risk 4/10 · Minor
- Chance of severe wind over 30 yrs
- 19.0%
Air-quality risk 1/10 · Minimal
- Unhealthy air days now
- 0 days/yr
- Unhealthy air days in 30 yrs
- 0 days/yr
Risk factors via First Street. Map © Google.
Why this score? — see what drove the D+ grade
The composite is a weighted blend of 9 inputs, each scored 0–100. Each bar is that input's sub-score; the figure is the points it added to the 100-point composite (weight × sub-score).
- ARV discount +15.0/15.0
- Cash flow +14.2/30.0
- DSCR +4.3/10.0
- Schools +3.7/10.0
- Livability +3.6/5.0
- 1% rule +2.7/10.0
- Rent growth +2.7/5.0
- Condition / age +2.5/5.0
- Appreciation +0.0/10.0
$235,000
🖨 Deal sheet 📄 Offer letter ✓ Due diligence
Listing remarks MLS
Now available for purchase! This home boasts over 1500 sqft and has 3 bedrooms and 2 bathrooms. Recent updates include new hand scraped floors, granite, paint and stainless steel appliances. There is a huge patio deck perfect for entertaining.
Key facts
- Stylish kitchen
- Granite countertops
- Oversized backyard
Tags
Property features AI
Finance
- HOA & community: No homeowners association; Subdivision: Harvest Place
Exterior
- Parking: Two-car garage
- Utilities: Septic tank for sewer
- Home design: Single-family residence; One story; Built in 1991; Residential property
- Construction: Slab foundation
- Exterior features: Patio
Interior
- Bathrooms: 2 full bathrooms
- Heating & cooling: Central heating; Central cooling
- Interior features: 8 total rooms
Neighborhood map
What this means for you Summary
Snapshot
- This is a 3-bed/1.0-bath single-family listed at $235k.
Deal economics
- At list price, monthly cash flow is $39 ($465/yr) — positive.
- The deal already cash-flows at list — no discount required.
- To meet the 1% rule (rent ≥ 1% of price), the offer needs to be $180k (23.3% below list).
- Recommended offer: $180k (23.3% below list) — sets the bar for 1% rule.
- Cap rate 6.5% vs local median 3.5% in Harvest — top-decile yield for the area; either an underpriced asset or a hidden risk that comps aren't pricing in. Stress-test before assuming the spread holds.
Location & tenants
- Location reads 72/100 on livability (#27 in AL) — a middle-class / working-renter tenant base. Strengths: crime A+, employment A+, cost of living A+; Watch: amenities F, commute F, health & safety F.
- Madison County (rural): math 27% / reading 56% proficiency, ranked #19 of 129 in AL (top 15%) — families likely to look elsewhere, expect single-tenant / working-renter base with shorter leases.
- Zoned schools: Harvest School (math 19% / reading 46%, grade F, #329 of 627 statewide, top 53%, 734 students, 54% FRL); Sparkman Middle School (math 18% / reading 53%, grade F, #81 of 257 statewide, top 33%, 859 students, 60% FRL); Sparkman High School (math 28% / reading 37%, grade F, #58 of 305 statewide, top 19%, 1,738 students, 37% FRL) — zoned schools average 50% FRL vs 29% district-wide (21 pts higher); higher-poverty schools than district average — tighter screening recommended.
- Market conditions: Rents flat; 666 active listings in the ZIP; 10 comparable units currently listed for rent nearby; rentals lingering (median 44d on market — plan ~5-8 weeks vacancy on turnover, expect pricing pressure); 50% of comp listings sitting > 30 days — soft ceiling on asking rent; solid renter incomes; 4,709 units permitted in Madison County in 2024 (1,186 in 5+ unit buildings).
Forward outlook
- Local home prices are declining (-3.0%/yr); year-one equity from $2k of loan paydown is wiped out by about $7k of value loss. Plan a longer hold.
- Madison County population projected at +18% by 2050 — long-run rental-demand tailwind backs the buy-and-hold thesis.
Negotiation context
- It's been on market 25 days — a 2% lower offer ($231k) is reasonable based on typical stale-listing flexibility.
- 2 sale attempts since 9y ago with the ask held roughly flat each time — persistent listings suggest the price (not the market) is what's stuck; bring a comps-based counter.
- Current owner paid $135k; list at $235k implies a 74% gain — meaningful room to come down on a strong offer.
Risks & watch-outs
- Climate carrying-cost: extreme-heat days projected 7→19/yr by 2055 (HVAC capex compounding) — expect insurance premiums to compound above CPI over the hold.
Questions for the listing agent
- Is there a deadline driving the sale (1031 exchange, divorce, estate, relocation)? That informs how much negotiation room exists.
- The area grade is low — what's the realistic commute time and amenity access for the typical tenant pool here? Any planned neighborhood developments (good or bad) we should know about?
- What's the average days-on-market for RENTAL listings here right now (not sales)? A rising rental-DOM trend means longer vacancies and softer asking-rent achievability than the comps imply.
- What's the recent tenant-quality profile in this submarket — average credit score on applications, eviction rate, late-payment / NSF rate, and stable-employment percentage? A property-management company in the area should have these aggregated.
- How much new for-sale + rental construction is in the pipeline within 1–3 miles? Heavy new supply typically softens prices + rents 12–24 months out; constrained supply supports both.
Investment metrics
- 1% rule
- 0.77% ✗
- Cap rate
- 6.49%
- Cash-on-cash
- 0.71%
- DSCR
- 1.03
- GRM
- 10.9
CMA / ARV
- ARV (median comp)
- $294,205
- List price
- $235,000
- Delta
- -20.12%
- Verdict
- UNDERPRICED
- Comps
- 20 within 1.0 mi
Show comp detail 12 sales within ~0.75 mi
| Address | Dist | Beds/Ba | Sqft | Sold | Price | $/sf | Match |
|---|---|---|---|---|---|---|---|
| 411 Ariel Dr NW | 0.15mi | 3/2.0 | 1,655 (+10%) | 2mo | $278,000 | $168 | 70 |
| 174 Labrador Ln | 0.46mi | 3/2.0 | 1,474 (-2%) | 4mo | $256,667 | $174 | 68 |
| 168 Labrador Ln | 0.50mi | 3/2.0 | 1,474 (-2%) | 3mo | $245,000 | $166 | 67 |
| 182 Labrador Ln | 0.54mi | 3/2.0 | 1,474 (-2%) | 6mo | $250,900 | $170 | 63 |
| 105 Labrador Ln | 0.56mi | 3/2.0 | 1,474 (-2%) | 4mo | $257,859 | $175 | 63 |
| 183 Labrador Ln | 0.54mi | 3/2.0 | 1,474 (-2%) | 7mo | $265,900 | $180 | 62 |
| 122 Labrador Ln | 0.54mi | 3/2.0 | 1,474 (-2%) | 8mo | $264,900 | $180 | 61 |
| 106 Amesbury Dr | 0.44mi | 3/2.0 | 1,672 (+11%) | 7mo | $235,000 | $141 | 50 |
| 171 Labrador Ln | 0.46mi | 4/2.0 (+1) | 1,667 (+11%) | 2mo | $259,400 | $156 | 50 |
| 200 Ariel Dr | 0.36mi | 3/2.0 | 1,295 (-14%) | 8mo | $245,000 | $189 | 49 |
| 167 Labrador Ln | 0.52mi | 4/2.0 (+1) | 1,667 (+11%) | 2mo | $259,650 | $156 | 47 |
| 118 Labrador Ln | 0.58mi | 4/2.0 (+1) | 1,667 (+11%) | 8mo | $255,800 | $153 | 39 |
Match score weights: distance 35% · size 25% · config 20% · recency 20%. Top-matched comps best support the ARV.
Projected returns pro-forma
-3.0% appreciation · 0.81% rent growth · sell at horizon
- IRR
- -17.4%
- Equity multiple
- 0.40×
- Total profit
- $-39,616
- Equity at exit
- $35,039
- IRR
- -13.4%
- Equity multiple
- 0.28×
- Total profit
- $-47,062
- Equity at exit
- $20,319
Cash invested: $65,800 (down + closing). Projections, not guarantees.
Landlord ↔ Tenant lean methodology
- Overall (STATE)
- 90 Strongly Landlord-Friendly
- State Alabama
- 90 Strongly Landlord-Friendly · R+15
- County
- — inherits STATE
- City
- — inherits STATE
ZIP-level market 35749
- Home prices YoY
- -5.4%
- Rents YoY
- 0.8%
- Active inventory
- 666
- Price-to-rent
- 10.9×
Monthly cashflow live
- Estimated rent
- $1,802 high interval (Pro) →
- Mortgage (P&I)
- −$1,232
- Tax from tax record
- −$54 /mo · $652/yr
- Insurance
- −$98
- HOA
- −$0
- Vacancy / Maint / Mgmt
- −$378
- Net cashflow
- $39
Break-even live
UW: 25.0% down · 7.5% · 30yr · 1.5% tax · 5.0% vac · 8.0% maint · 8.0% mgmt
Financing live
Cash to close
- Down payment
- $58,750
- Closing costs
- $7,050
- Reserves months
- —
- Total cash needed
- —
Loan-product check · same deal, 3 products live
Conventional
25% down · 7.5% · 30yr
- Down + closing
- —
- Monthly P&I
- —
- Monthly cashflow
- —
- DSCR
- —
- Eligible?
- —
Personal DTI + credit; lowest rate.
DSCR
20% down · 8.5% · 30yr
- Down + closing
- —
- Monthly P&I
- —
- Monthly cashflow
- —
- DSCR
- —
- Eligible?
- —
No personal income docs; deal must DSCR.
Hard money
10% down · 12.0% · 12mo
- Down + closing
- —
- Monthly P&I
- —
- Monthly cashflow
- —
- DSCR
- —
- Eligible?
- —
Short-term bridge; refi at stabilization.
Rent comps 10 comps
| Address | Beds | Baths | Sqft | Rent | $/sqft | DOM | Units | Dist |
|---|---|---|---|---|---|---|---|---|
| 348 Ariel Dr Harvest, AL | 3.0 | 2.0 | 1450 | $1,575 | $1.09 | 43d | 1 | 0.15mi |
| 102 Border Collie Dr Harvest, AL | 4.0 | 2.5 | 1891 | $2,200 | $1.16 | 13d | 1 | 0.43mi |
| 169 Labrador Ln Harvest, AL | 4.0 | 2.5 | 1753 | $1,925 | $1.10 | 13d | 1 | 0.55mi |
| 180 Labrador Ln Harvest, AL | 3.0 | 2.0 | 1260 | $1,650 | $1.31 | 43d | 1 | 0.56mi |
| 215 Farmington Dr Harvest, AL | 3.0 | 2.0 | 2250 | $1,520 | $0.68 | 13d | 1 | 1.10mi |
| 135 Wethersfield Dr Harvest, AL | 3.0 | 2.0 | 1325 | $1,295 | $0.98 | 13d | 1 | 1.13mi |
| 169 Fall Meadow Dr Harvest, AL | 4.0 | 3.0 | 2136 | $2,123 | $0.99 | 43d | 1 | 1.14mi |
| 129 Farmington Dr Harvest, AL | 3.0 | 2.5 | 1620 | $1,398 | $0.86 | 21d | 1 | 1.16mi |
| 123 Elmhurst Dr Harvest, AL | 3.0 | 2.5 | 1732 | $1,661 | $0.96 | 43d | 1 | 1.18mi |
| 108 Lockport Dr Harvest, AL | 3.0 | 3.0 | 2205 | $1,591 | $0.72 | 43d | 1 | 1.27mi |
Listing history 5 events
-
2026-05-01$235,000 Active 350-char remark
-
2018-02-21soldstatus $134,900
-
2018-02-15soldstatus $134,900 243-char remark
Show marketing remark (243 chars)
Now available for purchase! This home boasts over 1500 sqft and has 3 bedrooms and 2 bathrooms. Recent updates include new hand scraped floors, granite, paint and stainless steel appliances. There is a huge patio deck perfect for entertaining.
-
2017-11-15$135,900 243-char remark
Show marketing remark (243 chars)
Now available for purchase! This home boasts over 1500 sqft and has 3 bedrooms and 2 bathrooms. Recent updates include new hand scraped floors, granite, paint and stainless steel appliances. There is a huge patio deck perfect for entertaining.
-
2008-05-29soldstatus $121,450
ⓘ Source: listings_history table (triggers on properties + properties_extension) + one-shot
backfill from property_details.listing_events for pre-trigger history.
Tax reassessment forecast AL · Resets to sale price
- Current annual tax
- $652 · $54/mo
- Projected year-2 tax
- $964 · $80/mo
- Expected delta
- +$311/yr (+$26/mo · 47.7%)
ⓘ Screening estimate from a state-policy table — verify with the county assessor before closing.
Climate risk First Street
- Flood 1/10 Low FEMA zone X (unshaded) · 0% chance over 30 yrs
- Wildfire 3/10 Moderate
- Heat 5/10 Major 7 d/yr ≥105°F today · 19 d/yr by 30 yrs out
- Wind 4/10 Moderate 19% chance of damaging wind over 30 yrs
- Air quality 1/10 Low 0 unhealthy d/yr today · 0 by 30 yrs out
Nearby sold comps map
Loading sold comps map…
Walkable amenities ~0.75 mi
Loading nearby amenities…
Taxation est. · year 1
- Rental income
- $21,622
- − Mortgage interest
- −$13,164
- − Property taxes
- −$652
- − Insurance
- −$1,175
- − Repairs & maintenance
- −$1,730
- − Management
- −$1,730
- − Depreciation
- −$6,836
- Taxable loss
- −$3,665
- Est. tax savings @ 24.0%
- +$880
- After-tax cash flow
- $1,345/yr
For passive investors: Depreciation is non-cash, so a rental often shows a tax loss while cash-flowing — sheltering income. Rental losses are passive: they offset passive income freely, and up to $25,000/yr can offset ordinary (W-2) income if you actively participate and your MAGI is under $100k (phasing out to $0 by $150k); unused losses carry forward. On sale, claimed depreciation is recaptured at up to 25%, and gains may owe capital-gains tax (a 1031 exchange can defer both). Figures are a year-1 estimate at your 24.0% rate — not tax advice; consult a CPA.
Schools (NCES district)
- District
- Madison County
- NCES district ID
- 0102220
- Math proficiency
- 27% ▼ -32.00%
- Reading proficiency
- 56% ▼ -1.00%
- Median HH income
- $66,058
- Composite
- 37.15/100
- National rank
- #4483
- State rank
- #19 of 129 in AL
Livability — Harvest
- Score
- 72/100
- State rank
- #27
- US rank
- #5986
Category grades
Schools grade is shown separately in the Schools card above.
Census & demographics
- Census place
- Harvest, AL
- County
- Madison County · 380,832 people
- City population
- 30,710
- Metro
- Huntsville, AL
- Population (ZIP)
- 30,710
- Household income
- $103,901
- Rent vs Own
- Severe rent burden
- 174.0
Population outlook (Madison County) Hauer SSP2
- Today (2025)
- 392,086 people
- By 2030
- 409,788 · +4.5%
- By 2040
- 440,557 · +12.4%
- By 2050
- 460,990 · +17.6%
- By 2075
- 502,872 · +28.3%
- By 2100
- 513,623 · +31.0%
Race, ethnicity, and origin ACS 2023
- Neighborhood character
- Diverse neighborhood (Simpson 0.56)
- Race & ethnicity
- White 60% Black 29% Two or more races 7% Hispanic / Latino 4% Asian 2%
- Common ancestry
- Italian 2% Slovak 1% Serbian 1%
- Foreign-born
- 3% · Canada, South Korea
- Languages at home
- 95% English-only · Spanish 3% Korean 1% Other Indo-European 1%
Political lean MEDSL · Madison
- 2024 margin
- Lean R (+9.0) · D 44.7% · R 53.7% · Other 1.6%
- 2008→2024 swing
- +6.0pp toward D · 2008: -14.9pp · 2024: -9.0pp
- All cycles
- 2024: R+9.0 2020: R+8.0 2016: R+16.8 2012: R+18.7 2008: R+14.9
Not yet ingested
- Civics
- —
Market trends
- HPI YoY
- ▼ -16.54%
- Current HPI
- 291.1184
- Rent YoY
- ▲ 0.81%
- Metro
- Huntsville, AL
- State GDP YoY
- ▲ 2.94%
- F500 in state
- 4
Industry mix (Fortune 500 HQ in AL)
| Industry | F500 HQs | Revenue |
|---|---|---|
| Financial Services | 1 | $8B |
|
||
| Healthcare | 1 | $5B |
|
||
Price history
+93.5% since first listed6 events — show timeline
- 2026-05-26 Pending — VMLS
- 2026-05-01 Listed $235,000 VMLS
- 2018-02-21 Sold (Public Records) $134,900 Public Records
- 2018-02-15 Sold (MLS) $134,900 VMLS
- 2017-11-15 Listed $135,900 VMLS
- 2008-05-29 Sold (Public Records) $121,450 Public Records
Property tax history
+7.8%/yrLatest (2024): $652 · +4.1% YoY. Source: county tax records.
Cash-flow waterfall
monthlySold comps — $/sqft
last 12 mo · ≤1 miLoading sold comps…