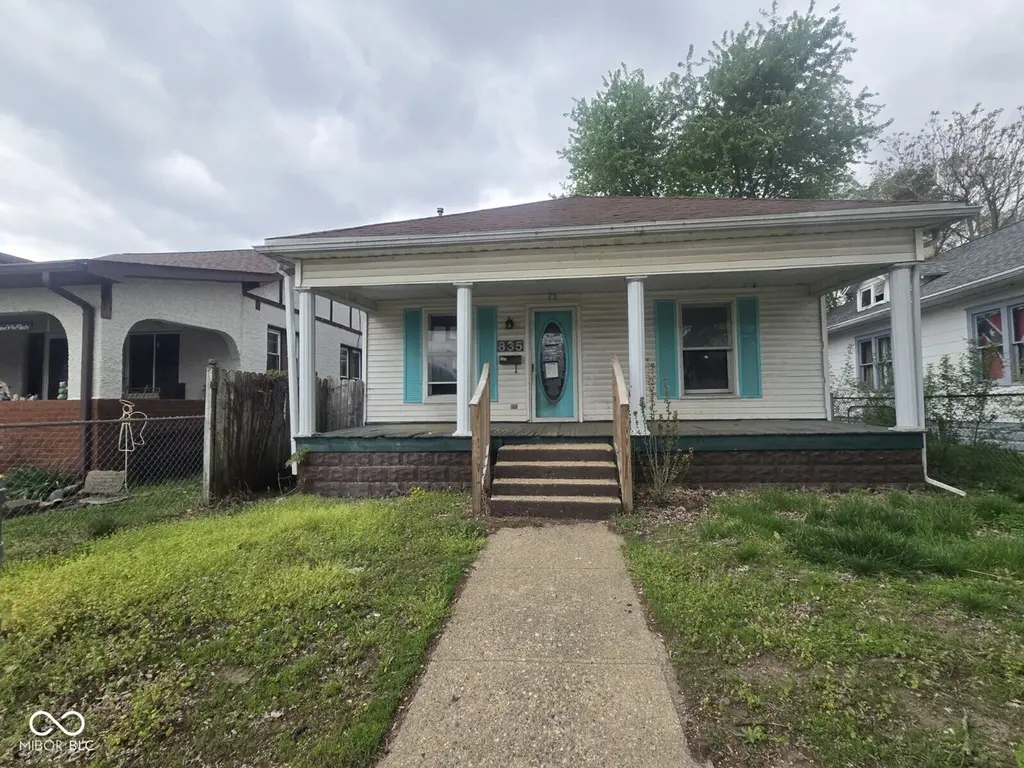
835 S 3rd St · Clinton, IN
Flood risk 6/10 · Moderate
- FEMA flood zone
- A
- Chance of flooding over 30 yrs
- 0.74%
- Est. flood insurance / yr
- $946 – $6,584
Fire risk 1/10 · Minimal
- Est. fire insurance / yr
- $717 – $1,331
Heat risk 4/10 · Minor
- Hot days now (above 105°F)
- 7 days/yr
- Hot days in 30 yrs
- 19 days/yr
Wind risk 2/10 · Minimal
- Chance of severe wind over 30 yrs
- 1.0%
Air-quality risk 3/10 · Minor
- Unhealthy air days now
- 1 days/yr
- Unhealthy air days in 30 yrs
- 3 days/yr
Risk factors via First Street. Map © Google.
Why this score? — see what drove the B grade
The composite is a weighted blend of 9 inputs, each scored 0–100. Each bar is that input's sub-score; the figure is the points it added to the 100-point composite (weight × sub-score).
- Cash flow +30.0/30.0
- 1% rule +10.0/10.0
- DSCR +10.0/10.0
- ARV discount +7.5/15.0
- Appreciation +6.0/10.0
- Schools +3.1/10.0
- Livability +3.1/5.0
- Rent growth +2.5/5.0
- Condition / age +2.5/5.0
$34,900
🖨 Deal sheet 📄 Offer letter ✓ Due diligence
Listing remarks MLS
This Bungalow style home offers 2-Bed 1-Bath located south of town, home has a covered front porch and fenced yard. Living and Dining area are shared good size kitchen with good storage and countertop. Laundry on main level as home has a full-size unfinished basement.
Key facts
- Covered front porch
- Good size kitchen
- Fenced yard
Tags
Property features AI
Exterior
- Utilities: Public water; Municipal sewer
- Home design: Single-family residence; One story
- Construction: Vinyl siding; Block foundation
- Exterior features: Lot under 1/4 acre (approximately 0.13 acres)
Interior
- Kitchen: No appliances included
- Bedrooms: 2 bedrooms on the main level
- Bathrooms: 1 full bathroom on the main level
- Heating & cooling: Forced air heating (natural gas); Central air conditioning
- Interior features: Attic access; Has basement
- Laundry & utility: Main-level laundry
Neighborhood map
What this means for you Summary
Snapshot
- This is a 2-bed/1.0-bath single-family listed at $35k.
Deal economics
- At list price, monthly cash flow is $107 ($1k/yr) — positive.
- The deal already cash-flows at list — no discount required.
- Meets the 1% rule at list price ($844 rent vs $35k).
- Recommended offer: $34k (3.0% below list) — sets the bar for market timing.
Location & tenants
- Location reads 62/100 on livability (#474 in IN) — a middle-class / working-renter tenant base. Strengths: cost of living A+, housing A+, crime B; Watch: amenities F, commute F, employment F.
- South Vermillion Community School Corporation (rural): math 31% / reading 42% proficiency, ranked #182 of 301 in IN (top 60%) — families likely to look elsewhere, expect single-tenant / working-renter base with shorter leases.
- Zoned schools: Central Elementary School (math 27% / reading 37%, grade F, #652 of 994 statewide, top 68%, 302 students, 64% FRL); South Vermillion High School (math 27% / reading 62%, grade F, #169 of 369 statewide, top 51%, 478 students, 54% FRL).
- Market conditions: 46 active listings in the ZIP; 28 units permitted in Vermillion County in 2024 (0 in 5+ unit buildings).
Forward outlook
- In year one you build about $934 of equity ($241 loan paydown + $693 appreciation (2.0% local appreciation)).
- Vermillion County population projected at -22% by 2050 — secular population decline; favor cash flow + early exit over multi-decade hold.
- At projected returns (2.0% appreciation + 3.0% rent growth), your $10k cash investment doubles in ~4 years — after that, you're playing with house money.
Negotiation context
- It's been on market 57 days — a 3% lower offer ($34k) is reasonable based on typical stale-listing flexibility.
- 3 sale attempts since 3y ago; this cycle's ask has dropped $10k (22%) from the opening price — seller is motivated, your offer sets the floor, not the list.
Risks & watch-outs
- Watch-outs: flood insurance adds $314/mo; built in 1918 — expect roof / HVAC / electrical / plumbing capex.
- Climate carrying-cost: in FEMA flood zone A (mandatory federal flood insurance) — expect insurance premiums to compound above CPI over the hold.
Questions for the listing agent
- It's been on market 57 days. Have you received any prior offers? Is the seller open to a 3% concession, seller financing, or rate buy-down credit?
- Built in 1918 — when were the roof, HVAC, electrical panel, plumbing, and water heater last replaced?
- What's the actual annual flood-insurance premium (NFIP or private), and is the property in a SFHA with mandatory coverage?
- Is there a deadline driving the sale (1031 exchange, divorce, estate, relocation)? That informs how much negotiation room exists.
- Schools are F-rated, which usually means shorter tenancies and higher turnover. Who's the typical renter profile here, and what's been the actual vacancy rate?
- What's the average days-on-market for RENTAL listings here right now (not sales)? A rising rental-DOM trend means longer vacancies and softer asking-rent achievability than the comps imply.
- What's the recent tenant-quality profile in this submarket — average credit score on applications, eviction rate, late-payment / NSF rate, and stable-employment percentage? A property-management company in the area should have these aggregated.
- How much new for-sale + rental construction is in the pipeline within 1–3 miles? Heavy new supply typically softens prices + rents 12–24 months out; constrained supply supports both.
Investment metrics
- 1% rule
- 2.42% ✓
- Cap rate
- 20.76%
- Cash-on-cash
- 51.69%
- DSCR
- 3.30
- GRM
- 3.4
CMA / ARV
- ARV (on-the-fly)
- $87,232
- Comps found
- 3
Show comp detail 3 sales within ~0.75 mi
| Address | Dist | Beds/Ba | Sqft | Sold | Price | $/sf | Match |
|---|---|---|---|---|---|---|---|
| 1141 S 3rd St | 0.22mi | 2/1.0 | 832 (+11%) | 4mo | $105,000 | $126 | 68 |
| 1402 S 5th St | 0.42mi | 2/1.0 | 844 (+12%) | 1mo | $70,000 | $83 | 59 |
| 1059 Blackman St | 0.72mi | 2/1.0 | 812 (+8%) | 2mo | $93,900 | $116 | 52 |
Match score weights: distance 35% · size 25% · config 20% · recency 20%. Top-matched comps best support the ARV.
Projected returns pro-forma
1.98% appreciation · 3.0% rent growth · sell at horizon
- IRR
- 17.8%
- Equity multiple
- 1.96×
- Total profit
- $9,398
- Equity at exit
- $13,737
- IRR
- 20.3%
- Equity multiple
- 3.72×
- Total profit
- $26,570
- Equity at exit
- $19,759
Cash invested: $9,772 (down + closing). Projections, not guarantees.
Landlord ↔ Tenant lean methodology
- Overall (STATE)
- 90 Strongly Landlord-Friendly
- State Indiana
- 90 Strongly Landlord-Friendly · R+11
- County
- — inherits STATE
- City
- — inherits STATE
ZIP-level market 47842
- Home prices YoY
- 1.0%
- Active inventory
- 46
- Price-to-rent
- 3.4×
Monthly cashflow live
- Estimated rent
- $844 medium interval (Pro) →
- Mortgage (P&I)
- −$183
- Tax from tax record
- −$48 /mo · $579/yr
- Insurance
- −$15
- Flood insurance flood zone
- −$314 /mo · $3,765/yr
- HOA
- −$0
- Vacancy / Maint / Mgmt
- −$177
- Net cashflow
- $107
Break-even live
UW: 25.0% down · 7.5% · 30yr · 1.5% tax · 5.0% vac · 8.0% maint · 8.0% mgmt
Financing live
Cash to close
- Down payment
- $8,725
- Closing costs
- $1,047
- Reserves months
- —
- Total cash needed
- —
Loan-product check · same deal, 3 products live
Conventional
25% down · 7.5% · 30yr
- Down + closing
- —
- Monthly P&I
- —
- Monthly cashflow
- —
- DSCR
- —
- Eligible?
- —
Personal DTI + credit; lowest rate.
DSCR
20% down · 8.5% · 30yr
- Down + closing
- —
- Monthly P&I
- —
- Monthly cashflow
- —
- DSCR
- —
- Eligible?
- —
No personal income docs; deal must DSCR.
Hard money
10% down · 12.0% · 12mo
- Down + closing
- —
- Monthly P&I
- —
- Monthly cashflow
- —
- DSCR
- —
- Eligible?
- —
Short-term bridge; refi at stabilization.
Listing history 19 events
-
2026-06-18days on market $34,900 Active 57 DOM
-
2026-06-17days on market $34,900 Active 56 DOM
-
2026-06-16days on market $34,900 Active 55 DOM
-
2026-06-15days on market $34,900 Active 54 DOM
-
2026-06-13days on market $34,900 Active 52 DOM
-
2026-06-12days on market $34,900 Active 51 DOM
-
2026-06-09days on market $34,900 Active 48 DOM
-
2026-06-08days on market $34,900 Active 47 DOM
-
2026-06-07days on market $34,900 Active 46 DOM
-
2026-06-07pricedays on market $34,900 Active 45 DOM
-
2026-06-04days on market $44,900 Active 42 DOM
-
2026-06-02days on market $44,900 Active 41 DOM
-
2026-06-01days on market $44,900 Active 40 DOM
-
2026-05-31days on market $44,900 Active 39 DOM
-
2026-05-31days on market $44,900 Active 38 DOM
-
2026-04-21$44,900 Active 268-char remark
Show marketing remark (268 chars)
This Bungalow style home offers 2-Bed 1-Bath located south of town, home has a covered front porch and fenced yard. Living and Dining area are shared good size kitchen with good storage and countertop. Laundry on main level as home has a full-size unfinished basement.
-
2026-04-21$44,900 Active
Show marketing remark (268 chars)
This Bungalow style home offers 2-Bed 1-Bath located south of town, home has a covered front porch and fenced yard. Living and Dining area are shared good size kitchen with good storage and countertop. Laundry on main level as home has a full-size unfinished basement.
-
2023-02-22status Pending
-
2023-02-17$75,000 Active
ⓘ Source: listings_history table (triggers on properties + properties_extension) + one-shot
backfill from property_details.listing_events for pre-trigger history.
Tax reassessment forecast IN · Partial reset (capped growth)
- Current annual tax
- $579 · $48/mo
- Projected year-2 tax
- $579 · $48/mo
- Expected delta
- $0/yr ($0/mo · 0.0%)
ⓘ Screening estimate from a state-policy table — verify with the county assessor before closing.
Climate risk First Street
- Flood 6/10 Major FEMA zone A · 74% chance over 30 yrs
- Wildfire 1/10 Low
- Heat 4/10 Moderate 7 d/yr ≥105°F today · 19 d/yr by 30 yrs out
- Wind 2/10 Low 100% chance of damaging wind over 30 yrs
- Air quality 3/10 Moderate 1 unhealthy d/yr today · 3 by 30 yrs out
Nearby sold comps map
Loading sold comps map…
Walkable amenities ~0.75 mi
Loading nearby amenities…
Taxation est. · year 1
- Rental income
- $10,128
- − Mortgage interest
- −$1,955
- − Property taxes
- −$579
- − Insurance
- −$3,940
- − Repairs & maintenance
- −$810
- − Management
- −$810
- − Depreciation
- −$1,015
- Taxable income
- $1,018
- Est. tax owed @ 24.0%
- −$244
- After-tax cash flow
- $1,041/yr
For passive investors: Depreciation is non-cash, so a rental often shows a tax loss while cash-flowing — sheltering income. Rental losses are passive: they offset passive income freely, and up to $25,000/yr can offset ordinary (W-2) income if you actively participate and your MAGI is under $100k (phasing out to $0 by $150k); unused losses carry forward. On sale, claimed depreciation is recaptured at up to 25%, and gains may owe capital-gains tax (a 1031 exchange can defer both). Figures are a year-1 estimate at your 24.0% rate — not tax advice; consult a CPA.
Schools (NCES district)
- District
- South Vermillion Community School Corporation
- NCES district ID
- 1810590
- Math proficiency
- 31% ▼ -6.00%
- Reading proficiency
- 42% ▬ 0.00%
- Median HH income
- $42,809
- Composite
- 30.87/100
- National rank
- #6123
- State rank
- #182 of 301 in IN
Livability — Clinton
- Score
- 62/100
- State rank
- #474
- US rank
- #16763
Category grades
Schools grade is shown separately in the Schools card above.
Census & demographics
- Census place
- Clinton, IN
- Population (ZIP)
- 9,675
Population outlook (Vermillion County) Hauer SSP2
- Today (2025)
- 14,605 people
- By 2030
- 13,942 · -4.5%
- By 2040
- 12,592 · -13.8%
- By 2050
- 11,381 · -22.1%
- By 2075
- 9,063 · -37.9%
- By 2100
- 7,098 · -51.4%
Race, ethnicity, and origin ACS 2023
- Neighborhood character
- Predominantly White (97%)
- Race & ethnicity
- White 97% Two or more races 3%
- Common ancestry
- Italian 2% Lithuanian 2% Iranian 1%
- Foreign-born
- 0%
Political lean MEDSL · Vermillion
- 2024 margin
- Solid R (+44.7) · D 26.6% · R 71.3% · Other 2.1%
- 2008→2024 swing
- -58.7pp toward R · 2008: 13.9pp · 2024: -44.7pp
- All cycles
- 2024: R+44.7 2020: R+40.6 2016: R+35.1 2012: R+6.8 2008: D+13.9
Not yet ingested
- Civics
- —
Market trends
- HPI YoY
- ▲ 1.98%
- Current HPI
- 201.465
- Rent YoY
- —
- Metro
- —
- State GDP YoY
- ▲ 2.90%
- F500 in state
- 18
Industry mix (Fortune 500 HQ in IN)
| Industry | F500 HQs | Revenue |
|---|---|---|
| Industrial Machinery | 2 | $37B |
|
||
| Healthcare | 1 | $177B |
|
||
| Pharmaceuticals | 1 | $45B |
|
||
| Metals / Steel | 1 | $18B |
|
||
| Agriculture | 1 | $17B |
|
||
| Packaging | 1 | $12B |
|
||
Price history
-40.1% since first listed4 events — show timeline
- 2026-04-21 Listed $44,900 MIBOR as Distributed by MLS Grid
- 2026-04-21 Listed $44,900 THAAR
- 2023-02-22 Pending — THAAR
- 2023-02-17 Listed $75,000 THAAR
Property tax history
+4.6%/yrLatest (2024): $579 · +4.1% YoY. Source: county tax records.
Cash-flow waterfall
monthlySold comps — $/sqft
last 12 mo · ≤1 miLoading sold comps…