 9-Plex
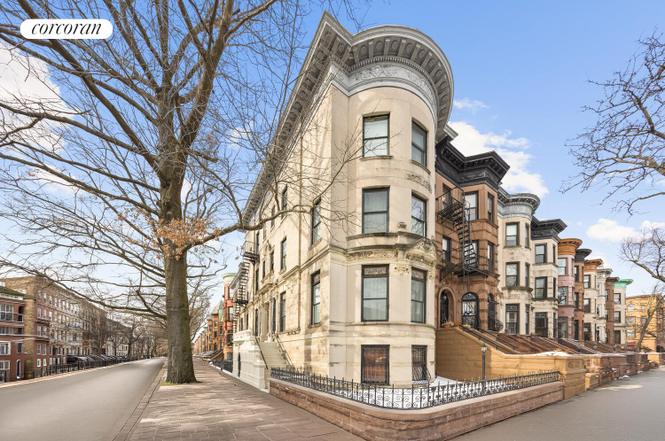
400 Stuyvesant Ave · New York, NY
Flood risk No data
- FEMA flood zone
- —
- Chance of flooding over 30 yrs
- —
- Est. flood insurance / yr
- —
Fire risk No data
- Est. fire insurance / yr
- —
Heat risk No data
- Hot days now (above threshold)
- —
- Hot days in 30 yrs
- —
Wind risk No data
- Chance of severe wind over 30 yrs
- —
Air-quality risk No data
- Unhealthy air days now
- —
- Unhealthy air days in 30 yrs
- —
Risk factors via First Street. Map © Google.
Why this score? — see what drove the A- grade
The composite is a weighted blend of 9 inputs, each scored 0–100. Each bar is that input's sub-score; the figure is the points it added to the 100-point composite (weight × sub-score).
- Cash flow +30.0/30.0
- DSCR +10.0/10.0
- Appreciation +10.0/10.0
- 1% rule +7.9/10.0
- ARV discount +7.5/15.0
- Schools +5.0/10.0
- Rent growth +4.1/5.0
- Livability +3.8/5.0
- Condition / age +2.5/5.0
$2,495,000
🖨 Deal sheet (PDF) 📄 Offer letter ✓ Due diligence
Multi-family units
County records classify this as Multi-Family (5+ Unit). Listing-text estimate: 9 units. confirmed
5+ unit building — per-unit beds/baths from public records are typically unavailable; the breakdown below (if shown) is an estimate from the listing text.
Listing remarks
Set on one of Brooklyn's most coveted tree-lined streets, this magnificent Romanesque Revival limestone stands as a testament to the craftsmanship and ambition of late 19th-century Brooklyn. Located on the namesake boulevard of the storied Stuyvesant Heights neighborhood, 400 Stuyvesant Ave commands immediate attention with its richly carved limestone facade, featuring intricate foliate corbels, ornate hood moldings, and a sweeping entry stoop that evokes the grandeur of a bygone era. Boasting 5,342 square feet and currently configured as a grand 9-unit home, the 22X75 building sits on a 22X95 corner lot on Stuyvesant Ave and Bainbridge St, both of which are historic and landmarked blocks
Key facts
- Sweeping entry stoop
- Ornate hood moldings
- 2,090 sq ft lot
Tags
Property features AI
Finance
- Other: Multi-unit property with 9 total units
- Financial info: Annual taxes listed
- HOA & community: Pets allowed in building
Exterior
- Home design: 4-story building; Entry level at ground floor
- Construction: Lot area approximately 2,090
- Exterior features: Green building; Lot dimensions approximately 95.00 x 22.00
Interior
- Bedrooms: Total of 18 rooms (includes bedrooms — room-level details not provided)
- Bathrooms: 10 full bathrooms
- Heating & cooling: Gas cooling
- Interior features: Smoke-free building; Basement present (other type)
- Laundry & utility: Washer hookup; Building laundry other
Neighborhood map
What this means for you Summary
Snapshot
- This is a 9 × 9-bed/10.0-bath units multifamily listed at $2.50M.
Deal economics
- At list price, monthly cash flow is $10k ($120k/yr) — positive. Per door: $1k/mo.
- The deal already cash-flows at list — no discount required.
- Meets the 1% rule at list price ($32k rent vs $2.50M).
- Recommended offer: $2.27M (9.0% below list) — sets the bar for market timing.
- Cap rate 11.1% vs local median 2.6% in New York — top-decile yield for the area; either an underpriced asset or a hidden risk that comps aren't pricing in. Stress-test before assuming the spread holds.
Location & tenants
- Location reads 75/100 on livability (#268 in NY, #4,188 nationally) — a middle-class / working-renter tenant base. Strengths: amenities A+, commute A+, health & safety A; Watch: crime F, cost of living F.
- Market conditions: Rents rising fast (+6.4%/yr); 152 active listings in the ZIP; 10,063 units permitted in Kings County in 2024 (9,789 in 5+ unit buildings).
- At $32,127/mo this rent would consume 618% of the median local household income ($62k/yr) (locally 6960% of renters already pay >50% of income on rent) — very limited rent-growth headroom before tenants either downsize or default.
Forward outlook
- In year one you build about $267k of equity ($17k loan paydown + $250k appreciation (10.0% local appreciation)).
- Kings County population projected at +13% by 2050 — modest demand growth; plan on rents tracking national, not racing it.
- At projected returns (10.0% appreciation + 6.4% rent growth), your $699k cash investment doubles in ~2 years — after that, you're playing with house money.
- By year 2, paydown + projected appreciation supports a ~$429k cash-out refi (75% LTV) — recoverable capital for the next deal without selling this one.
Negotiation context
- It's been on market 107 days — a 9% lower offer ($2.27M) is reasonable based on typical stale-listing flexibility.
Risks & watch-outs
- Watch-outs: built in 1910 — expect roof / HVAC / electrical / plumbing capex.
Questions for the listing agent
- It's been on market 107 days. Have you received any prior offers? Is the seller open to a 9% concession, seller financing, or rate buy-down credit?
- Can we see the unit-by-unit rent roll, current vacancy, and any below-market leases? What's the average tenancy length?
- What capital expenditures (roof, boiler, parking lot, exteriors) have been made in the last 5 years, and what's planned in the next 2?
- Built in 1910 — when were the roof, HVAC, electrical panel, plumbing, and water heater last replaced?
- Why hasn't it sold? Are there any deal-killer items the seller is aware of (foundation, flood, title, zoning, code violations)?
- Is there a deadline driving the sale (1031 exchange, divorce, estate, relocation)? That informs how much negotiation room exists.
- Schools are B-rated — typically a magnet for longer-tenancy family renters. What's the average tenant stay here, and is there a school-zone premium baked into asking?
- Crime grade is F in this area — have there been break-ins, vandalism, or insurance claims at this property in the last 3 years? What carrier currently insures it and at what premium?
- What's the average days-on-market for RENTAL listings here right now (not sales)? A rising rental-DOM trend means longer vacancies and softer asking-rent achievability than the comps imply.
- What's the recent tenant-quality profile in this submarket — average credit score on applications, eviction rate, late-payment / NSF rate, and stable-employment percentage? A property-management company in the area should have these aggregated.
- How much new apartment / multifamily construction is in the pipeline within 1–3 miles? Heavy new supply (>2% of stock underway) typically softens rents 12–24 months out; light construction supports rent growth.
Investment metrics
- 1% rule
- 1.29% ✓
- Cap rate
- 11.10%
- Cash-on-cash
- 17.18%
- DSCR
- 1.76
- GRM
- 6.5
CMA / ARV
No comps found within radius.
Projected returns pro-forma
10.0% appreciation · 6.44% rent growth · sell at horizon
- IRR
- 38.7%
- Equity multiple
- 4.02×
- Total profit
- $2,110,298
- Equity at exit
- $2,247,694
- IRR
- 34.5%
- Equity multiple
- 9.56×
- Total profit
- $5,980,252
- Equity at exit
- $4,847,236
Cash invested: $698,600 (down + closing). Projections, not guarantees.
Landlord ↔ Tenant lean methodology
- Overall (CITY)
- 0 Strongly Tenant-Friendly
- State New York
- 15 Strongly Tenant-Friendly · D+10
- County
- — inherits STATE
- City New York
- 0 Strongly Tenant-Friendly · D+34
ZIP-level market 11233
- Home prices YoY
- 2.9%
- Rents YoY
- 6.4%
- Active inventory
- 152
- Price-to-rent
- 58.2×
Monthly cashflow live
- Estimated rent
- $32,127 medium interval (Pro) →
- Mortgage (P&I)
- −$13,084
- Tax from tax record
- −$1,254 /mo · $15,046/yr
- Insurance
- −$1,040
- HOA
- −$0
- Vacancy / Maint / Mgmt
- −$6,747
- Net cashflow
- $10,003
Break-even live
Sensitivity live
| Price | -10% $11,415 | -5% $10,709 | +0% $10,003 | +5% $9,297 | +10% $8,590 |
|---|---|---|---|---|---|
| Rent | -10% $7,465 | -5% $8,734 | +0% $10,003 | +5% $11,272 | +10% $12,541 |
| Rate | -1.0pp $11,259 | -0.5pp $10,637 | base $10,003 | +0.5pp $9,356 | +1.0pp $8,699 |
9-unit breakdown (identical units grouped — click to expand)
| Units | Beds | Baths | Est. rent |
|---|---|---|---|
| 9× units | 9 | 10 | $32,130 |
| #1 | 9 | 10 | $3,570 |
| #2 | 9 | 10 | $3,570 |
| #3 | 9 | 10 | $3,570 |
| #4 | 9 | 10 | $3,570 |
| #5 | 9 | 10 | $3,570 |
| #6 | 9 | 10 | $3,570 |
| #7 | 9 | 10 | $3,570 |
| #8 | 9 | 10 | $3,570 |
| #9 | 9 | 10 | $3,570 |
| Total (9 units) | $32,127 | ||
UW: 25.0% down · 7.5% · 30yr · 1.5% tax · 5.0% vac · 8.0% maint · 8.0% mgmt
Financing live
Cash to close
- Down payment
- $623,750
- Closing costs
- $74,850
- Reserves months
- —
- Total cash needed
- —
Loan-product check · same deal, 3 products live
Conventional
25% down · 7.5% · 30yr
- Down + closing
- —
- Monthly P&I
- —
- Monthly cashflow
- —
- DSCR
- —
- Eligible?
- —
Personal DTI + credit; lowest rate.
DSCR
20% down · 8.5% · 30yr
- Down + closing
- —
- Monthly P&I
- —
- Monthly cashflow
- —
- DSCR
- —
- Eligible?
- —
No personal income docs; deal must DSCR.
Hard money
10% down · 12.0% · 12mo
- Down + closing
- —
- Monthly P&I
- —
- Monthly cashflow
- —
- DSCR
- —
- Eligible?
- —
Short-term bridge; refi at stabilization.
Listing history 17 events
-
2026-06-21days on market $2,495,000 Active 107 DOM
-
2026-06-18days on market $2,495,000 Active 104 DOM
-
2026-06-17price $2,495,000 Active 103 DOM
-
2026-06-17days on market $2,695,000 Active 103 DOM
-
2026-06-15days on market $2,695,000 Active 101 DOM
-
2026-06-13days on market $2,695,000 Active 99 DOM
-
2026-06-10days on market $2,695,000 Active 95 DOM
-
2026-06-08days on market $2,695,000 Active 94 DOM
-
2026-06-08days on market $2,695,000 Active 93 DOM
-
2026-06-04days on market $2,695,000 Active 90 DOM
-
2026-06-03days on market $2,695,000 Active 89 DOM
-
2026-06-01days on market $2,695,000 Active 87 DOM
-
2026-05-31days on market $2,695,000 Active 86 DOM
-
2026-03-06$2,695,000 Active
-
2018-10-01soldstatus $2,350,000
-
1986-05-06soldstatus $150,000
-
1986-05-06soldstatus $150,000
ⓘ Source: listings_history table (triggers on properties + properties_extension) + one-shot
backfill from property_details.listing_events for pre-trigger history.
Tax reassessment forecast NY · Partial reset (capped growth)
- Current annual tax
- $15,046 · $1,254/mo
- Projected year-2 tax
- $28,606 · $2,384/mo
- Expected delta
- +$13,560/yr (+$1,130/mo · 90.1%)
ⓘ Screening estimate from a state-policy table — verify with the county assessor before closing.
Nearby sold comps map
Loading sold comps map…
Walkable amenities ~0.75 mi
Loading nearby amenities…
Taxation est. · year 1
- Rental income
- $385,524
- − Mortgage interest
- −$139,759
- − Property taxes
- −$15,046
- − Insurance
- −$12,475
- − Repairs & maintenance
- −$30,842
- − Management
- −$30,842
- − Depreciation
- −$72,582
- Taxable income
- $83,978
- Est. tax owed @ 24.0%
- −$20,155
- After-tax cash flow
- $99,879/yr
For passive investors: Depreciation is non-cash, so a rental often shows a tax loss while cash-flowing — sheltering income. Rental losses are passive: they offset passive income freely, and up to $25,000/yr can offset ordinary (W-2) income if you actively participate and your MAGI is under $100k (phasing out to $0 by $150k); unused losses carry forward. On sale, claimed depreciation is recaptured at up to 25%, and gains may owe capital-gains tax (a 1031 exchange can defer both). Figures are a year-1 estimate at your 24.0% rate — not tax advice; consult a CPA.
Schools (NCES district)
No district data.
Livability — New York
- Score
- 75/100
- State rank
- #268
- US rank
- #4188
Category grades
Schools grade is shown separately in the Schools card above.
Census & demographics
- Census place
- New York, NY
- County
- Kings County · 2,614,986 people
- City population
- 7,731,280
- Metro
- New York-Newark-Jersey City, NY-NJ-PA
- Population (ZIP)
- 81,822
- Household income
- $62,411
- Rent vs Own
- Severe rent burden
- 6960.0
Population outlook (Kings County) Hauer SSP2
- Today (2025)
- 2,847,441 people
- By 2030
- 2,937,006 · +3.1%
- By 2040
- 3,095,491 · +8.7%
- By 2050
- 3,228,968 · +13.4%
- By 2075
- 3,321,723 · +16.7%
- By 2100
- 3,111,387 · +9.3%
Race, ethnicity, and origin ACS 2023
- Neighborhood character
- Predominantly Black (65%)
- Race & ethnicity
- Black 65% Hispanic / Latino 16% White 12% Two or more races 8% Asian 2%
- Hispanic origin (detail)
- Puerto Rican 5% Dominican 5%
- Common ancestry
- Hispanic 1% Romanian 1% Lithuanian 1%
- Foreign-born
- 25% · Canada, Mexico, China
- Languages at home
- 80% English-only · Spanish 12% French/Haitian/Cajun 3% Other Indo-European 1%
Political lean MEDSL · Kings
- 2024 margin
- Solid D (+44.0) · D 72.0% · R 28.0%
- 2008→2024 swing
- -15.5pp toward R · 2008: 59.4pp · 2024: 44.0pp
- All cycles
- 2024: D+44.0 2020: D+54.8 2016: D+61.8 2012: D+63.9 2008: D+59.4
Not yet ingested
- Civics
- —
Market trends
- HPI YoY
- ▲ 18.31%
- Current HPI
- 645.4828
- Rent YoY
- ▲ 6.44%
- Metro
- New York-Newark-Jersey City, NY-NJ-PA
- State GDP YoY
- ▲ 2.60%
- F500 in state
- 92
Industry mix (Fortune 500 HQ in NY)
| Industry | F500 HQs | Revenue |
|---|---|---|
| Financial Services | 10 | $950B |
|
||
| Consumer Goods | 9 | $162B |
|
||
| Insurance | 4 | $225B |
|
||
| Telecommunications | 2 | $144B |
|
||
| Pharmaceuticals | 2 | $112B |
|
||
| Media / Entertainment | 2 | $69B |
|
||
Price history
+1696.7% since first listed4 events — show timeline
- 2026-03-06 Listed $2,695,000 RLS at REBNY
- 2018-10-01 Sold (Public Records) $2,350,000 Public Records
- 1986-05-06 Sold (Public Records) $150,000 Public Records
- 1986-05-06 Sold (Public Records) $150,000 Public Records
Property tax history
+2.7%/yrLatest (2025): $15,046 · +6.9% YoY. Source: county tax records.
Cash-flow waterfall
monthlySold comps — $/sqft
last 12 mo · ≤1 miLoading sold comps…