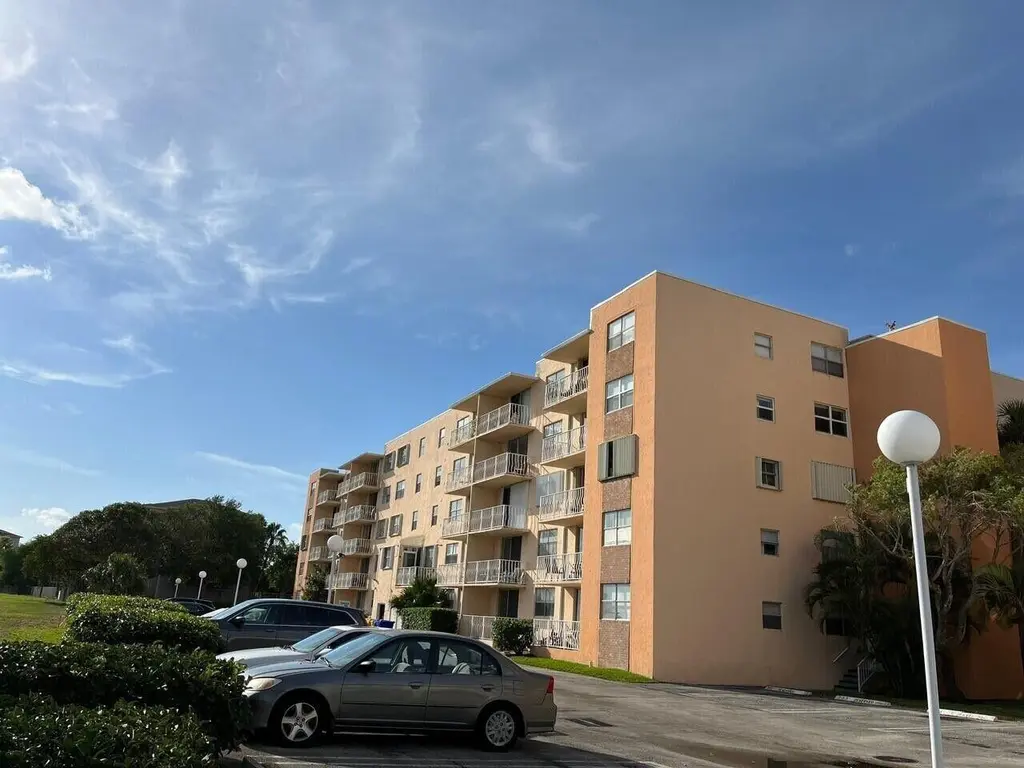
480 Executive Center Dr Unit 4a · West Palm Beach, FL
Flood risk 1/10 · Minimal
- FEMA flood zone
- X (unshaded)
- Chance of flooding over 30 yrs
- 0.0%
- Est. flood insurance / yr
- $507 – $1,088
Fire risk 1/10 · Minimal
- Est. fire insurance / yr
- $947 – $1,759
Heat risk 10/10 · Severe
- Hot days now (above 105°F)
- 7 days/yr
- Hot days in 30 yrs
- 25 days/yr
Wind risk 10/10 · Severe
- Chance of severe wind over 30 yrs
- 99.0%
Air-quality risk 2/10 · Minimal
- Unhealthy air days now
- 1 days/yr
- Unhealthy air days in 30 yrs
- 1 days/yr
Risk factors via First Street. Map © Google.
Why this score? — see what drove the B grade
The composite is a weighted blend of 9 inputs, each scored 0–100. Each bar is that input's sub-score; the figure is the points it added to the 100-point composite (weight × sub-score).
- Cash flow +30.0/30.0
- 1% rule +10.0/10.0
- DSCR +10.0/10.0
- ARV discount +7.5/15.0
- Schools +4.3/10.0
- Livability +4.1/5.0
- Rent growth +3.8/5.0
- Condition / age +2.5/5.0
- Appreciation +0.0/10.0
$206,000
🖨 Deal sheet 📄 Offer letter ✓ Due diligence
Listing remarks
2 BEDROOM APARTMENT LOCATED IN A BEAUTIFUL AND PEACEFUL NEIGHBORHOOD. CLOSE TO WEST PALM BEACH AIRPORT, CITY PLACE, BEACHES AND MALLS. NUMEROUS AMENITIES: POOL, TENNIS COURT AND AMPLE PARKING SPACES. THE AMENITIES INCLUDE POOL, BILLIARDS, SAUNA, WORK OUT EQUIPMENT, CLUBHOUSE AND BARBECUE AREA. LAUNDRY ROOMS RIGHT NEXT TO THE ELEVADOR. GATED COMMUNITY CONDOMINIUM NEXT TO A BEAUTIFUL LAKE. TILE FLOORS IN THE ENTIRE APARTMENT. BEAUTIFUL KITCHEN.
Key facts
- $493 HOA
- Parking
- Community pool
Property features AI
Finance
- Other: Pets allowed (restrictions possible)
- HOA & community: Monthly HOA with amenities including clubhouse, pool, tennis courts and community room; HOA fees billed monthly
Exterior
- Parking: 1 parking space; Asphalt parking
- Utilities: Public water; Public sewer; Cable available; Water and sewer available
- Home design: Condominium; Resale unit; Faces south; 5-story building
- Construction: Concrete/CBS construction; Concrete roof
- Exterior features: Not waterfront
Interior
- Kitchen: Electric range; Microwave; Electric water heater
- Bedrooms: 2 bedrooms on the main level
- Flooring: Tile
- Bathrooms: 2 full bathrooms on the main level
- Heating & cooling: Central electric heating; Central electric cooling (central air)
- Interior features: Custom mirrors
- Laundry & utility: Laundry closet inside unit
Neighborhood map
What this means for you Summary
Snapshot
- This is a 2-bed/2.0-bath condo listed at $206k.
Deal economics
- At list price, monthly cash flow is $1k ($13k/yr) — positive.
- The deal already cash-flows at list — no discount required.
- Meets the 1% rule at list price ($4k rent vs $206k).
- Recommended offer: $203k (1.5% below list) — sets the bar for market timing.
- Cap rate 12.5% vs local median 3.8% in West Palm Beach — top-decile yield for the area; either an underpriced asset or a hidden risk that comps aren't pricing in. Stress-test before assuming the spread holds.
Location & tenants
- Location reads 82/100 on livability (#75 in FL, #1,255 nationally) — a professional / high-income tenant draw. Strengths: commute A+, housing A+, health & safety A+; Watch: employment C-, crime F.
- Palm Beach (suburban): math 46% / reading 53% proficiency, ranked #34 of 73 in FL (top 47%) — families likely to look elsewhere, expect single-tenant / working-renter base with shorter leases.
- Zoned schools: Westward Elementary School (math 30% / reading 29%, grade F, #1,896 of 2,144 statewide, top 90%, 500 students, 81% FRL); Bear Lakes Middle School (math 19% / reading 33%, grade F, #506 of 571 statewide, top 89%, 842 students, 74% FRL); Palm Beach Lakes High School (math 17% / reading 26%, grade F, #546 of 667 statewide, top 82%, 2,688 students, 70% FRL) — zoned schools average 75% FRL vs 52% district-wide (23 pts higher); higher-poverty schools than district average — tighter screening recommended.
- Zoned-school proficiency averages 26% at this address vs 50% district-wide (-24 pts) — the specific schools serving this property underperform the Palm Beach average; the district grade overstates school quality for this exact location.
- Market conditions: Rents rising fast (+5.2%/yr); 506 active listings in the ZIP; 40 comparable units currently listed for rent nearby; rentals at typical pace (median 20d on market — plan ~3-4 weeks tenant-placement turnaround); 3,974 units permitted in Palm Beach County in 2024 (1,012 in 5+ unit buildings).
Forward outlook
- Local home prices are declining (-3.0%/yr); year-one equity from $1k of loan paydown is wiped out by about $6k of value loss. Plan a longer hold.
- Palm Beach County population projected at +30% by 2050 — long-run rental-demand tailwind backs the buy-and-hold thesis.
- At projected returns (-3.0% appreciation + 5.2% rent growth), your $58k cash investment doubles in ~5 years — after that, you're playing with house money.
Negotiation context
- It's been on market 16 days — a 2% lower offer ($203k) is reasonable based on typical stale-listing flexibility.
- 7 sale attempts since 16y ago with the ask held roughly flat each time — persistent listings suggest the price (not the market) is what's stuck; bring a comps-based counter.
- Current owner paid $140k; 47% above their basis — modest negotiation headroom, anchor on the comps not their cost.
Risks & watch-outs
- Climate carrying-cost: severe wind risk, 99% chance of damaging wind over 30y; extreme-heat days projected 7→25/yr by 2055 (HVAC capex compounding) — expect insurance premiums to compound above CPI over the hold.
Questions for the listing agent
- Built in 1979 — when were the roof, HVAC, electrical panel, plumbing, and water heater last replaced?
- What does the HOA fee cover, when was the last increase, and are there any pending special assessments or reserve-fund shortfalls?
- Any open or pending special assessments — roof, HVAC, plumbing, elevator, façade? What's the per-unit balance and payoff schedule, and is the seller paying it off at close or rolling it to the buyer?
- Is there a deadline driving the sale (1031 exchange, divorce, estate, relocation)? That informs how much negotiation room exists.
- Crime grade is F in this area — have there been break-ins, vandalism, or insurance claims at this property in the last 3 years? What carrier currently insures it and at what premium?
- What's the average days-on-market for RENTAL listings here right now (not sales)? A rising rental-DOM trend means longer vacancies and softer asking-rent achievability than the comps imply.
- What's the recent tenant-quality profile in this submarket — average credit score on applications, eviction rate, late-payment / NSF rate, and stable-employment percentage? A property-management company in the area should have these aggregated.
- How much new apartment / multifamily construction is in the pipeline within 1–3 miles? Heavy new supply (>2% of stock underway) typically softens rents 12–24 months out; light construction supports rent growth.
Investment metrics
- 1% rule
- 1.82% ✓
- Cap rate
- 12.48%
- Cash-on-cash
- 22.11%
- DSCR
- 1.98
- GRM
- 4.6
CMA / ARV
No comps found within radius.
Projected returns pro-forma
-3.0% appreciation · 5.15% rent growth · sell at horizon
- IRR
- 17.8%
- Equity multiple
- 1.74×
- Total profit
- $42,935
- Equity at exit
- $30,715
- IRR
- 28.0%
- Equity multiple
- 3.80×
- Total profit
- $161,440
- Equity at exit
- $17,811
Cash invested: $57,680 (down + closing). Projections, not guarantees.
Landlord ↔ Tenant lean methodology
- Overall (STATE)
- 87 Strongly Landlord-Friendly
- State Florida
- 87 Strongly Landlord-Friendly · R+3
- County
- — inherits STATE
- City
- — inherits STATE
ZIP-level market 33401
- Rents YoY
- 5.2%
- Active inventory
- 506
- Price-to-rent
- 4.6×
Monthly cashflow live
- Estimated rent
- $3,744 high interval (Pro) →
- Mortgage (P&I)
- −$1,080
- Tax from tax record
- −$236 /mo · $2,831/yr
- Insurance
- −$86
- HOA
- −$493
- Vacancy / Maint / Mgmt
- −$786
- Net cashflow
- $1,063
Break-even live
UW: 25.0% down · 7.5% · 30yr · 1.5% tax · 5.0% vac · 8.0% maint · 8.0% mgmt
Financing live
Cash to close
- Down payment
- $51,500
- Closing costs
- $6,180
- Reserves months
- —
- Total cash needed
- —
Loan-product check · same deal, 3 products live
Conventional
25% down · 7.5% · 30yr
- Down + closing
- —
- Monthly P&I
- —
- Monthly cashflow
- —
- DSCR
- —
- Eligible?
- —
Personal DTI + credit; lowest rate.
DSCR
20% down · 8.5% · 30yr
- Down + closing
- —
- Monthly P&I
- —
- Monthly cashflow
- —
- DSCR
- —
- Eligible?
- —
No personal income docs; deal must DSCR.
Hard money
10% down · 12.0% · 12mo
- Down + closing
- —
- Monthly P&I
- —
- Monthly cashflow
- —
- DSCR
- —
- Eligible?
- —
Short-term bridge; refi at stabilization.
Rent comps 40 comps
| Address | Beds | Baths | Sqft | Rent | $/sqft | DOM | Units | Dist |
|---|---|---|---|---|---|---|---|---|
| 290 Courtney Lakes Cir West Palm Beach, FL | 1.0–3.0 | 1.0–2.0 | 1069 | $2,705 | $2.53 | 19d | 19 | 0.46mi |
| 300 S Australian Ave #328 West Palm Beach, FL | 1.0 | 1.0 | 846 | $4,050 | $4.79 | 20d | 1 | 0.81mi |
| 300 S Australian Ave #1608 West Palm Beach, FL | 2.0 | 2.0 | 1085 | $6,000 | $5.53 | 24d | 1 | 0.81mi |
| 201 Clearwater Dr West Palm Beach, FL | 2.0 | 1.0–2.0 | 727 | $4,653 | $6.40 | 24d | 19 | 0.84mi |
| 201 Clearwater Dr West Palm Beach, FL | 2.0 | 1.0–2.0 | 731 | $6,632 | $9.07 | 11d | 16 | 0.84mi |
| 616 Clearwater Park Rd West Palm Beach, FL | 2.0 | 2.0 | 1090 | $3,348 | $3.07 | 14d | 2 | 0.91mi |
| 616 Clearwater Park Rd West Palm Beach, FL | 2.0 | 2.0 | 1090 | $3,248 | $2.98 | 11d | 3 | 0.91mi |
| 616 Clearwater Park Rd West Palm Beach, FL | 2.0 | 2.0 | 1112 | $3,348 | $3.01 | 5d | 2 | 0.91mi |
| 616 Clearwater Park Rd West Palm Beach, FL | 2.0 | 2.0 | 1130 | $3,245 | $2.87 | 3d | 3 | 0.91mi |
| 616 Clearwater Park Rd Unit Lp01 West Palm Beach, FL | 2.0 | 2.0 | 1112 | $3,495 | $3.14 | 24d | 1 | 0.93mi |
| 921 8th St West Palm Beach, FL | 3.0 | 1.0 | 1000 | $3,395 | $3.40 | 24d | 1 | 1.11mi |
| 630 S Sapodilla Ave West Palm Beach, FL | 1.0–2.0 | 1.0–2.0 | 948 | $3,950 | $4.17 | 24d | 2 | 1.18mi |
| 630 S Sapodilla Ave West Palm Beach, FL | 1.0–2.0 | 1.0–2.0 | 948 | $3,950 | $4.17 | 17d | 3 | 1.18mi |
| 720 S Sapodilla Ave #502 West Palm Beach, FL | 2.0 | 2.0 | 1120 | $3,750 | $3.35 | 24d | 1 | 1.19mi |
| 780 S Sapodilla Ave West Palm Beach, FL | 2.0 | 2.0 | 1120 | $5,125 | $4.58 | 7d | 2 | 1.21mi |
| 609 2nd St West Palm Beach, FL | 2.0 | 2.0 | 978 | $3,325 | $3.40 | 3d | 1 | 1.21mi |
| 609 2nd St West Palm Beach, FL | 2.0 | 2.0 | 978 | $3,015 | $3.08 | 18d | 1 | 1.21mi |
| 609 2nd St West Palm Beach, FL | 2.0 | 2.0 | 1063 | $3,240 | $3.05 | 24d | 1 | 1.21mi |
| 591 Evernia St West Palm Beach, FL | 2.0 | 1.0–2.0 | 943 | $6,321 | $6.70 | 3d | 26 | 1.23mi |
| 651 Okeechobee Blvd West Palm Beach, FL | 2.0 | 2.0–2.5 | 1050 | $4,050 | $3.86 | 2d | 5 | 1.26mi |
| 651 Okeechobee Blvd Unit 651 West Palm Beach, FL | 2.0 | 2.0 | 1040 | $3,000 | $2.88 | 16d | 1 | 1.26mi |
| 651 Okeechobee Blvd West Palm Beach, FL | 2.0 | 2.0–2.5 | 1050 | $3,500 | $3.33 | 22d | 2 | 1.26mi |
| 651 Okeechobee Blvd West Palm Beach, FL | 1.0–2.0 | 1.0–2.5 | 887 | $5,000 | $5.63 | 14d | 5 | 1.26mi |
| 651 Okeechobee Blvd West Palm Beach, FL | 2.0 | 2.0–2.5 | 1078 | $3,998 | $3.71 | 2d | 6 | 1.26mi |
| 651 Okeechobee Blvd West Palm Beach, FL | 2.0 | 2.0–2.5 | 1050 | $3,375 | $3.21 | 24d | 3 | 1.26mi |
| 1500 Centrepark Blvd West Palm Beach, FL | 2.0 | 1.0–2.0 | 862 | $3,002 | $3.48 | 1d | 18 | 1.28mi |
| 1050 Blanche St West Palm Beach, FL | 2.0 | 1.0–2.0 | 740 | $3,374 | $4.56 | 2d | 8 | 1.31mi |
| 550 Okeechobee Blvd Unit Uph-03 West Palm Beach, FL | 2.0 | 2.0 | 1120 | $8,000 | $7.14 | 24d | 1 | 1.38mi |
| 550 Okeechobee Blvd #504 West Palm Beach, FL | 2.0 | 2.0 | 1120 | $3,700 | $3.30 | 24d | 1 | 1.39mi |
| 550 Okeechobee Blvd #612 West Palm Beach, FL | 1.0 | 1.0 | 755 | $5,000 | $6.62 | 24d | 1 | 1.39mi |
| 550 Okeechobee Blvd #1605 West Palm Beach, FL | 2.0 | 2.0 | 1120 | $4,000 | $3.57 | 5d | 1 | 1.39mi |
| 550 Okeechobee Blvd #1409 West Palm Beach, FL | 2.0 | 2.0 | 1120 | $10,000 | $8.93 | 24d | 1 | 1.39mi |
| 550 Okeechobee Blvd #1407 West Palm Beach, FL | 2.0 | 2.0 | 1120 | $4,250 | $3.79 | 24d | 1 | 1.39mi |
| 550 Okeechobee Blvd Unit Lph-06 West Palm Beach, FL | 2.0 | 2.0 | 1120 | $8,800 | $7.86 | 24d | 1 | 1.40mi |
| 550 Okeechobee Blvd Unit Mph-16 West Palm Beach, FL | 1.0 | 1.0 | 755 | $4,800 | $6.36 | 7d | 1 | 1.40mi |
| 550 Okeechobee Blvd Unit Mph-16 West Palm Beach, FL | 1.0 | 1.0 | 755 | $4,800 | $6.36 | 24d | 1 | 1.40mi |
| 823 14th St West Palm Beach, FL | 3.0 | 1.0 | 1000 | $3,495 | $3.50 | 24d | 1 | 1.41mi |
| 480 Hibiscus St West Palm Beach, FL | 1.0–2.0 | 1.0–2.0 | 867 | $4,850 | $5.59 | 3d | 4 | 1.42mi |
| 480 Hibiscus St West Palm Beach, FL | 1.0–2.0 | 1.5–2.0 | 885 | $4,850 | $5.48 | 24d | 3 | 1.42mi |
| 499 Evernia St West Palm Beach, FL | 2.0 | 1.0–2.0 | 827 | $4,114 | $4.97 | 2d | 26 | 1.43mi |
HOA detail condo
- Monthly dues
- $493 · $5,916/yr
- Likely covers
- poolsecurity
- Assessments
- None detected in remarks — confirm with the listing agent.
Listing history 11 events
-
2026-06-18days on market $206,000 Active 16 DOM
-
2026-06-17days on market $206,000 Active 15 DOM
-
2026-06-16days on market $206,000 Active 14 DOM
-
2026-06-15days on market $206,000 Active 13 DOM
-
2026-06-13days on market $206,000 Active 11 DOM
-
2026-06-09days on market $206,000 Active 7 DOM
-
2026-06-08days on market $206,000 Active 6 DOM
-
2026-06-07days on market $206,000 Active 5 DOM
-
2026-06-04days on market $206,000 Active 2 DOM
-
2026-06-02remarks 447-char remark
-
2026-06-02$206,000 Active 1 DOM
ⓘ Source: listings_history table (triggers on properties + properties_extension) + one-shot
backfill from property_details.listing_events for pre-trigger history.
Tax reassessment forecast FL · Resets to sale price
- Current annual tax
- $2,831 · $236/mo
- Projected year-2 tax
- $2,831 · $236/mo
- Expected delta
- $0/yr ($0/mo · 0.0%)
ⓘ Screening estimate from a state-policy table — verify with the county assessor before closing.
Climate risk First Street
- Flood 1/10 Low FEMA zone X (unshaded) · 0% chance over 30 yrs
- Wildfire 1/10 Low
- Heat 10/10 Extreme 7 d/yr ≥105°F today · 25 d/yr by 30 yrs out
- Wind 10/10 Extreme 99% chance of damaging wind over 30 yrs
- Air quality 2/10 Low 1 unhealthy d/yr today · 1 by 30 yrs out
Nearby sold comps map
Loading sold comps map…
Walkable amenities ~0.75 mi
Loading nearby amenities…
Taxation est. · year 1
- Rental income
- $44,931
- − Mortgage interest
- −$11,539
- − Property taxes
- −$2,831
- − Insurance
- −$1,030
- − Repairs & maintenance
- −$3,594
- − Management
- −$3,594
- − HOA
- −$5,916
- − Depreciation
- −$5,993
- Taxable income
- $10,433
- Est. tax owed @ 24.0%
- −$2,504
- After-tax cash flow
- $10,251/yr
For passive investors: Depreciation is non-cash, so a rental often shows a tax loss while cash-flowing — sheltering income. Rental losses are passive: they offset passive income freely, and up to $25,000/yr can offset ordinary (W-2) income if you actively participate and your MAGI is under $100k (phasing out to $0 by $150k); unused losses carry forward. On sale, claimed depreciation is recaptured at up to 25%, and gains may owe capital-gains tax (a 1031 exchange can defer both). Figures are a year-1 estimate at your 24.0% rate — not tax advice; consult a CPA.
Schools (NCES district)
- District
- Palm Beach
- NCES district ID
- 1201500
- Math proficiency
- 46% ▼ -16.00%
- Reading proficiency
- 53% ▼ -4.00%
- Median HH income
- $53,943
- Composite
- 42.72/100
- National rank
- #3160
- State rank
- #34 of 73 in FL
Livability — West Palm Beach
- Score
- 82/100
- State rank
- #75
- US rank
- #1255
Category grades
Schools grade is shown separately in the Schools card above.
Census & demographics
- Census place
- West Palm Beach, FL
- County
- Palm Beach County · 1,438,312 people
- City population
- 222,012
- Metro
- Miami-Fort Lauderdale-Pompano Beach, FL
- Population (ZIP)
- 33,698
- Household income
- $67,967
- Rent vs Own
- Severe rent burden
- 2953.0
Population outlook (Palm Beach County) Hauer SSP2
- Today (2025)
- 1,637,487 people
- By 2030
- 1,743,255 · +6.5%
- By 2040
- 1,948,712 · +19.0%
- By 2050
- 2,132,979 · +30.3%
- By 2075
- 2,530,027 · +54.5%
- By 2100
- 2,706,979 · +65.3%
Race, ethnicity, and origin ACS 2023
- Neighborhood character
- Diverse neighborhood (Simpson 0.68)
- Race & ethnicity
- White 43% Black 32% Hispanic / Latino 17% Two or more races 11% Asian 3%
- Hispanic origin (detail)
- Mexican 2% Puerto Rican 3% Cuban 3%
- Common ancestry
- Hispanic 6% Slovak 2% Romanian 2%
- Foreign-born
- 26% · Canada, Jamaica, China
- Languages at home
- 73% English-only · Spanish 13% French/Haitian/Cajun 7% Other Asian/Pacific 2%
Political lean MEDSL · Palm Beach
- 2024 margin
- Toss-up / Even · D 50.0% · R 49.2%
- 2008→2024 swing
- -22.1pp toward R · 2008: 22.9pp · 2024: 0.8pp
- All cycles
- 2024: D+0.8 2020: D+12.8 2016: D+15.3 2012: D+17.0 2008: D+22.9
Not yet ingested
- Civics
- —
Market trends
- HPI YoY
- ▼ -324.96%
- Current HPI
- 367.0978
- Rent YoY
- ▲ 5.15%
- Metro
- Miami-Fort Lauderdale-Pompano Beach, FL
- State GDP YoY
- ▲ 3.28%
- F500 in state
- 36
Industry mix (Fortune 500 HQ in FL)
| Industry | F500 HQs | Revenue |
|---|---|---|
| Industrial Technology | 2 | $29B |
|
||
| Insurance | 2 | $17B |
|
||
| Retail | 1 | $60B |
|
||
| Technology Distribution | 1 | $58B |
|
||
| Homebuilding | 1 | $35B |
|
||
| Technology Manufacturing | 1 | $35B |
|
||
Price history
+274.5% since first listed24 events — show timeline
- 2026-06-02 Listed $206,000 Beaches MLS
- 2025-06-22 Listing Removed — Beaches MLS
- 2025-05-01 Rental Removed $1,800 RMLSFL
- 2025-03-30 Price Changed $1,800 RMLSFL
- 2025-03-07 Listed $230,000 Beaches MLS
- 2025-02-23 Listed for Rent $2,000 RMLSFL
- 2023-07-25 Listing Removed — Beaches MLS
- 2023-05-28 Price Changed $228,000 Beaches MLS
- 2023-05-01 Price Changed $241,000 Beaches MLS
- 2023-04-24 Listed $228,000 Beaches MLS
- 2023-04-11 Coming Soon — Beaches MLS
- 2021-10-05 Sold (Public Records) $139,900 Public Records
- 2021-09-29 Sold (MLS) $139,900 Beaches MLS
- 2021-08-26 Pending — Beaches MLS
- 2021-08-22 Listed $139,900 Beaches MLS
- 2013-10-29 Sold (Public Records) $66,000 Public Records
- 2013-10-24 Sold (MLS) $66,000 Beaches MLS
- 2013-09-12 Pending — Beaches MLS
- 2013-07-31 Listed $75,000 Beaches MLS
- 2011-11-18 Sold (MLS) $37,500 Beaches MLS
- 2011-11-10 Listing Removed — Beaches MLS
- 2010-05-10 Listed $35,000 Beaches MLS
- 1989-06-06 Sold (Public Records) $47,000 Public Records
- 1983-07-01 Sold (Public Records) $55,000 Public Records
Property tax history
+8.4%/yrLatest (2025): $2,831 · -4.0% YoY. Source: county tax records.
Cash-flow waterfall
monthlySold comps — $/sqft
last 12 mo · ≤1 miLoading sold comps…