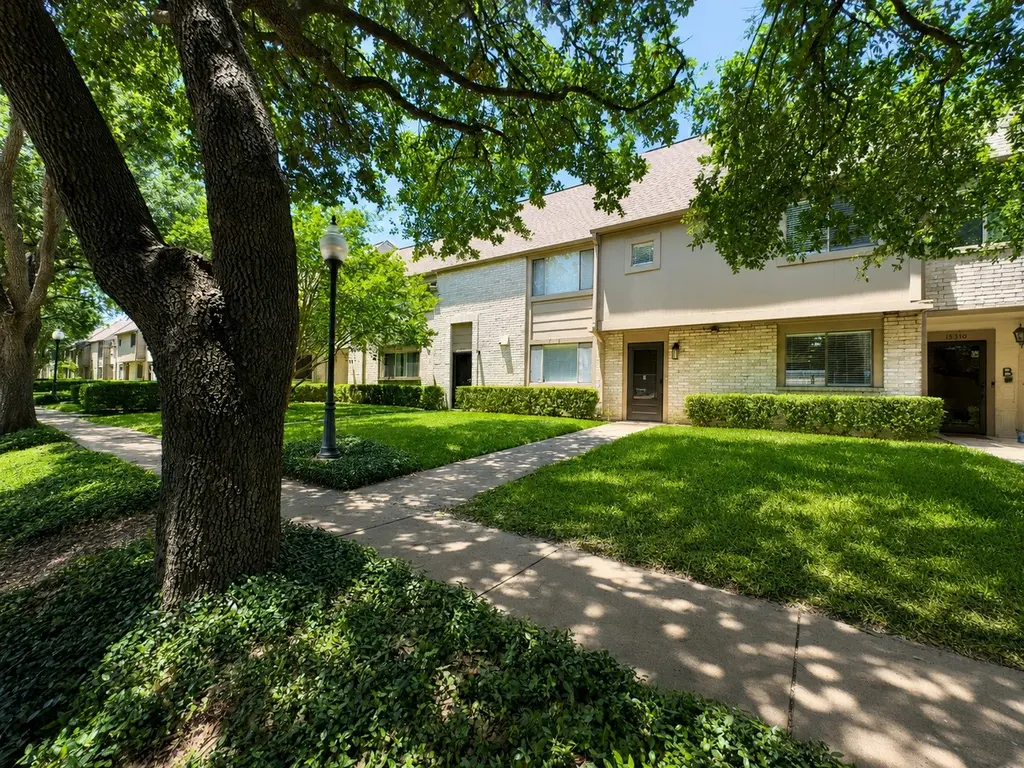
15312 Falmouth Ave #406 · Houston, TX
Flood risk 1/10 · Minimal
- FEMA flood zone
- X (unshaded)
- Chance of flooding over 30 yrs
- 0.0%
- Est. flood insurance / yr
- $507 – $1,088
Fire risk 1/10 · Minimal
- Est. fire insurance / yr
- $1,222 – $2,270
Heat risk 9/10 · Severe
- Hot days now (above 110°F)
- 7 days/yr
- Hot days in 30 yrs
- 23 days/yr
Wind risk 8/10 · Major
- Chance of severe wind over 30 yrs
- 99.0%
Air-quality risk 3/10 · Minor
- Unhealthy air days now
- 2 days/yr
- Unhealthy air days in 30 yrs
- 3 days/yr
Risk factors via First Street. Map © Google.
Why this score? — see what drove the D+ grade
The composite is a weighted blend of 9 inputs, each scored 0–100. Each bar is that input's sub-score; the figure is the points it added to the 100-point composite (weight × sub-score).
- Cash flow +16.5/30.0
- ARV discount +6.0/15.0
- 1% rule +5.3/10.0
- DSCR +5.1/10.0
- Schools +4.4/10.0
- Appreciation +4.3/10.0
- Livability +3.7/5.0
- Condition / age +2.5/5.0
- Rent growth +1.8/5.0
$199,000
🖨 Deal sheet (PDF) 📄 Offer letter ✓ Due diligence
Listing remarks MLS
HUD Case # 493-746742. Potential here. Lovely townhome at an ideal location to shops, dining. Three bedrooms, 2 full bathrooms, half bathroom. large living room, open concept to kitchen and breakfast area. All bedrooms upstairs with two full bathrooms, utility room inside, fenced in small, padded area in rear with covered parking. Better act fast on this one. See today.
Key facts
- Fully updated
- Remodeled kitchen
- Original wood floors
Tags
Property features AI
Finance
- Other: Seller disclosure available
- HOA & community: Managed by Genesis Community Mgmt Inc; Annual association fee of $350; Association fee covers common areas, grounds maintenance, structure maintenance, and trash
Exterior
- Parking: Carport
- Utilities: Public water; Public sewer
- Home design: Residential property; 2 stories; Full ownership; Entry on slab foundation
- Construction: Built in 1981; Brick and cement siding construction; Composition roof; Slab foundation
- Exterior features: Deck; Fence; Patio; Backs to greenbelt/park
Interior
- Kitchen: Dishwasher; Gas cooktop; Disposal; Ice maker; Refrigerator
- Bedrooms: 3 total rooms
- Flooring: Carpet; Wood
- Bathrooms: 2 full bathrooms; 1 half bathroom
- Heating & cooling: Central heating (electric); Central air (electric)
- Interior features: Breakfast bar; Pantry; Tub with shower; Ceiling fan(s)
- Laundry & utility: Laundry in utility room
Neighborhood map
What this means for you Summary
Snapshot
- This is a 3-bed/2.5-bath townhouse listed at $199k.
Deal economics
- At list price, monthly cash flow is $116 ($1k/yr) — positive.
- The deal already cash-flows at list — no discount required.
- Meets the 1% rule at list price ($2k rent vs $199k).
- Recommended offer: $193k (3.0% below list) — sets the bar for market timing.
- Cap rate 7.0% vs local median 3.2% in Houston — top-decile yield for the area; either an underpriced asset or a hidden risk that comps aren't pricing in. Stress-test before assuming the spread holds.
Location & tenants
- Location reads 74/100 on livability (#184 in TX, #4,771 nationally) — a middle-class / working-renter tenant base. Strengths: amenities A+, cost of living A+, housing A+; Watch: crime F.
- Cypress-Fairbanks ISD (suburban): math 45% / reading 52% proficiency, ranked #161 of 826 in TX (top 20%) — families likely to look elsewhere, expect single-tenant / working-renter base with shorter leases.
- Zoned schools: Truitt Middle (math 34% / reading 41%, grade F, #736 of 1,662 statewide, top 45%, 1,419 students, 76% FRL); Cypress Falls H S (math 52% / reading 60%, grade C, #361 of 1,632 statewide, top 22%, 2,865 students, 66% FRL) — zoned schools average 71% FRL vs 43% district-wide (28 pts higher); higher-poverty schools than district average — tighter screening recommended.
- Market conditions: Rents soft (-2.9%/yr); 505 active listings in the ZIP; 26 comparable units currently listed for rent nearby; rentals at typical pace (median 24d on market — plan ~3-4 weeks tenant-placement turnaround); solid renter incomes; 29,883 units permitted in Harris County in 2024 (8,621 in 5+ unit buildings).
- This rent runs 30% of the median local income ($81k/yr) — at the standard rent-burdened threshold; future hikes will face affordability resistance.
Forward outlook
- Local home prices are declining (-1.4%/yr); year-one equity from $1k of loan paydown is wiped out by about $3k of value loss. Plan a longer hold.
- Harris County population projected at +47% by 2050 — long-run rental-demand tailwind backs the buy-and-hold thesis.
Negotiation context
- It's been on market 39 days — a 3% lower offer ($193k) is reasonable based on typical stale-listing flexibility.
- 7 sale attempts since 2y ago with the ask held roughly flat each time — persistent listings suggest the price (not the market) is what's stuck; bring a comps-based counter.
Risks & watch-outs
- Climate carrying-cost: severe wind risk, 99% chance of damaging wind over 30y; extreme-heat days projected 7→23/yr by 2055 (HVAC capex compounding) — expect insurance premiums to compound above CPI over the hold.
Questions for the listing agent
- It's been on market 39 days. Have you received any prior offers? Is the seller open to a 3% concession, seller financing, or rate buy-down credit?
- What does the HOA fee cover, when was the last increase, and are there any pending special assessments or reserve-fund shortfalls?
- Is there a deadline driving the sale (1031 exchange, divorce, estate, relocation)? That informs how much negotiation room exists.
- Schools are D-rated, which usually means shorter tenancies and higher turnover. Who's the typical renter profile here, and what's been the actual vacancy rate?
- Crime grade is F in this area — have there been break-ins, vandalism, or insurance claims at this property in the last 3 years? What carrier currently insures it and at what premium?
- The area grade is low — what's the realistic commute time and amenity access for the typical tenant pool here? Any planned neighborhood developments (good or bad) we should know about?
- What's the average days-on-market for RENTAL listings here right now (not sales)? A rising rental-DOM trend means longer vacancies and softer asking-rent achievability than the comps imply.
- What's the recent tenant-quality profile in this submarket — average credit score on applications, eviction rate, late-payment / NSF rate, and stable-employment percentage? A property-management company in the area should have these aggregated.
- How much new for-sale + rental construction is in the pipeline within 1–3 miles? Heavy new supply typically softens prices + rents 12–24 months out; constrained supply supports both.
Investment metrics
- 1% rule
- 1.03% ✓
- Cap rate
- 6.99%
- Cash-on-cash
- 2.51%
- DSCR
- 1.11
- GRM
- 8.1
CMA / ARV
- ARV (median comp)
- $192,768
- List price
- $199,000
- Delta
- 3.23%
- Verdict
- FAIR
- Comps
- 20 within 1.0 mi
Show comp detail 12 sales within ~0.75 mi
| Address | Dist | Beds/Ba | Sqft | Sold | Price | $/sf | Match |
|---|---|---|---|---|---|---|---|
| 15312 Falmouth Ave #406 | 0.00mi | 3/2.5 | 2,024 (0%) | 6mo | $124,100 | $61 | 95 |
| 6667 Kentwick Dr Unit 2-19 | 0.15mi | 3/2.5 | 2,024 (0%) | 4mo | $180,000 | $89 | 89 |
| 15338 Falmouth Ave Unit 1/419 | 0.05mi | 3/2.5 | 2,156 (+6%) | 4mo | $209,000 | $97 | 84 |
| 6703 Kentwick Dr Unit 2/3 | 0.12mi | 3/2.5 | 2,024 (0%) | 14mo | $219,700 | $109 | 83 |
| 15353 Falmouth Ave #2 | 0.09mi | 3/2.5 | 2,156 (+6%) | 2mo | $199,900 | $93 | 83 |
| 6434 Kentwick Dr | 0.37mi | 3/2.5 | 2,024 (0%) | 0mo | $175,000 | $86 | 82 |
| 6428 Alisa Ln | 0.43mi | 3/2.5 | 2,024 (0%) | 5mo | $194,900 | $96 | 76 |
| 6496 Alisa Ln | 0.31mi | 3/2.5 | 1,948 (-4%) | 14mo | $169,900 | $87 | 68 |
| 6506 Kentwick Dr | 0.31mi | 3/2.5 | 2,156 (+6%) | 9mo | $189,500 | $88 | 67 |
| 6428 Kentwick Dr Unit 24/5 | 0.38mi | 3/2.5 | 1,840 (-9%) | 2mo | $110,000 | $60 | 65 |
| 6444 Kentwick Dr Unit 24/13 | 0.35mi | 3/2.5 | 1,840 (-9%) | 10mo | $194,900 | $106 | 60 |
| 6452 Kentwick Dr | 0.34mi | 3/2.5 | 1,728 (-15%) | 9mo | $189,000 | $109 | 52 |
Match score weights: distance 35% · size 25% · config 20% · recency 20%. Top-matched comps best support the ARV.
Projected returns pro-forma
-1.4% appreciation · 0.0% rent growth · sell at horizon
- IRR
- -7.4%
- Equity multiple
- 0.70×
- Total profit
- $-16,993
- Equity at exit
- $44,278
- IRR
- -3.5%
- Equity multiple
- 0.72×
- Total profit
- $-15,346
- Equity at exit
- $43,363
Cash invested: $55,720 (down + closing). Projections, not guarantees.
Landlord ↔ Tenant lean methodology
- Overall (STATE)
- 87 Strongly Landlord-Friendly
- State Texas
- 87 Strongly Landlord-Friendly · R+5
- County
- — inherits STATE
- City
- — inherits STATE
ZIP-level market 77084
- Home prices YoY
- -0.6%
- Rents YoY
- -2.9%
- Active inventory
- 505
- Price-to-rent
- 8.1×
Monthly cashflow live
- Estimated rent
- $2,044 high interval (Pro) →
- Mortgage (P&I)
- −$1,044
- Tax from tax record
- −$343 /mo · $4,120/yr
- Insurance
- −$83
- HOA
- −$29
- Vacancy / Maint / Mgmt
- −$429
- Net cashflow
- $116
Break-even live
Sensitivity live
| Price | -10% $229 | -5% $173 | +0% $116 | +5% $60 | +10% $4 |
|---|---|---|---|---|---|
| Rent | -10% $-45 | -5% $36 | +0% $116 | +5% $197 | +10% $278 |
| Rate | -1.0pp $217 | -0.5pp $167 | base $116 | +0.5pp $65 | +1.0pp $12 |
UW: 25.0% down · 7.5% · 30yr · 1.5% tax · 5.0% vac · 8.0% maint · 8.0% mgmt
Financing live
Cash to close
- Down payment
- $49,750
- Closing costs
- $5,970
- Reserves months
- —
- Total cash needed
- —
Loan-product check · same deal, 3 products live
Conventional
25% down · 7.5% · 30yr
- Down + closing
- —
- Monthly P&I
- —
- Monthly cashflow
- —
- DSCR
- —
- Eligible?
- —
Personal DTI + credit; lowest rate.
DSCR
20% down · 8.5% · 30yr
- Down + closing
- —
- Monthly P&I
- —
- Monthly cashflow
- —
- DSCR
- —
- Eligible?
- —
No personal income docs; deal must DSCR.
Hard money
10% down · 12.0% · 12mo
- Down + closing
- —
- Monthly P&I
- —
- Monthly cashflow
- —
- DSCR
- —
- Eligible?
- —
Short-term bridge; refi at stabilization.
Rent comps 26 comps
| Address | Beds | Baths | Sqft | Rent | $/sqft | DOM | Units | Dist |
|---|---|---|---|---|---|---|---|---|
| 6685 Kentwick Dr #210 Houston, TX | 3.0 | 2.5 | 1800 | $1,870 | $1.04 | 8d | 1 | 0.14mi |
| 15111 Falmouth Ave Houston, TX | 3.0 | 2.0 | 1674 | $1,850 | $1.11 | 45d | 1 | 0.24mi |
| 15255 Farm to Market Road 529 #3174 Houston, TX | 3.0 | 2.0 | 1652 | $2,170 | $1.31 | 13d | 1 | 0.29mi |
| 15255 Farm to Market Road 529 #15288 Houston, TX | 3.0 | 2.0 | 1652 | $2,170 | $1.31 | 45d | 1 | 0.29mi |
| 15255 Farm to Market Road 529 #525 Houston, TX | 3.0 | 2.0 | 1652 | $2,119 | $1.28 | 0d | 1 | 0.29mi |
| 15022 Mulberry Meadows Dr Houston, TX | 3.0 | 2.0 | 1832 | $1,905 | $1.04 | 0d | 1 | 0.37mi |
| 6607 Readsland Ln Houston, TX | 4.0 | 2.0 | 1832 | $2,500 | $1.36 | 45d | 1 | 0.39mi |
| 6407 Waldron Dr Unit B Houston, TX | 3.0 | 2.5 | 1546 | $1,800 | $1.16 | 25d | 1 | 0.39mi |
| 6427 Waldron Dr Unit A Houston, TX | 3.0 | 2.5 | 1593 | $1,900 | $1.19 | 45d | 1 | 0.40mi |
| 6803 Hedgewick Dr Houston, TX | 4.0 | 2.5 | 2336 | $2,550 | $1.09 | 23d | 1 | 0.49mi |
| 15022 Ringfield Dr Houston, TX | 3.0 | 2.0 | 2064 | $1,975 | $0.96 | 45d | 1 | 0.50mi |
| 6706 Honey Harvest Ln Houston, TX | 3.0 | 3.0 | 1873 | $2,049 | $1.09 | 45d | 1 | 0.66mi |
| 14623 Sanour Dr Houston, TX | 3.0 | 2.5 | 2032 | $2,170 | $1.07 | 6d | 1 | 0.72mi |
| 7415 Broken Ridge Dr Houston, TX | 3.0 | 2.5 | 2416 | $2,245 | $0.93 | 45d | 1 | 0.74mi |
| 6102 Crakston St Houston, TX | 3.0 | 2.0 | 1862 | $1,850 | $0.99 | 45d | 1 | 0.91mi |
| 15831 Yorktown Crossing Pkwy Houston, TX | 1.0–3.0 | 1.0–2.0 | 1159 | $2,689 | $2.32 | 0d | 1 | 0.99mi |
| 15831 Yorktown Crossing Pkwy Houston, TX | 3.0 | 2.0 | 1470 | $2,381 | $1.62 | 4d | 1 | 0.99mi |
| 16222 Summer Dew Ln Houston, TX | 3.0 | 2.0 | 1402 | $1,750 | $1.25 | 14d | 1 | 1.02mi |
| 15831 Yorktown Crossing Pkwy Unit 3174 Houston, TX | 3.0 | 2.0 | 1487 | $2,309 | $1.55 | 11d | 1 | 1.03mi |
| 15831 Yorktown Crossing Pkwy Unit 525 Houston, TX | 3.0 | 2.0 | 1487 | $2,269 | $1.53 | 0d | 1 | 1.03mi |
| 7451 Tunbury Ln Houston, TX | 4.0 | 2.5 | 2630 | $2,171 | $0.83 | 8d | 1 | 1.15mi |
| 16550 Bouldgreen St Houston, TX | 3.0 | 2.5 | 2237 | $2,386 | $1.07 | 45d | 1 | 1.18mi |
| 16603 Live Oak Canyon Dr Houston, TX | 3.0 | 2.5 | 2557 | $1,986 | $0.78 | 45d | 1 | 1.19mi |
| 16303 Hickory Point Rd Houston, TX | 4.0 | 2.5 | 2556 | $2,400 | $0.94 | 4d | 1 | 1.21mi |
| 5703 Afton Ridge Ln Houston, TX | 4.0 | 2.5 | 2203 | $1,896 | $0.86 | 23d | 1 | 1.30mi |
| 7331 Millbrae Ln Houston, TX | 4.0 | 2.0 | 2481 | $1,779 | $0.72 | 3d | 1 | 1.41mi |
HOA detail
- Monthly dues
- $29 · $348/yr
Listing history 37 events
-
2026-06-21days on market $199,000 Active 39 DOM
-
2026-06-18days on market $199,000 Active 36 DOM
-
2026-06-17days on market $199,000 Active 35 DOM
-
2026-06-16days on market $199,000 Active 34 DOM
-
2026-06-15days on market $199,000 Active 33 DOM
-
2026-06-13days on market $199,000 Active 31 DOM
-
2026-06-13days on market $199,000 Active 30 DOM
-
2026-06-09days on market $199,000 Active 27 DOM
-
2026-06-08days on market $199,000 Active 26 DOM
-
2026-06-07days on market $199,000 Active 25 DOM
-
2026-06-04days on market $199,000 Active 22 DOM
-
2026-06-03days on market $199,000 Active 21 DOM
-
2026-06-02days on market $199,000 Active 20 DOM
-
2026-06-01days on market $199,000 Active 19 DOM
-
2026-05-31days on market $199,000 Active 18 DOM
-
2026-05-13$199,000 Active 999-char remark
-
2025-12-18soldstatus Closed 372-char remark
Show marketing remark (372 chars)
HUD Case # 493-746742. Potential here. Lovely townhome at an ideal location to shops, dining. Three bedrooms, 2 full bathrooms, half bathroom. large living room, open concept to kitchen and breakfast area. All bedrooms upstairs with two full bathrooms, utility room inside, fenced in small, padded area in rear with covered parking. Better act fast on this one. See today.
-
2025-12-18soldstatus
Show marketing remark (372 chars)
HUD Case # 493-746742. Potential here. Lovely townhome at an ideal location to shops, dining. Three bedrooms, 2 full bathrooms, half bathroom. large living room, open concept to kitchen and breakfast area. All bedrooms upstairs with two full bathrooms, utility room inside, fenced in small, padded area in rear with covered parking. Better act fast on this one. See today.
-
2025-10-04status Pending 372-char remark
Show marketing remark (372 chars)
HUD Case # 493-746742. Potential here. Lovely townhome at an ideal location to shops, dining. Three bedrooms, 2 full bathrooms, half bathroom. large living room, open concept to kitchen and breakfast area. All bedrooms upstairs with two full bathrooms, utility room inside, fenced in small, padded area in rear with covered parking. Better act fast on this one. See today.
-
2025-09-11status Active 372-char remark
Show marketing remark (372 chars)
HUD Case # 493-746742. Potential here. Lovely townhome at an ideal location to shops, dining. Three bedrooms, 2 full bathrooms, half bathroom. large living room, open concept to kitchen and breakfast area. All bedrooms upstairs with two full bathrooms, utility room inside, fenced in small, padded area in rear with covered parking. Better act fast on this one. See today.
-
2025-09-11price $124,100 372-char remark
Show marketing remark (372 chars)
HUD Case # 493-746742. Potential here. Lovely townhome at an ideal location to shops, dining. Three bedrooms, 2 full bathrooms, half bathroom. large living room, open concept to kitchen and breakfast area. All bedrooms upstairs with two full bathrooms, utility room inside, fenced in small, padded area in rear with covered parking. Better act fast on this one. See today.
-
2025-09-11historical 372-char remark
Show marketing remark (372 chars)
HUD Case # 493-746742. Potential here. Lovely townhome at an ideal location to shops, dining. Three bedrooms, 2 full bathrooms, half bathroom. large living room, open concept to kitchen and breakfast area. All bedrooms upstairs with two full bathrooms, utility room inside, fenced in small, padded area in rear with covered parking. Better act fast on this one. See today.
-
2025-08-01status Active 372-char remark
Show marketing remark (372 chars)
HUD Case # 493-746742. Potential here. Lovely townhome at an ideal location to shops, dining. Three bedrooms, 2 full bathrooms, half bathroom. large living room, open concept to kitchen and breakfast area. All bedrooms upstairs with two full bathrooms, utility room inside, fenced in small, padded area in rear with covered parking. Better act fast on this one. See today.
-
2025-08-01historical 372-char remark
Show marketing remark (372 chars)
HUD Case # 493-746742. Potential here. Lovely townhome at an ideal location to shops, dining. Three bedrooms, 2 full bathrooms, half bathroom. large living room, open concept to kitchen and breakfast area. All bedrooms upstairs with two full bathrooms, utility room inside, fenced in small, padded area in rear with covered parking. Better act fast on this one. See today.
-
2025-06-24status Pending 372-char remark
Show marketing remark (372 chars)
HUD Case # 493-746742. Potential here. Lovely townhome at an ideal location to shops, dining. Three bedrooms, 2 full bathrooms, half bathroom. large living room, open concept to kitchen and breakfast area. All bedrooms upstairs with two full bathrooms, utility room inside, fenced in small, padded area in rear with covered parking. Better act fast on this one. See today.
-
2025-06-12status Pending 372-char remark
Show marketing remark (372 chars)
HUD Case # 493-746742. Potential here. Lovely townhome at an ideal location to shops, dining. Three bedrooms, 2 full bathrooms, half bathroom. large living room, open concept to kitchen and breakfast area. All bedrooms upstairs with two full bathrooms, utility room inside, fenced in small, padded area in rear with covered parking. Better act fast on this one. See today.
-
2025-06-10$137,700 Active 372-char remark
Show marketing remark (372 chars)
HUD Case # 493-746742. Potential here. Lovely townhome at an ideal location to shops, dining. Three bedrooms, 2 full bathrooms, half bathroom. large living room, open concept to kitchen and breakfast area. All bedrooms upstairs with two full bathrooms, utility room inside, fenced in small, padded area in rear with covered parking. Better act fast on this one. See today.
-
2025-01-29status Pending
-
2025-01-29historical
-
2024-12-14status Active
-
2024-12-10historical
-
2024-12-03status Active
-
2024-09-19status Pending
-
2024-09-16price $137,700
-
2024-08-17price $153,000
-
2024-06-27$170,000 Active
-
1988-01-06soldstatus
ⓘ Source: listings_history table (triggers on properties + properties_extension) + one-shot
backfill from property_details.listing_events for pre-trigger history.
Tax reassessment forecast TX · Resets to sale price
- Current annual tax
- $4,120 · $343/mo
- Projected year-2 tax
- $4,120 · $343/mo
- Expected delta
- $0/yr ($0/mo · 0.0%)
ⓘ Screening estimate from a state-policy table — verify with the county assessor before closing.
Climate risk First Street
- Flood 1/10 Low FEMA zone X (unshaded) · 0% chance over 30 yrs
- Wildfire 1/10 Low
- Heat 9/10 Extreme 7 d/yr ≥110°F today · 23 d/yr by 30 yrs out
- Wind 8/10 Severe 99% chance of damaging wind over 30 yrs
- Air quality 3/10 Moderate 2 unhealthy d/yr today · 3 by 30 yrs out
Nearby sold comps map
Loading sold comps map…
Walkable amenities ~0.75 mi
Loading nearby amenities…
Taxation est. · year 1
- Rental income
- $24,534
- − Mortgage interest
- −$11,147
- − Property taxes
- −$4,120
- − Insurance
- −$995
- − Repairs & maintenance
- −$1,963
- − Management
- −$1,963
- − HOA
- −$348
- − Depreciation
- −$5,789
- Taxable loss
- −$1,791
- Est. tax savings @ 24.0%
- +$430
- After-tax cash flow
- $1,826/yr
For passive investors: Depreciation is non-cash, so a rental often shows a tax loss while cash-flowing — sheltering income. Rental losses are passive: they offset passive income freely, and up to $25,000/yr can offset ordinary (W-2) income if you actively participate and your MAGI is under $100k (phasing out to $0 by $150k); unused losses carry forward. On sale, claimed depreciation is recaptured at up to 25%, and gains may owe capital-gains tax (a 1031 exchange can defer both). Figures are a year-1 estimate at your 24.0% rate — not tax advice; consult a CPA.
Schools (NCES district)
- District
- Cypress-Fairbanks ISD
- NCES district ID
- 4816110
- Math proficiency
- 45% ▼ -12.00%
- Reading proficiency
- 52% ▼ -2.00%
- Median HH income
- $72,025
- Composite
- 43.63/100
- National rank
- #2968
- State rank
- #161 of 826 in TX
Livability — Houston
- Score
- 74/100
- State rank
- #184
- US rank
- #4771
Category grades
Schools grade is shown separately in the Schools card above.
Census & demographics
- County
- Harris County · 4,702,590 people
- City population
- 3,226,434
- Metro
- Houston-The Woodlands-Sugar Land, TX
- Population (ZIP)
- 110,217
- Household income
- $80,575
- Rent vs Own
- Severe rent burden
- 3257.0
Population outlook (Harris County) Hauer SSP2
- Today (2025)
- 5,571,493 people
- By 2030
- 6,089,821 · +9.3%
- By 2040
- 7,142,806 · +28.2%
- By 2050
- 8,185,864 · +46.9%
- By 2075
- 10,574,329 · +89.8%
- By 2100
- 12,109,958 · +117.4%
Race, ethnicity, and origin ACS 2023
- Neighborhood character
- Diverse neighborhood (Simpson 0.69)
- Race & ethnicity
- Hispanic / Latino 48% Two or more races 22% White 22% Black 16% Asian 11% Native American 2%
- Hispanic origin (detail)
- Mexican 27% Cuban 2%
- Common ancestry
- Lithuanian 1% Romanian 1% Slovak 1%
- Foreign-born
- 32% · Canada, Vietnam, Jamaica
- Languages at home
- 48% English-only · Spanish 38% Other Indo-European 5% Vietnamese 3%
Political lean MEDSL · Harris
- 2024 margin
- Lean D (+5.5) · D 52.0% · R 46.4% · Other 1.6%
- 2008→2024 swing
- +3.9pp toward D · 2008: 1.6pp · 2024: 5.5pp
- All cycles
- 2024: D+5.5 2020: D+13.3 2016: D+12.4 2012: D+0.1 2008: D+1.6
Not yet ingested
- Civics
- —
Market trends
- HPI YoY
- ▼ -1.40%
- Current HPI
- 251.8474
- Rent YoY
- ▼ -2.89%
- Metro
- Houston-The Woodlands-Sugar Land, TX
- State GDP YoY
- ▲ 3.95%
- F500 in state
- 110
Industry mix (Fortune 500 HQ in TX)
| Industry | F500 HQs | Revenue |
|---|---|---|
| Energy | 16 | $1,198B |
|
||
| Technology | 5 | $198B |
|
||
| Engineering / Construction | 4 | $72B |
|
||
| Energy Services | 3 | $60B |
|
||
| Utilities | 3 | $41B |
|
||
| Healthcare | 2 | $330B |
|
||
Price history
+17.1% since first listed22 events — show timeline
- 2026-05-13 Listed $199,000 HARMLS
- 2025-12-18 Sold (Public Records) — Public Records
- 2025-12-18 Sold (MLS) — HARMLS
- 2025-10-04 Pending — HARMLS
- 2025-09-11 Relisted — HARMLS
- 2025-09-11 Price Changed $124,100 HARMLS
- 2025-09-11 Listing Removed — HARMLS
- 2025-08-01 Relisted — HARMLS
- 2025-08-01 Listing Removed — HARMLS
- 2025-06-24 Pending — HARMLS
- 2025-06-12 Pending — HARMLS
- 2025-06-10 Listed $137,700 HARMLS
- 2025-01-29 Pending — HARMLS
- 2025-01-29 Listing Removed — HARMLS
- 2024-12-14 Relisted — HARMLS
- 2024-12-10 Listing Removed — HARMLS
- 2024-12-03 Relisted — HARMLS
- 2024-09-19 Pending — HARMLS
- 2024-09-16 Price Changed $137,700 HARMLS
- 2024-08-17 Price Changed $153,000 HARMLS
- 2024-06-27 Listed $170,000 HARMLS
- 1988-01-06 Sold (Public Records) — Public Records
Property tax history
+3.4%/yrLatest (2025): $4,120 · -19.1% YoY. Source: county tax records.
Cash-flow waterfall
monthlySold comps — $/sqft
last 12 mo · ≤1 miLoading sold comps…