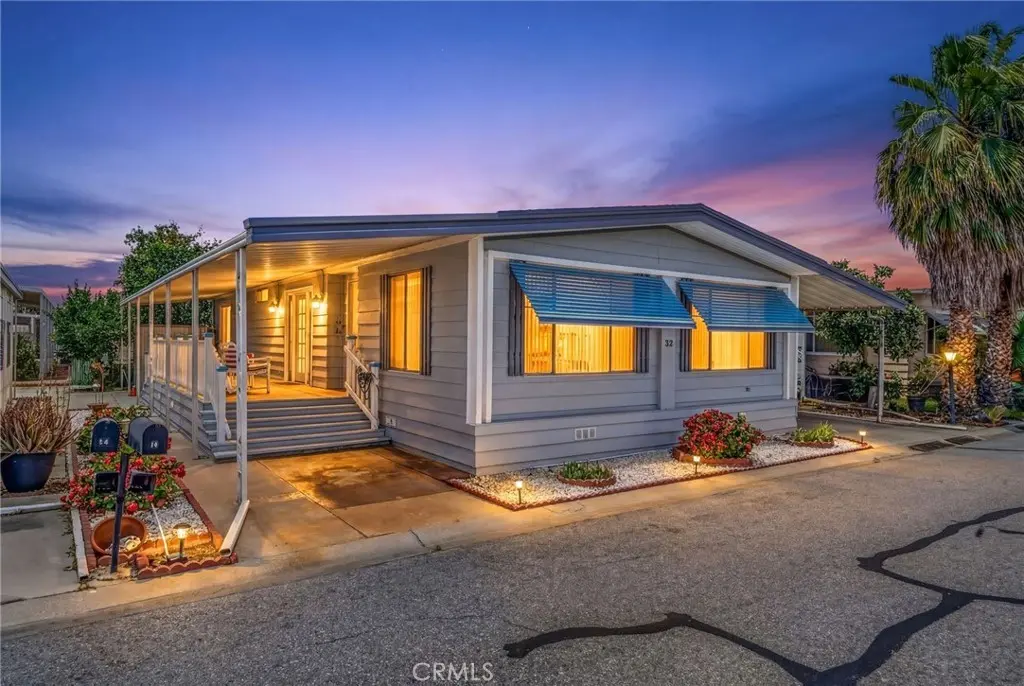
5001 W Florida Ave #32 · Hemet, CA
Flood risk 1/10 · Minimal
- FEMA flood zone
- X (unshaded)
- Chance of flooding over 30 yrs
- 0.0%
- Est. flood insurance / yr
- $507 – $1,088
Fire risk 7/10 · Major
- Est. fire insurance / yr
- $659 – $1,223
Heat risk 7/10 · Major
- Hot days now (above 105°F)
- 3 days/yr
- Hot days in 30 yrs
- 9 days/yr
Wind risk 1/10 · Minimal
- Chance of severe wind over 30 yrs
- —
Air-quality risk 6/10 · Moderate
- Unhealthy air days now
- 9 days/yr
- Unhealthy air days in 30 yrs
- 11 days/yr
Risk factors via First Street. Map © Google.
Why this score? — see what drove the B+ grade
The composite is a weighted blend of 9 inputs, each scored 0–100. Each bar is that input's sub-score; the figure is the points it added to the 100-point composite (weight × sub-score).
- Cash flow +30.0/30.0
- ARV discount +15.0/15.0
- 1% rule +10.0/10.0
- DSCR +10.0/10.0
- Rent growth +2.9/5.0
- Livability +2.6/5.0
- Schools +2.5/10.0
- Condition / age +2.5/5.0
- Appreciation +0.0/10.0
$59,900
🖨 Deal sheet 📄 Offer letter ✓ Due diligence
Listing remarks
Welcome to this well-maintained 1,344 square foot manufactured home located within the desirable 55+ community of The Lakes at Hemet West. Featuring 2 bedrooms and 2 bathrooms, this inviting home offers a spacious and functional floor plan designed for comfortable everyday living. Recent improvements include a brand-new roof, providing added value and peace of mind. The home features bright living spaces, a generously sized primary suite, and flexible living areas ideal for relaxing or entertaining. Residents of The Lakes at Hemet West enjoy access to exceptional resort-style amenities including a 9-hole golf course, heated pool and spa, clubhouse, pickleball courts, bocce ball courts, and
Key facts
- 2 parking spots
- Community pool
- Built 1978
Neighborhood map
What this means for you Summary
Snapshot
- This is a 2-bed/2.0-bath manufactured listed at $60k.
Deal economics
- At list price, monthly cash flow is $1k ($15k/yr) — positive.
- The deal already cash-flows at list — no discount required.
- Meets the 1% rule at list price ($2k rent vs $60k).
- Recommended offer: $59k (1.5% below list) — sets the bar for market timing.
- Cap rate 31.5% vs local median 4.9% in Hemet — top-decile yield for the area; either an underpriced asset or a hidden risk that comps aren't pricing in. Stress-test before assuming the spread holds.
Location & tenants
- Location reads 51/100 on livability (#1,056 in CA) — a working-class tenant base; expect higher turnover. Strengths: housing A+; Watch: crime D+, schools F, amenities F.
- Hemet Unified (suburban): math 19% / reading 41% proficiency, ranked #360 of 517 in CA (top 70%) — families likely to look elsewhere, expect single-tenant / working-renter base with shorter leases; 66% free/reduced lunch — lower-income household profile, screen leases tightly.
- Market conditions: Rents rising (+1.8%/yr); 264 active listings in the ZIP; 10 comparable units currently listed for rent nearby; rentals at typical pace (median 19d on market — plan ~3-4 weeks tenant-placement turnaround); 9,195 units permitted in Riverside County in 2024 (1,512 in 5+ unit buildings).
- At $2,039/mo this rent would consume 50% of the median local household income ($49k/yr) (locally 2144% of renters already pay >50% of income on rent) — very limited rent-growth headroom before tenants either downsize or default.
Forward outlook
- Local home prices are declining (-3.0%/yr); year-one equity from $414 of loan paydown is wiped out by about $2k of value loss. Plan a longer hold.
- Riverside County population projected at +22% by 2050 — long-run rental-demand tailwind backs the buy-and-hold thesis.
- At projected returns (-3.0% appreciation + 1.8% rent growth), your $17k cash investment doubles in ~2 years — after that, you're playing with house money.
Negotiation context
- It's been on market 22 days — a 2% lower offer ($59k) is reasonable based on typical stale-listing flexibility.
Risks & watch-outs
- Climate carrying-cost: major wildfire risk; extreme-heat days projected 3→9/yr by 2055 (HVAC capex compounding) — expect insurance premiums to compound above CPI over the hold.
Questions for the listing agent
- Built in 1978 — when were the roof, HVAC, electrical panel, plumbing, and water heater last replaced?
- Is there a deadline driving the sale (1031 exchange, divorce, estate, relocation)? That informs how much negotiation room exists.
- Schools are F-rated, which usually means shorter tenancies and higher turnover. Who's the typical renter profile here, and what's been the actual vacancy rate?
- Crime grade is D in this area — have there been break-ins, vandalism, or insurance claims at this property in the last 3 years? What carrier currently insures it and at what premium?
- What's the average days-on-market for RENTAL listings here right now (not sales)? A rising rental-DOM trend means longer vacancies and softer asking-rent achievability than the comps imply.
- What's the recent tenant-quality profile in this submarket — average credit score on applications, eviction rate, late-payment / NSF rate, and stable-employment percentage? A property-management company in the area should have these aggregated.
- How much new for-sale + rental construction is in the pipeline within 1–3 miles? Heavy new supply typically softens prices + rents 12–24 months out; constrained supply supports both.
Investment metrics
- 1% rule
- 3.40% ✓
- Cap rate
- 31.50%
- Cash-on-cash
- 90.02%
- DSCR
- 5.01
- GRM
- 2.4
CMA / ARV
- ARV (median comp)
- $75,021
- List price
- $59,900
- Delta
- -16.02%
- Verdict
- UNDERPRICED
- Comps
- 20 within 1.0 mi
Show comp detail 12 sales within ~0.75 mi
| Address | Dist | Beds/Ba | Sqft | Sold | Price | $/sf | Match |
|---|---|---|---|---|---|---|---|
| 5001 W Florida #618 | 0.29mi | 2/2.0 | 1,344 (0%) | 4mo | $70,000 | $52 | 84 |
| 5001 W Florida Ave W #728 | 0.29mi | 2/2.0 | 1,344 (0%) | 4mo | $56,000 | $42 | 83 |
| 5001 W Florida Ave #122 | 0.36mi | 2/2.0 | 1,296 (-4%) | 0mo | $52,500 | $41 | 77 |
| 5001 W Florida #171 | 0.29mi | 2/2.0 | 1,440 (+7%) | 1mo | $67,000 | $47 | 74 |
| 5001 FLORIDA #311 | 0.29mi | 2/2.0 | 1,440 (+7%) | 1mo | $73,990 | $51 | 74 |
| 5001 W Florida Ave #305 | 0.29mi | 2/2.0 | 1,440 (+7%) | 2mo | $91,000 | $63 | 73 |
| 5001 W Florida #661 | 0.29mi | 2/2.0 | 1,440 (+7%) | 3mo | $97,000 | $67 | 72 |
| 5001 W Florida Ave #482 | 0.29mi | 2/2.0 | 1,440 (+7%) | 4mo | $55,000 | $38 | 71 |
| 5001 W Florida Ave #163 | 0.29mi | 2/2.0 | 1,440 (+7%) | 6mo | $50,000 | $35 | 70 |
| 5001 W Florida #695 | 0.36mi | 2/2.0 | 1,248 (-7%) | 5mo | $45,000 | $36 | 67 |
| 5001 W Florida #524 | 0.29mi | 2/2.0 | 1,488 (+11%) | 3mo | $62,000 | $42 | 66 |
| 5001 W Florida Ave #135 | 0.36mi | 2/2.0 | 1,504 (+12%) | 5mo | $55,000 | $37 | 59 |
Match score weights: distance 35% · size 25% · config 20% · recency 20%. Top-matched comps best support the ARV.
Projected returns pro-forma
-3.0% appreciation · 1.76% rent growth · sell at horizon
- IRR
- 89.3%
- Equity multiple
- 5.05×
- Total profit
- $67,909
- Equity at exit
- $8,931
- IRR
- 92.0%
- Equity multiple
- 10.08×
- Total profit
- $152,236
- Equity at exit
- $5,179
Cash invested: $16,772 (down + closing). Projections, not guarantees.
Landlord ↔ Tenant lean methodology
- Overall (STATE)
- 18 Strongly Tenant-Friendly
- State California
- 18 Strongly Tenant-Friendly · D+13
- County
- — inherits STATE
- City
- — inherits STATE
ZIP-level market 92543
- Home prices YoY
- -26.7%
- Rents YoY
- 1.8%
- Active inventory
- 264
- Price-to-rent
- 2.4×
Monthly cashflow live
- Estimated rent
- $2,039 high interval (Pro) →
- Mortgage (P&I)
- −$314
- Tax from tax record
- −$14 /mo · $164/yr
- Insurance
- −$25
- HOA
- −$0
- Vacancy / Maint / Mgmt
- −$428
- Net cashflow
- $1,258
Break-even live
UW: 25.0% down · 7.5% · 30yr · 1.5% tax · 5.0% vac · 8.0% maint · 8.0% mgmt
Financing live
Cash to close
- Down payment
- $14,975
- Closing costs
- $1,797
- Reserves months
- —
- Total cash needed
- —
Loan-product check · same deal, 3 products live
Conventional
25% down · 7.5% · 30yr
- Down + closing
- —
- Monthly P&I
- —
- Monthly cashflow
- —
- DSCR
- —
- Eligible?
- —
Personal DTI + credit; lowest rate.
DSCR
20% down · 8.5% · 30yr
- Down + closing
- —
- Monthly P&I
- —
- Monthly cashflow
- —
- DSCR
- —
- Eligible?
- —
No personal income docs; deal must DSCR.
Hard money
10% down · 12.0% · 12mo
- Down + closing
- —
- Monthly P&I
- —
- Monthly cashflow
- —
- DSCR
- —
- Eligible?
- —
Short-term bridge; refi at stabilization.
Rent comps 10 comps
| Address | Beds | Baths | Sqft | Rent | $/sqft | DOM | Units | Dist |
|---|---|---|---|---|---|---|---|---|
| 4400 W Florida Ave Spc 26 Hemet, CA | 3.0 | 2.0 | 1193 | $1,699 | $1.42 | 15d | 1 | 0.62mi |
| 4400 W Florida Ave Unit 86 Hemet, CA | 3.0 | 2.0 | 1310 | $1,800 | $1.37 | 44d | 1 | 0.65mi |
| 2971 Pembroke Ave Hemet, CA | 3.0 | 2.0 | 1572 | $3,000 | $1.91 | 18d | 1 | 1.01mi |
| 3030 W Acacia Ave Hemet, CA | 1.0–3.0 | 1.0–2.0 | 892 | $1,895 | $2.12 | 2d | 10 | 1.11mi |
| 3800 W Devonshire Ave Hemet, CA | 3.0 | 1.0–2.0 | 816 | $2,055 | $2.52 | 2d | 8 | 1.13mi |
| 683 Jonquil St Hemet, CA | 3.0 | 2.0 | 1150 | $2,448 | $2.13 | 24d | 1 | 1.30mi |
| 1354 Jasmine Way Hemet, CA | 2.0 | 2.0 | 1440 | $1,650 | $1.15 | 44d | 1 | 1.37mi |
| 2469 W Acacia Ave Hemet, CA | 2.0 | 2.0 | 910 | $1,750 | $1.92 | 24d | 1 | 1.39mi |
| 2403 W Acacia Ave Hemet, CA | 2.0 | 2.0 | 910 | $1,995 | $2.19 | 8d | 1 | 1.41mi |
| 3471 Dublin Ct Hemet, CA | 3.0 | 2.0 | 1276 | $2,895 | $2.27 | 4d | 1 | 1.44mi |
Listing history 18 events
-
2026-06-18days on market $59,900 Active 22 DOM
-
2026-06-17days on market $59,900 Active 21 DOM
-
2026-06-16days on market $59,900 Active 20 DOM
-
2026-06-15days on market $59,900 Active 19 DOM
-
2026-06-13days on market $59,900 Active 17 DOM
-
2026-06-09days on market $59,900 Active 13 DOM
-
2026-06-08days on market $59,900 Active 12 DOM
-
2026-06-07days on market $59,900 Active 11 DOM
-
2026-06-04days on market $59,900 Active 8 DOM
-
2026-06-03days on market $59,900 Active 7 DOM
-
2026-06-02days on market $59,900 Active 6 DOM
-
2026-06-01days on market $59,900 Active 5 DOM
-
2026-05-31days on market $59,900 Active 4 DOM
-
2026-05-11historical
-
2026-04-11price $63,000
-
2026-02-10price $68,000
-
2026-01-07price $75,000
-
2025-11-11$76,999 Active
ⓘ Source: listings_history table (triggers on properties + properties_extension) + one-shot
backfill from property_details.listing_events for pre-trigger history.
Tax reassessment forecast CA · Resets to sale price
- Current annual tax
- $164 · $14/mo
- Projected year-2 tax
- $455 · $38/mo
- Expected delta
- +$291/yr (+$24/mo · 177.5%)
ⓘ Screening estimate from a state-policy table — verify with the county assessor before closing.
Climate risk First Street
- Flood 1/10 Low FEMA zone X (unshaded) · 0% chance over 30 yrs
- Wildfire 7/10 Severe
- Heat 7/10 Severe 3 d/yr ≥105°F today · 9 d/yr by 30 yrs out
- Wind 1/10 Low
- Air quality 6/10 Major 9 unhealthy d/yr today · 11 by 30 yrs out
Nearby sold comps map
Loading sold comps map…
Walkable amenities ~0.75 mi
Loading nearby amenities…
Taxation est. · year 1
- Rental income
- $24,470
- − Mortgage interest
- −$3,355
- − Property taxes
- −$164
- − Insurance
- −$300
- − Repairs & maintenance
- −$1,958
- − Management
- −$1,958
- − Depreciation
- −$1,743
- Taxable income
- $14,994
- Est. tax owed @ 24.0%
- −$3,598
- After-tax cash flow
- $11,500/yr
For passive investors: Depreciation is non-cash, so a rental often shows a tax loss while cash-flowing — sheltering income. Rental losses are passive: they offset passive income freely, and up to $25,000/yr can offset ordinary (W-2) income if you actively participate and your MAGI is under $100k (phasing out to $0 by $150k); unused losses carry forward. On sale, claimed depreciation is recaptured at up to 25%, and gains may owe capital-gains tax (a 1031 exchange can defer both). Figures are a year-1 estimate at your 24.0% rate — not tax advice; consult a CPA.
Schools (NCES district)
- District
- Hemet Unified
- NCES district ID
- 0616920
- Math proficiency
- 19% ▼ -3.00%
- Reading proficiency
- 41% ▲ 4.00%
- Median HH income
- $39,962
- Composite
- 25.16/100
- National rank
- #7517
- State rank
- #360 of 517 in CA
Livability — Hemet
- Score
- 51/100
- State rank
- #1056
- US rank
- #25208
Category grades
Schools grade is shown separately in the Schools card above.
Census & demographics
- Census place
- Hemet, CA
- County
- Riverside County · 2,287,001 people
- City population
- 137,670
- Metro
- Riverside-San Bernardino-Ontario, CA
- Population (ZIP)
- 39,937
- Household income
- $49,396
- Rent vs Own
- Severe rent burden
- 2144.0
Population outlook (Riverside County) Hauer SSP2
- Today (2025)
- 2,664,475 people
- By 2030
- 2,802,692 · +5.2%
- By 2040
- 3,050,904 · +14.5%
- By 2050
- 3,256,783 · +22.2%
- By 2075
- 3,655,058 · +37.2%
- By 2100
- 3,766,594 · +41.4%
Race, ethnicity, and origin ACS 2023
- Neighborhood character
- Diverse neighborhood (Simpson 0.61)
- Race & ethnicity
- Hispanic / Latino 54% White 30% Two or more races 18% Black 10% Native American 2% Asian 2%
- Hispanic origin (detail)
- Mexican 48% Puerto Rican 1%
- Common ancestry
- Slovak 1% Romanian 1% Portuguese 1%
- Foreign-born
- 21% · Canada
- Languages at home
- 59% English-only · Spanish 38% Arabic 1% Tagalog/Filipino 1%
Political lean MEDSL · Riverside
- 2024 margin
- Toss-up / Even · D 48.0% · R 49.3% · Other 2.6%
- 2008→2024 swing
- -3.6pp toward R · 2008: 2.3pp · 2024: -1.3pp
- All cycles
- 2024: R+1.3 2020: D+8.0 2016: D+4.3 2012: R+0.4 2008: D+2.3
Not yet ingested
- Civics
- —
Market trends
- HPI YoY
- ▼ -147.46%
- Current HPI
- 405.1277
- Rent YoY
- ▲ 1.76%
- Metro
- Riverside-San Bernardino-Ontario, CA
- State GDP YoY
- ▲ 3.21%
- F500 in state
- 116
Industry mix (Fortune 500 HQ in CA)
| Industry | F500 HQs | Revenue |
|---|---|---|
| Technology | 27 | $1,492B |
|
||
| Financial Services | 3 | $174B |
|
||
| Retail | 3 | $44B |
|
||
| Insurance | 3 | $26B |
|
||
| Media / Entertainment | 2 | $115B |
|
||
| Pharmaceuticals / Biotech | 2 | $62B |
|
||
Price history
-18.2% since first listed5 events — show timeline
- 2026-05-11 Listing Removed — SDMLS
- 2026-04-11 Price Changed $63,000 SDMLS
- 2026-02-10 Price Changed $68,000 SDMLS
- 2026-01-07 Price Changed $75,000 SDMLS
- 2025-11-11 Listed $76,999 SDMLS
Property tax history
-3.0%/yrLatest (2025): $164 · +3.0% YoY. Source: county tax records.
Cash-flow waterfall
monthlySold comps — $/sqft
last 12 mo · ≤1 miLoading sold comps…