 Fourplex
8605 Fireside Dr · Austin, TX
Flood risk 1/10 · Minimal
- FEMA flood zone
- X (unshaded)
- Chance of flooding over 30 yrs
- 0.0%
- Est. flood insurance / yr
- $507 – $1,088
Fire risk 1/10 · Minimal
- Est. fire insurance / yr
- $1,222 – $2,270
Heat risk 8/10 · Major
- Hot days now (above 108°F)
- 7 days/yr
- Hot days in 30 yrs
- 23 days/yr
Wind risk 8/10 · Major
- Chance of severe wind over 30 yrs
- 80.0%
Air-quality risk 2/10 · Minimal
- Unhealthy air days now
- 1 days/yr
- Unhealthy air days in 30 yrs
- 1 days/yr
Risk factors via First Street. Map © Google.
Why this score? — see what drove the B grade
The composite is a weighted blend of 9 inputs, each scored 0–100. Each bar is that input's sub-score; the figure is the points it added to the 100-point composite (weight × sub-score).
- Cash flow +30.0/30.0
- 1% rule +10.0/10.0
- DSCR +10.0/10.0
- ARV discount +7.5/15.0
- Livability +4.1/5.0
- Schools +3.4/10.0
- Rent growth +2.8/5.0
- Condition / age +2.5/5.0
- Appreciation +0.0/10.0
$299,000
🖨 Deal sheet 📄 Offer letter ✓ Due diligence
Multi-family units
County records classify this as Multi-Family (2-4 Unit). Listing-text estimate: 4 units. confirmed
Listing remarks MLS
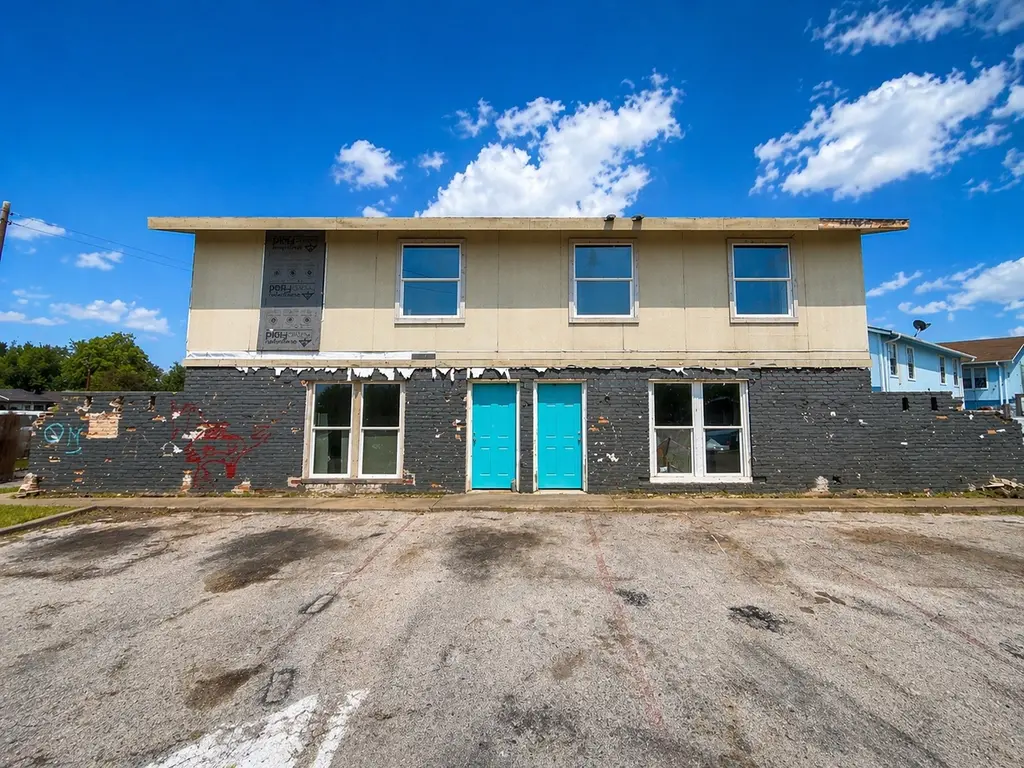
Exceptional value-add fourplex opportunity in a rapidly growing North Austin location. This two-story multifamily property offers a rare chance for investors to reposition and unlock significant upside through renovation and improved management. The building features a classic layout with four individual units, each with its own private entrance, making it ideal for both long-term rental strategies and potential future upgrades. Situated on a sizable lot with ample surrounding space, the property includes off-street parking and a functional footprint that lends itself well to a full exterior and interior refresh. The structure presents a strong foundation for renovation, with visible opportunities to enhance curb appeal, modernize interiors, and increase rental income. With the right improvements, this asset has the potential to perform well above its current condition. Located just minutes from major Austin corridors, including quick access to Hwy 183, Mopac, and nearby employment hubs, the property benefits from strong rental demand in the area. Residents will appreciate proximity to shopping, dining, and everyday conveniences, making this an attractive location for tenants seeking affordability with accessibility. Whether you’re an experienced investor looking for your next project or a buyer seeking a multifamily asset with upside in a high-demand market, 8605 Fireside Dr presents a compelling opportunity to add value and build long-term equity. Buyer and buyers agent to verify all MLS info.
Key facts
- Strong foundation
- Private entrance
- Quick access
Tags
Neighborhood map
What this means for you Summary
Snapshot
- This is a 4 × 2-bed/1.5-bath units multifamily listed at $299k.
Deal economics
- At list price, monthly cash flow is $2k ($28k/yr) — positive. Per door: $574/mo.
- The deal already cash-flows at list — no discount required.
- Meets the 1% rule at list price ($6k rent vs $299k).
- Recommended offer: $290k (3.0% below list) — sets the bar for market timing.
- Cap rate 15.5% vs local median 1.8% in Austin — top-decile yield for the area; either an underpriced asset or a hidden risk that comps aren't pricing in. Stress-test before assuming the spread holds.
Location & tenants
- Location reads 82/100 on livability (#16 in TX, #1,208 nationally) — a professional / high-income tenant draw. Strengths: amenities A+, commute A+, employment A+; Watch: cost of living D, crime F.
- Austin ISD (urban): math 33% / reading 44% proficiency, ranked #431 of 826 in TX (top 52%) — families likely to look elsewhere, expect single-tenant / working-renter base with shorter leases.
- Market conditions: Rents rising (+1.3%/yr); 206 active listings in the ZIP; solid renter incomes; 17,121 units permitted in Travis County in 2024 (11,963 in 5+ unit buildings).
- At $6,017/mo this rent would consume 70% of the median local household income ($104k/yr) (locally 763% of renters already pay >50% of income on rent) — very limited rent-growth headroom before tenants either downsize or default.
Forward outlook
- Local home prices are declining (-3.0%/yr); year-one equity from $2k of loan paydown is wiped out by about $9k of value loss. Plan a longer hold.
- Travis County population projected at +60% by 2050 — long-run rental-demand tailwind backs the buy-and-hold thesis.
- At projected returns (-3.0% appreciation + 1.3% rent growth), your $84k cash investment doubles in ~4 years — after that, you're playing with house money.
Negotiation context
- It's been on market 56 days — a 3% lower offer ($290k) is reasonable based on typical stale-listing flexibility.
- 3 sale attempts since 8y ago; this cycle's ask has dropped $36k (11%) from the opening price — seller is motivated, your offer sets the floor, not the list.
Risks & watch-outs
- Watch-outs: property tax is 3.1% of price.
- Climate carrying-cost: severe wind risk, 80% chance of damaging wind over 30y; extreme-heat days projected 7→23/yr by 2055 (HVAC capex compounding) — expect insurance premiums to compound above CPI over the hold.
Questions for the listing agent
- It's been on market 56 days. Have you received any prior offers? Is the seller open to a 3% concession, seller financing, or rate buy-down credit?
- Can we see the unit-by-unit rent roll, current vacancy, and any below-market leases? What's the average tenancy length?
- What capital expenditures (roof, boiler, parking lot, exteriors) have been made in the last 5 years, and what's planned in the next 2?
- Built in 1968 — when were the roof, HVAC, electrical panel, plumbing, and water heater last replaced?
- Property tax is high relative to price — has the assessment been appealed recently, and will the sale trigger a re-assessment?
- Is there a deadline driving the sale (1031 exchange, divorce, estate, relocation)? That informs how much negotiation room exists.
- Crime grade is F in this area — have there been break-ins, vandalism, or insurance claims at this property in the last 3 years? What carrier currently insures it and at what premium?
- What's the average days-on-market for RENTAL listings here right now (not sales)? A rising rental-DOM trend means longer vacancies and softer asking-rent achievability than the comps imply.
- What's the recent tenant-quality profile in this submarket — average credit score on applications, eviction rate, late-payment / NSF rate, and stable-employment percentage? A property-management company in the area should have these aggregated.
- How much new apartment / multifamily construction is in the pipeline within 1–3 miles? Heavy new supply (>2% of stock underway) typically softens rents 12–24 months out; light construction supports rent growth.
Investment metrics
- 1% rule
- 2.01% ✓
- Cap rate
- 15.50%
- Cash-on-cash
- 32.89%
- DSCR
- 2.46
- GRM
- 4.1
CMA / ARV
- ARV (median comp)
- $713,836
- List price
- $299,000
- Delta
- -58.11%
- Verdict
- UNDERPRICED
- Comps
- 19 within 1.0 mi
Show comp detail 1 sale within ~0.75 mi
| Address | Dist | Beds/Ba | Sqft | Sold | Price | $/sf | Match |
|---|---|---|---|---|---|---|---|
| 1904 Hearthstone Dr | 0.10mi | 8/4.0 | 3,584 (+2%) | 6mo | $875,000 | $244 | 79 |
Match score weights: distance 35% · size 25% · config 20% · recency 20%. Top-matched comps best support the ARV.
Projected returns pro-forma
-3.0% appreciation · 1.3% rent growth · sell at horizon
- IRR
- 26.0%
- Equity multiple
- 2.05×
- Total profit
- $87,895
- Equity at exit
- $44,582
- IRR
- 32.5%
- Equity multiple
- 3.70×
- Total profit
- $225,923
- Equity at exit
- $25,852
Cash invested: $83,720 (down + closing). Projections, not guarantees.
Landlord ↔ Tenant lean methodology
- Overall (STATE)
- 87 Strongly Landlord-Friendly
- State Texas
- 87 Strongly Landlord-Friendly · R+5
- County
- — inherits STATE
- City
- — inherits STATE
ZIP-level market 78757
- Rents YoY
- 1.3%
- Active inventory
- 206
- Price-to-rent
- 16.6×
Monthly cashflow live
- Estimated rent
- $6,017 high interval (Pro) →
- Mortgage (P&I)
- −$1,568
- Tax from tax record
- −$766 /mo · $9,197/yr
- Insurance
- −$125
- HOA
- −$0
- Vacancy / Maint / Mgmt
- −$1,264
- Net cashflow
- $2,294
Break-even live
4-unit breakdown (identical units grouped — click to expand)
| Units | Beds | Baths | Est. rent |
|---|---|---|---|
| 4× units | 2 | 1.5 | $6,016 |
| #1 | 2 | 1.5 | $1,504 |
| #2 | 2 | 1.5 | $1,504 |
| #3 | 2 | 1.5 | $1,504 |
| #4 | 2 | 1.5 | $1,504 |
| Total (4 units) | $6,017 | ||
UW: 25.0% down · 7.5% · 30yr · 1.5% tax · 5.0% vac · 8.0% maint · 8.0% mgmt
Financing live
Cash to close
- Down payment
- $74,750
- Closing costs
- $8,970
- Reserves months
- —
- Total cash needed
- —
Loan-product check · same deal, 3 products live
Conventional
25% down · 7.5% · 30yr
- Down + closing
- —
- Monthly P&I
- —
- Monthly cashflow
- —
- DSCR
- —
- Eligible?
- —
Personal DTI + credit; lowest rate.
DSCR
20% down · 8.5% · 30yr
- Down + closing
- —
- Monthly P&I
- —
- Monthly cashflow
- —
- DSCR
- —
- Eligible?
- —
No personal income docs; deal must DSCR.
Hard money
10% down · 12.0% · 12mo
- Down + closing
- —
- Monthly P&I
- —
- Monthly cashflow
- —
- DSCR
- —
- Eligible?
- —
Short-term bridge; refi at stabilization.
Listing history 29 events
-
2026-06-18days on market $299,000 Active 56 DOM
-
2026-06-17days on market $299,000 Active 55 DOM
-
2026-06-16days on market $299,000 Active 54 DOM
-
2026-06-15days on market $299,000 Active 53 DOM
-
2026-06-13days on market $299,000 Active 51 DOM
-
2026-06-09days on market $299,000 Active 47 DOM
-
2026-06-08days on market $299,000 Active 46 DOM
-
2026-06-07days on market $299,000 Active 45 DOM
-
2026-06-05days on market $299,000 Active 42 DOM
-
2026-06-03days on market $299,000 Active 41 DOM
-
2026-06-02days on market $299,000 Active 40 DOM
-
2026-06-01days on market $299,000 Active 39 DOM
-
2026-05-31days on market $299,000 Active 38 DOM
-
2026-04-23$335,000 Active 1526-char remark
Show marketing remark (1526 chars)
Exceptional value-add fourplex opportunity in a rapidly growing North Austin location. This two-story multifamily property offers a rare chance for investors to reposition and unlock significant upside through renovation and improved management. The building features a classic layout with four individual units, each with its own private entrance, making it ideal for both long-term rental strategies and potential future upgrades. Situated on a sizable lot with ample surrounding space, the property includes off-street parking and a functional footprint that lends itself well to a full exterior and interior refresh. The structure presents a strong foundation for renovation, with visible opportunities to enhance curb appeal, modernize interiors, and increase rental income. With the right improvements, this asset has the potential to perform well above its current condition. Located just minutes from major Austin corridors, including quick access to Hwy 183, Mopac, and nearby employment hubs, the property benefits from strong rental demand in the area. Residents will appreciate proximity to shopping, dining, and everyday conveniences, making this an attractive location for tenants seeking affordability with accessibility. Whether you’re an experienced investor looking for your next project or a buyer seeking a multifamily asset with upside in a high-demand market, 8605 Fireside Dr presents a compelling opportunity to add value and build long-term equity. Buyer and buyers agent to verify all MLS info.
-
2018-10-05soldstatus
-
2018-10-04soldstatus Sold 560-char remark
Show marketing remark (560 chars)
DO NOT disturb tenants. Perfect for investors looking for fixer upper/buy & hold props in hot ARV / steady rent market. All units are 2 Bds/1.5 Ba/1 Liv/1 Din/2 stories. Two units (#103, 104) are tenant occupied at $950/mth, M2M lease. MLS provides tax & sales related records, numerical representations, incl lot size & sq ft, that are drawn from public sources. This info is deemed reliable, but not guaranteed. It is sole responsibility of buyer/buyer's agent to verify any/all info important to buyer. FEMA - Unknown Restrictions: Unknown
-
2018-09-11status Pending 560-char remark
Show marketing remark (560 chars)
DO NOT disturb tenants. Perfect for investors looking for fixer upper/buy & hold props in hot ARV / steady rent market. All units are 2 Bds/1.5 Ba/1 Liv/1 Din/2 stories. Two units (#103, 104) are tenant occupied at $950/mth, M2M lease. MLS provides tax & sales related records, numerical representations, incl lot size & sq ft, that are drawn from public sources. This info is deemed reliable, but not guaranteed. It is sole responsibility of buyer/buyer's agent to verify any/all info important to buyer. FEMA - Unknown Restrictions: Unknown
-
2018-08-28status Pending - Taking Backups 560-char remark
Show marketing remark (560 chars)
DO NOT disturb tenants. Perfect for investors looking for fixer upper/buy & hold props in hot ARV / steady rent market. All units are 2 Bds/1.5 Ba/1 Liv/1 Din/2 stories. Two units (#103, 104) are tenant occupied at $950/mth, M2M lease. MLS provides tax & sales related records, numerical representations, incl lot size & sq ft, that are drawn from public sources. This info is deemed reliable, but not guaranteed. It is sole responsibility of buyer/buyer's agent to verify any/all info important to buyer. FEMA - Unknown Restrictions: Unknown
-
2018-08-08status Active 560-char remark
Show marketing remark (560 chars)
DO NOT disturb tenants. Perfect for investors looking for fixer upper/buy & hold props in hot ARV / steady rent market. All units are 2 Bds/1.5 Ba/1 Liv/1 Din/2 stories. Two units (#103, 104) are tenant occupied at $950/mth, M2M lease. MLS provides tax & sales related records, numerical representations, incl lot size & sq ft, that are drawn from public sources. This info is deemed reliable, but not guaranteed. It is sole responsibility of buyer/buyer's agent to verify any/all info important to buyer. FEMA - Unknown Restrictions: Unknown
-
2018-07-26status Pending - Taking Backups 560-char remark
Show marketing remark (560 chars)
DO NOT disturb tenants. Perfect for investors looking for fixer upper/buy & hold props in hot ARV / steady rent market. All units are 2 Bds/1.5 Ba/1 Liv/1 Din/2 stories. Two units (#103, 104) are tenant occupied at $950/mth, M2M lease. MLS provides tax & sales related records, numerical representations, incl lot size & sq ft, that are drawn from public sources. This info is deemed reliable, but not guaranteed. It is sole responsibility of buyer/buyer's agent to verify any/all info important to buyer. FEMA - Unknown Restrictions: Unknown
-
2018-07-25$375,000 Active 560-char remark
Show marketing remark (560 chars)
DO NOT disturb tenants. Perfect for investors looking for fixer upper/buy & hold props in hot ARV / steady rent market. All units are 2 Bds/1.5 Ba/1 Liv/1 Din/2 stories. Two units (#103, 104) are tenant occupied at $950/mth, M2M lease. MLS provides tax & sales related records, numerical representations, incl lot size & sq ft, that are drawn from public sources. This info is deemed reliable, but not guaranteed. It is sole responsibility of buyer/buyer's agent to verify any/all info important to buyer. FEMA - Unknown Restrictions: Unknown
-
2018-07-19historical $375,000 560-char remark
Show marketing remark (560 chars)
DO NOT disturb tenants. Perfect for investors looking for fixer upper/buy & hold props in hot ARV / steady rent market. All units are 2 Bds/1.5 Ba/1 Liv/1 Din/2 stories. Two units (#103, 104) are tenant occupied at $950/mth, M2M lease. MLS provides tax & sales related records, numerical representations, incl lot size & sq ft, that are drawn from public sources. This info is deemed reliable, but not guaranteed. It is sole responsibility of buyer/buyer's agent to verify any/all info important to buyer. FEMA - Unknown Restrictions: Unknown
-
2005-08-03soldstatus
-
2004-06-14soldstatus
-
2003-03-19soldstatus
-
1993-05-14soldstatus
-
1984-07-18soldstatus
-
1979-10-24soldstatus
-
1977-07-13soldstatus
ⓘ Source: listings_history table (triggers on properties + properties_extension) + one-shot
backfill from property_details.listing_events for pre-trigger history.
Tax reassessment forecast TX · Resets to sale price
- Current annual tax
- $9,197 · $766/mo
- Projected year-2 tax
- $9,197 · $766/mo
- Expected delta
- $0/yr ($0/mo · 0.0%)
ⓘ Screening estimate from a state-policy table — verify with the county assessor before closing.
Climate risk First Street
- Flood 1/10 Low FEMA zone X (unshaded) · 0% chance over 30 yrs
- Wildfire 1/10 Low
- Heat 8/10 Severe 7 d/yr ≥108°F today · 23 d/yr by 30 yrs out
- Wind 8/10 Severe 80% chance of damaging wind over 30 yrs
- Air quality 2/10 Low 1 unhealthy d/yr today · 1 by 30 yrs out
Nearby sold comps map
Loading sold comps map…
Walkable amenities ~0.75 mi
Loading nearby amenities…
Taxation est. · year 1
- Rental income
- $72,204
- − Mortgage interest
- −$16,749
- − Property taxes
- −$9,197
- − Insurance
- −$1,495
- − Repairs & maintenance
- −$5,776
- − Management
- −$5,776
- − Depreciation
- −$8,698
- Taxable income
- $24,513
- Est. tax owed @ 24.0%
- −$5,883
- After-tax cash flow
- $21,650/yr
For passive investors: Depreciation is non-cash, so a rental often shows a tax loss while cash-flowing — sheltering income. Rental losses are passive: they offset passive income freely, and up to $25,000/yr can offset ordinary (W-2) income if you actively participate and your MAGI is under $100k (phasing out to $0 by $150k); unused losses carry forward. On sale, claimed depreciation is recaptured at up to 25%, and gains may owe capital-gains tax (a 1031 exchange can defer both). Figures are a year-1 estimate at your 24.0% rate — not tax advice; consult a CPA.
Schools (NCES district)
- District
- Austin ISD
- NCES district ID
- 4808940
- Math proficiency
- 33% ▼ -19.00%
- Reading proficiency
- 44% ▼ -7.00%
- Median HH income
- $54,627
- Composite
- 33.65/100
- National rank
- #5397
- State rank
- #431 of 826 in TX
Livability — Austin
- Score
- 82/100
- State rank
- #16
- US rank
- #1208
Category grades
Schools grade is shown separately in the Schools card above.
Census & demographics
- Census place
- Austin, TX
- County
- Travis County · 1,299,254 people
- City population
- 1,066,854
- Metro
- Austin-Round Rock-Georgetown, TX
- Population (ZIP)
- 23,856
- Household income
- $103,860
- Rent vs Own
- Severe rent burden
- 763.0
Population outlook (Travis County) Hauer SSP2
- Today (2025)
- 1,545,133 people
- By 2030
- 1,729,269 · +11.9%
- By 2040
- 2,097,596 · +35.8%
- By 2050
- 2,463,890 · +59.5%
- By 2075
- 3,249,374 · +110.3%
- By 2100
- 3,801,868 · +146.1%
Race, ethnicity, and origin ACS 2023
- Neighborhood character
- Predominantly White (67%)
- Race & ethnicity
- White 67% Hispanic / Latino 20% Two or more races 16% Asian 4% Black 4%
- Hispanic origin (detail)
- Mexican 16%
- Common ancestry
- Lithuanian 3% Scotch-Irish 3% Slovak 3%
- Foreign-born
- 10% · Canada, South Korea, China
- Languages at home
- 80% English-only · Spanish 15% Other Indo-European 1% Other Asian/Pacific 1%
Political lean MEDSL · Travis
- 2024 margin
- Solid D (+39.3) · D 68.8% · R 29.4% · Other 1.8%
- 2008→2024 swing
- +9.9pp toward D · 2008: 29.4pp · 2024: 39.3pp
- All cycles
- 2024: D+39.3 2020: D+45.0 2016: D+38.9 2012: D+23.9 2008: D+29.4
Not yet ingested
- Civics
- —
Market trends
- HPI YoY
- ▼ -896.70%
- Current HPI
- 242.6248
- Rent YoY
- ▲ 1.30%
- Metro
- Austin-Round Rock-Georgetown, TX
- State GDP YoY
- ▲ 3.95%
- F500 in state
- 110
Industry mix (Fortune 500 HQ in TX)
| Industry | F500 HQs | Revenue |
|---|---|---|
| Energy | 16 | $1,198B |
|
||
| Technology | 5 | $198B |
|
||
| Engineering / Construction | 4 | $72B |
|
||
| Energy Services | 3 | $60B |
|
||
| Utilities | 3 | $41B |
|
||
| Healthcare | 2 | $330B |
|
||
Price history
-10.7% since first listed16 events — show timeline
- 2026-04-23 Listed $335,000 Unlock MLS
- 2018-10-05 Sold (Public Records) — Public Records
- 2018-10-04 Sold (MLS) — Unlock MLS
- 2018-09-11 Pending — Unlock MLS
- 2018-08-28 Pending — Unlock MLS
- 2018-08-08 Relisted — Unlock MLS
- 2018-07-26 Pending — Unlock MLS
- 2018-07-25 Listed $375,000 Unlock MLS
- 2018-07-19 Coming Soon $375,000 Unlock MLS
- 2005-08-03 Sold (Public Records) — Public Records
- 2004-06-14 Sold (Public Records) — Public Records
- 2003-03-19 Sold (Public Records) — Public Records
- 1993-05-14 Sold (Public Records) — Public Records
- 1984-07-18 Sold (Public Records) — Public Records
- 1979-10-24 Sold (Public Records) — Public Records
- 1977-07-13 Sold (Public Records) — Public Records
Property tax history
+4.1%/yrLatest (2026): $9,197 · -5.9% YoY. Source: county tax records.
Cash-flow waterfall
monthlySold comps — $/sqft
last 12 mo · ≤1 miLoading sold comps…