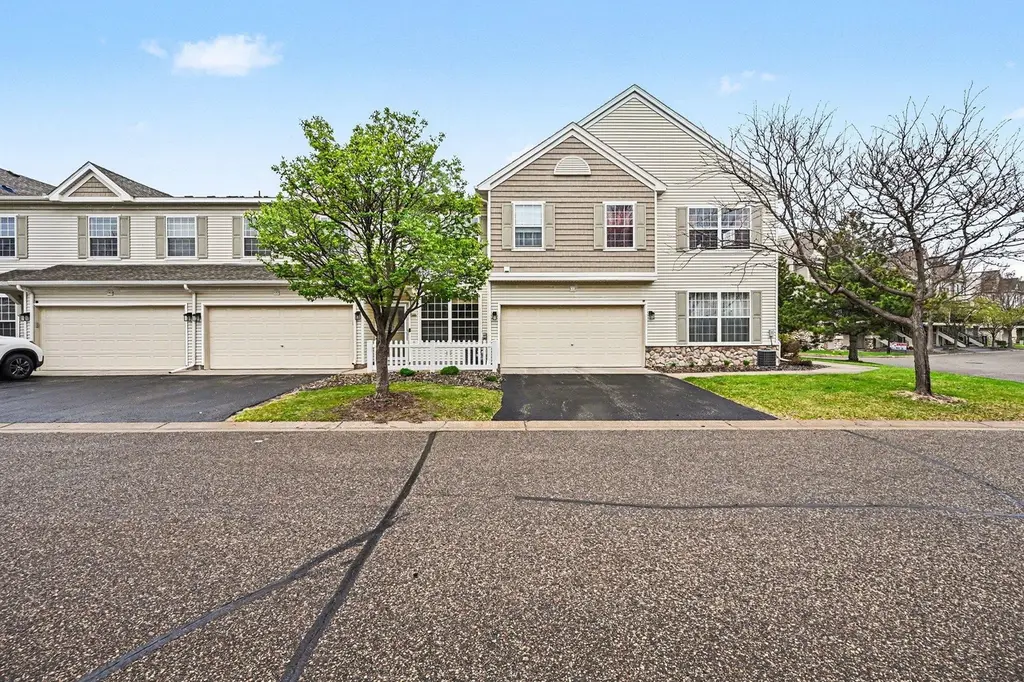
11212 Aberdeen St NE Unit C · Blaine, MN
Flood risk 1/10 · Minimal
- FEMA flood zone
- X (unshaded)
- Chance of flooding over 30 yrs
- 0.0%
- Est. flood insurance / yr
- $507 – $1,088
Fire risk 1/10 · Minimal
- Est. fire insurance / yr
- $888 – $1,650
Heat risk 2/10 · Minimal
- Hot days now (above 100°F)
- 7 days/yr
- Hot days in 30 yrs
- 14 days/yr
Wind risk 2/10 · Minimal
- Chance of severe wind over 30 yrs
- —
Air-quality risk 2/10 · Minimal
- Unhealthy air days now
- 2 days/yr
- Unhealthy air days in 30 yrs
- 2 days/yr
Risk factors via First Street. Map © Google.
Why this score? — see what drove the D- grade
The composite is a weighted blend of 9 inputs, each scored 0–100. Each bar is that input's sub-score; the figure is the points it added to the 100-point composite (weight × sub-score).
- ARV discount +11.0/15.0
- Cash flow +8.1/30.0
- Schools +4.7/10.0
- 1% rule +3.9/10.0
- Rent growth +3.6/5.0
- Livability +3.6/5.0
- Condition / age +2.5/5.0
- DSCR +2.1/10.0
- Appreciation +0.0/10.0
$275,000
🖨 Deal sheet 📄 Offer letter ✓ Due diligence
Key facts
- $438 HOA
- 2 garage spots
- Built 2005
Property features AI
Finance
- Financial info: Conventional financing available
- HOA & community: HOA managed by Associa Minnesota; Monthly association fee of $438 covering hazard insurance, lawn care, grounds maintenance, professional management, sewer, shared amenities, snow removal, and water
Exterior
- Parking: Attached garage with 2 spaces
- Utilities: City water connected; City sewer connected; Natural gas; Electric service with circuit breakers
- Home design: Residential attached property; Two levels; Entry on main level
- Construction: Slab foundation
- Exterior features: Stone and vinyl exterior; Asphalt pitched roof
Interior
- Kitchen: Dishwasher; Microwave; Refrigerator
- Bedrooms: Two bedrooms (upper level); Second bedroom (upper level)
- Bathrooms: One full bathroom; One half bathroom
- Heating & cooling: Forced air heating; Central air conditioning
- Interior features: Open living room; Dining room
- Laundry & utility: Dryer
Neighborhood map
What this means for you Summary
Snapshot
- This is a 2-bed/2.0-bath condo listed at $275k.
Deal economics
- At list price, monthly cash flow is $-273 ($-3k/yr) — negative.
- To cash-flow at today's rent, offer at most $227k (17.6% below list).
- To meet the 1% rule (rent ≥ 1% of price), the offer needs to be $245k (11.0% below list).
- Recommended offer: $227k (17.6% below list) — sets the bar for cash-flow.
- Cap rate 5.1% vs local median 3.9% in Blaine — meaningfully above typical; check what's discounted (condition, days-on-market, listing class) to confirm the premium yield is real.
Location & tenants
- Location reads 71/100 on livability (#315 in MN) — a middle-class / working-renter tenant base. Strengths: employment A+, housing A+, crime A; Watch: amenities F, commute F.
- Anoka-Hennepin Public School District (suburban): math 49% / reading 55% proficiency, ranked #71 of 301 in MN (top 24%) — acceptable for families but not a draw, mixed tenant base, ~2y average lease.
- Market conditions: Rents rising fast (+4.4%/yr); 245 active listings in the ZIP; 3 comparable units currently listed for rent nearby; rentals leasing fast (median 2d on market — plan ~1-2 weeks tenant-placement turnaround); high-income renter base; 1,083 units permitted in Anoka County in 2024 (134 in 5+ unit buildings).
Forward outlook
- Local home prices are declining (-3.0%/yr); year-one equity from $2k of loan paydown is wiped out by about $8k of value loss. Plan a longer hold.
- Anoka County population projected at +11% by 2050 — modest demand growth; plan on rents tracking national, not racing it.
Negotiation context
- It's been on market 53 days — a 3% lower offer ($267k) is reasonable based on typical stale-listing flexibility.
- Current owner paid $198k; 39% above their basis — modest negotiation headroom, anchor on the comps not their cost.
Questions for the listing agent
- What do current leases actually rent for vs. the listed asking? Can we see a recent rent roll and the last 12 months of T-12 income?
- It's been on market 53 days. Have you received any prior offers? Is the seller open to a 18% concession, seller financing, or rate buy-down credit?
- What does the HOA fee cover, when was the last increase, and are there any pending special assessments or reserve-fund shortfalls?
- Any open or pending special assessments — roof, HVAC, plumbing, elevator, façade? What's the per-unit balance and payoff schedule, and is the seller paying it off at close or rolling it to the buyer?
- Is there a deadline driving the sale (1031 exchange, divorce, estate, relocation)? That informs how much negotiation room exists.
- Schools are B-rated — typically a magnet for longer-tenancy family renters. What's the average tenant stay here, and is there a school-zone premium baked into asking?
- The area grade is low — what's the realistic commute time and amenity access for the typical tenant pool here? Any planned neighborhood developments (good or bad) we should know about?
- What's the average days-on-market for RENTAL listings here right now (not sales)? A rising rental-DOM trend means longer vacancies and softer asking-rent achievability than the comps imply.
- What's the recent tenant-quality profile in this submarket — average credit score on applications, eviction rate, late-payment / NSF rate, and stable-employment percentage? A property-management company in the area should have these aggregated.
- How much new apartment / multifamily construction is in the pipeline within 1–3 miles? Heavy new supply (>2% of stock underway) typically softens rents 12–24 months out; light construction supports rent growth.
Investment metrics
- 1% rule
- 0.89% ✗
- Cap rate
- 5.10%
- Cash-on-cash
- -4.26%
- DSCR
- 0.81
- GRM
- 9.4
CMA / ARV
- ARV (median comp)
- $298,244
- List price
- $275,000
- Delta
- -7.79%
- Verdict
- FAIR
- Comps
- 2 within 2.0 mi
Projected returns pro-forma
-3.0% appreciation · 4.42% rent growth · sell at horizon
- IRR
- -21.5%
- Equity multiple
- 0.24×
- Total profit
- $-58,202
- Equity at exit
- $41,003
- IRR
- -11.6%
- Equity multiple
- 0.26×
- Total profit
- $-57,205
- Equity at exit
- $23,777
Cash invested: $77,000 (down + closing). Projections, not guarantees.
Landlord ↔ Tenant lean methodology
- Overall (STATE)
- 46 Balanced
- State Minnesota
- 46 Balanced · D+2
- County
- — inherits STATE
- City
- — inherits STATE
ZIP-level market 55449
- Home prices YoY
- -23.8%
- Rents YoY
- 4.4%
- Active inventory
- 245
- Price-to-rent
- 9.4×
Monthly cashflow live
- Estimated rent
- $2,448 medium interval (Pro) →
- Mortgage (P&I)
- −$1,442
- Tax from tax record
- −$212 /mo · $2,550/yr
- Insurance
- −$115
- HOA
- −$438
- Vacancy / Maint / Mgmt
- −$514
- Net cashflow
- $-273
Break-even live
UW: 25.0% down · 7.5% · 30yr · 1.5% tax · 5.0% vac · 8.0% maint · 8.0% mgmt
Financing live
Cash to close
- Down payment
- $68,750
- Closing costs
- $8,250
- Reserves months
- —
- Total cash needed
- —
Loan-product check · same deal, 3 products live
Conventional
25% down · 7.5% · 30yr
- Down + closing
- —
- Monthly P&I
- —
- Monthly cashflow
- —
- DSCR
- —
- Eligible?
- —
Personal DTI + credit; lowest rate.
DSCR
20% down · 8.5% · 30yr
- Down + closing
- —
- Monthly P&I
- —
- Monthly cashflow
- —
- DSCR
- —
- Eligible?
- —
No personal income docs; deal must DSCR.
Hard money
10% down · 12.0% · 12mo
- Down + closing
- —
- Monthly P&I
- —
- Monthly cashflow
- —
- DSCR
- —
- Eligible?
- —
Short-term bridge; refi at stabilization.
Rent comps 3 comps
| Address | Beds | Baths | Sqft | Rent | $/sqft | DOM | Units | Dist |
|---|---|---|---|---|---|---|---|---|
| 1509 111th Dr NE Unit D Minneapolis, MN | 3.0 | 3.0 | 1792 | $2,500 | $1.40 | 1d | 1 | 0.13mi |
| 1509 111th Dr NE Unit D Minneapolis, MN | 3.0 | 3.0 | 1800 | $2,500 | $1.39 | 12d | 1 | 0.13mi |
| 1145 116th Ave NE Minneapolis, MN | 2.0 | 1.0–2.0 | 853 | $2,070 | $2.43 | 1d | 7 | 0.78mi |
HOA detail condo
- Monthly dues
- $438 · $5,256/yr
- Assessments
- None detected in remarks — confirm with the listing agent.
Listing history 18 events
-
2026-06-18days on market $275,000 Active 53 DOM
-
2026-06-17days on market $275,000 Active 52 DOM
-
2026-06-16days on market $275,000 Active 51 DOM
-
2026-06-15days on market $275,000 Active 50 DOM
-
2026-06-13days on market $275,000 Active 48 DOM
-
2026-06-13days on market $275,000 Active 47 DOM
-
2026-06-09days on market $275,000 Active 44 DOM
-
2026-06-08days on market $275,000 Active 43 DOM
-
2026-06-07days on market $275,000 Active 42 DOM
-
2026-06-04days on market $275,000 Active 39 DOM
-
2026-06-03days on market $275,000 Active 38 DOM
-
2026-06-02days on market $275,000 Active 37 DOM
-
2026-06-01days on market $275,000 Active 36 DOM
-
2026-05-31pricedays on market $275,000 Active 35 DOM
-
2026-04-27$279,000 Active 516-char remark
-
2019-12-03soldstatus $198,000
-
2017-09-06soldstatus $170,100
-
2010-05-11soldstatus $145,000
ⓘ Source: listings_history table (triggers on properties + properties_extension) + one-shot
backfill from property_details.listing_events for pre-trigger history.
Tax reassessment forecast MN · Partial reset (capped growth)
- Current annual tax
- $2,550 · $212/mo
- Projected year-2 tax
- $2,815 · $235/mo
- Expected delta
- +$265/yr (+$22/mo · 10.4%)
ⓘ Screening estimate from a state-policy table — verify with the county assessor before closing.
Climate risk First Street
- Flood 1/10 Low FEMA zone X (unshaded) · 0% chance over 30 yrs
- Wildfire 1/10 Low
- Heat 2/10 Low 7 d/yr ≥100°F today · 14 d/yr by 30 yrs out
- Wind 2/10 Low
- Air quality 2/10 Low 2 unhealthy d/yr today · 2 by 30 yrs out
Nearby sold comps map
Loading sold comps map…
Walkable amenities ~0.75 mi
Loading nearby amenities…
Taxation est. · year 1
- Rental income
- $29,374
- − Mortgage interest
- −$15,404
- − Property taxes
- −$2,550
- − Insurance
- −$1,375
- − Repairs & maintenance
- −$2,350
- − Management
- −$2,350
- − HOA
- −$5,256
- − Depreciation
- −$8,000
- Taxable loss
- −$7,911
- Est. tax savings @ 24.0%
- +$1,899
- After-tax cash flow
- $-1,382/yr
For passive investors: Depreciation is non-cash, so a rental often shows a tax loss while cash-flowing — sheltering income. Rental losses are passive: they offset passive income freely, and up to $25,000/yr can offset ordinary (W-2) income if you actively participate and your MAGI is under $100k (phasing out to $0 by $150k); unused losses carry forward. On sale, claimed depreciation is recaptured at up to 25%, and gains may owe capital-gains tax (a 1031 exchange can defer both). Figures are a year-1 estimate at your 24.0% rate — not tax advice; consult a CPA.
Schools (NCES district)
- District
- Anoka-Hennepin Public School District
- NCES district ID
- 2703180
- Math proficiency
- 49% ▼ -14.00%
- Reading proficiency
- 55% ▼ -10.00%
- Median HH income
- $73,837
- Composite
- 46.7/100
- National rank
- #2400
- State rank
- #71 of 301 in MN
Livability — Blaine
- Score
- 71/100
- State rank
- #315
- US rank
- #7073
Category grades
Schools grade is shown separately in the Schools card above.
Census & demographics
- Census place
- Blaine, MN
- County
- Anoka County · 277,116 people
- City population
- 67,472
- Metro
- Minneapolis-St. Paul-Bloomington, MN-WI
- Population (ZIP)
- 34,443
- Household income
- $131,832
- Rent vs Own
- Severe rent burden
- 275.0
Population outlook (Anoka County) Hauer SSP2
- Today (2025)
- 375,223 people
- By 2030
- 387,850 · +3.4%
- By 2040
- 407,239 · +8.5%
- By 2050
- 417,541 · +11.3%
- By 2075
- 448,447 · +19.5%
- By 2100
- 464,954 · +23.9%
Race, ethnicity, and origin ACS 2023
- Neighborhood character
- Predominantly White (73%)
- Race & ethnicity
- White 73% Asian 10% Black 9% Two or more races 6% Hispanic / Latino 4%
- Common ancestry
- Portuguese 10% Romanian 5% Lithuanian 3%
- Foreign-born
- 14% · Canada, Vietnam, China
- Languages at home
- 79% English-only · Arabic 4% Other Asian/Pacific 4% Spanish 3%
Political lean MEDSL · Anoka
- 2024 margin
- Toss-up / Even · D 46.6% · R 51.0% · Other 2.4%
- 2008→2024 swing
- -2.0pp toward R · 2008: -2.4pp · 2024: -4.4pp
- All cycles
- 2024: R+4.4 2020: R+1.9 2016: R+9.7 2012: R+2.6 2008: R+2.4
Not yet ingested
- Civics
- —
Market trends
- HPI YoY
- ▼ -70.24%
- Current HPI
- 225.2348
- Rent YoY
- ▲ 4.42%
- Metro
- Minneapolis-St. Paul-Bloomington, MN-WI
- State GDP YoY
- ▲ 2.41%
- F500 in state
- 34
Industry mix (Fortune 500 HQ in MN)
| Industry | F500 HQs | Revenue |
|---|---|---|
| Healthcare | 2 | $407B |
|
||
| Retail | 2 | $150B |
|
||
| Consumer Goods | 2 | $32B |
|
||
| Industrial Machinery | 2 | $6B |
|
||
| Agriculture | 1 | $40B |
|
||
| Healthcare / Medical Devices | 1 | $32B |
|
||
Price history
+89.7% since first listed5 events — show timeline
- 2026-05-31 Price Changed $275,000 NORTHSTARMLS as Distributed by MLS Grid
- 2026-04-27 Listed $279,000 NORTHSTARMLS as Distributed by MLS Grid
- 2019-12-03 Sold (Public Records) $198,000 Public Records
- 2017-09-06 Sold (Public Records) $170,100 Public Records
- 2010-05-11 Sold (Public Records) $145,000 Public Records
Property tax history
+4.7%/yrLatest (2026): $2,550 · +4.9% YoY. Source: county tax records.
Cash-flow waterfall
monthlySold comps — $/sqft
last 12 mo · ≤1 miLoading sold comps…